The effect of loss-limit reminders on gambling behavior: A real-world study of Norwegian gamblers
MICHAEL AUER1, NIKLAS HOPFGARTNER1and MARK D. GRIFFITHS2*
1Neccton Ltd., London, UK
2International Gaming Research Unit, Psychology Department, Nottingham Trent University, Nottingham, UK (Received: June 5, 2018; revised manuscript received: September 11, 2018; accepted: September 20, 2018)
Background:Over the past two decades, problem gambling has become a public health issue and research from many countries indicates that a small but significant minority of individuals are problem gamblers. In Norway, the prevalence of problem gambling among adults is estimated to be just less than 1%. To help minimize the harm from gambling, the Norwegian government’s gambling operator (Norsk Tipping) has introduced several responsible gambling initiatives to help protect players from developing gambling problems (e.g., limit-setting tools, voluntary self-exclusion, personalized feedback, etc.).Aim:The aim of this study was to determine whether the receiving of personalized feedback exceeding 80% of a personally set monetary personal limit had an effect on subsequent playing behavior compared to those gamblers who did not receive personalized feedback.Methods:Out of 54,002 players, a total of 7,884 players (14.5%) received at least one piece of feedback that they had exceeded 80% of their personal global monthly loss limit between January and March 2017.Results:Using a matched-pairs design, results showed that those gamblers receiving personalized feedback in relation to limit-setting showed significant reductions in the amount of money gambled.Conclusion:Thefindings of this study will be of great value to many stakeholder groups including researchers in the gambling studiesfield, the gambling industry, regulators, and policymakers.
Keywords: gambling, problem gambling, responsible gambling tools, social responsibility, limit-setting, personalized feedback
INTRODUCTION
Gambling has become a widely viewed socially acceptable form of recreation (Stucki & Rihs-Middel, 2007) and is an enjoyable and harmless activity for most individuals. How- ever, for a small minority, severe negative consequences can follow as a result from problematic and/or addictive behavior (Meyer, Hayer, & Griffiths, 2009). Consequently, the expan- sion of legalized gambling has been identified as an important public health concern (Shaffer & Korn, 2002; Williams, Volberg, & Stevens, 2012). In addition, the number of individuals seeking assistance for gambling-related problems has received increased attention from both researchers and policymakers (Abbott, Volberg, & Rönnberg, 2004;Suurvali, Hodgins, Toneatto, & Cunningham, 2008).
In many jurisdictions, the public health sector has attempted to increase knowledge about the epidemiology of gambling, incidence of problem gambling, and the potential effectiveness of policies to mitigate gambling’s harm (Williams et al., 2012). Recently, Calado and Griffiths (2016) published a systematic review of empirical research from 2000 to 2015 concerning worldwide problem gam- bling rates comprising 69 prevalence studies. Despite different methods of measurement, it was observed that lifetime prevalence of combined problem and pathological gambling across the world ranged from 0.7% (in Denmark)
to 6.5% (in Estonia). Past-year problem gambling preva- lence varied between 0.12% and 5.8% across the world, with the highest rate being in Hong Kong.
Problem gambling in Norway
In Norway (the place where this study was carried out), there have been a number of prevalence surveys. Thefirst one was by Götestam and Johansson (2003), who conducted a problem gambling prevalence survey in Trondheim among 2,014 adult participants. They reported that 0.15% of parti- cipants were pathological gamblers (endorsingfive or more items on the DSM-IV), with a further 0.45% being consid- ered at-risk gamblers (endorsing 3–4 items on the DSM-IV).
Problem gambling (the combined rate of pathological and at-risk gambling) was more prevalent among men than women (0.95% vs. 0.28%, respectively) and among 18–30 years old age group than older age groups (1.97% vs.
0.19%).
Later studies by Lund and Nordland (2003) and Jonsson (2006) among 5,235 participants aged 15–74 years
* Corresponding author: Mark D. Griffiths; International Gaming Research Unit, Psychology Department, Nottingham Trent University, Burton Street, Nottingham, NG1 4BU, UK; Phone:
+44 115 848 2401; E-mail:mark.griffiths@ntu.ac.uk
This is an open-access article distributed under the terms of theCreative Commons Attribution-NonCommercial 4.0 International License, which permits unrestricted use, distribution, and reproduction in any medium for non-commercial purposes, provided the original author and source are credited, a link to the CC License is provided, and changes–if any–are indicated.
DOI: 10.1556/2006.7.2018.106 First published online November 12, 2018
examined problem gambling using the National Opinion Research Center DSM Screen for Gambling Problems (NODS) and the South Oaks Gambling Screen (SOGS).
They reported that in the past year, 0.3% of participants were pathological gamblers (endorsing five or more items on the NODS), with a further 0.4% being considered problem gamblers (endorsing 3–4 items on the NODS).
Using the SOGS, it was reported that in the past year, 0.2%
of participants were pathological gamblers (endorsing five or more items on the SOGS), with a further 0.4% being considered problem gamblers (endorsing 3–4 items on the SOGS). A study by Bakken, Gotestam, Grawe, Wenzel, and Øren (2009) also used the NODS on 3,482 participants aged 16–74 years and reported in the past year a rate of 0.3%
pathological gambling and 0.4% problem gambling.
A nationally representative study by Pallesen, Molde, Mentzoni, Hanss, and Morken (2016) surveyed 5,485 par- ticipants and found that 0.9% were problem gamblers using the Problem Gambling Severity Index (PGSI). Finally, in a nationally representative study of 17-year-old Norwegians, Hans et al. (2015) found that among those who gambled in the previous month and using the PGSI, 0.9% were classi- fied as high-risk gamblers.
Limit-setting as a responsible gambling (RG) tool Over the past couple of years, the gambling industry has identified social responsibility as a major cornerstone of their business (Harris & Griffiths, 2017). The main goal of social responsibility practices in gambling is the application of procedures and tools that help minimize gambling-related harm (Griffiths & Wood, 2008). Because of its technological infrastructure, researchers (e.g.,Griffiths, 2012;Monaghan, 2009) have pointed out that many RG initiatives may actually be more effective online. Parke and Griffiths (2012) reported that information technology developments, which are helpful in reducing negative consequences asso- ciated with gambling, are endorsed by regular gamblers.
Limit-setting is one of the more widespread types of social responsibility tools (Wood & Griffiths, 2010). Using these precommitment tools, operators allow players to preset the amount of time and/or money they wish to spend on gambling in a specified time period (typically per day, week, and/or per calendar month). Some scholars and members of the gambling industry view this method as a way of putting informed player choice at the heart of RG (Griffiths & Wood, 2008). There are a number of different ways that operators can implement limit-setting. More specifically, a player’s spending can be restricted in terms of play limits, deposit limits, bet limits, or loss limits (Wood & Griffiths, 2010):
• Play limit–This is the maximum amount of money (or time) that a gambler can play with (or for) at any given time.
• Deposit limit–This is the maximum amount of money that a gambler can deposit into their playing account at any given time.
• Bet limit–This is the maximum amount of money that a gambler can bet on a single game (or concurrent games).
• Loss limit –This is the maximum amount of money that a gambler can lose in any one session or sessions.
Operators and legislators also vary with respect to the obligation of limit-setting. Wood and Griffiths (2010) noted that in some cases, limit-setting is voluntary (i.e., the gam- bler can make their own choice as to whether take advantage of the limit-setting tools on offer), whereas in others they are mandatory (i.e., the gambler has to set limits, if they want to access the games operated by a specific gambling service provider). Some gambling operators offer theflexibility for players to choose different limits for different game types (e.g., casino, sports-betting, and poker). More recently, Walker, Litvin, Sobel, and St-Pierre (2015) proposed the use of win limits. These are limits that reduce the amount of money a gambler can win. They tested this feature with a number of players and a simulated slot machine and found that a self-enforced win limit resulted in increased player performance and reduced casino profit.
Auer, Reiestad, and Griffiths (2018) reported the results of a survey of 2,352 customers of the Norwegian operator Norsk Tipping (NT). In this study, the attitude toward a newly introduced maximum monthly loss limit of NOK 20,000 [approximately €2,100 or $2,450 (US)] was investigated. The majority of players found the mandatory spending limit useful and helpful. However, a sizeable minority of high-risk gamblers (approximately one-third) had a less favorable attitude toward global money limits. This may have been possible because some of the participants in this risk group felt that the limits impeded their typical gambling activity in some way. Even so, the majority (i.e., two-thirds) of high-risk players had positive views in contrast to a study by Bernhard, Lucas, and Jang (2006) who found that gam- blers in Canada strongly opposed mandatory limits.
Empirical studies on limit-setting in gambling
Over the past 15 years, a number of studies have examined the extent to which online gambling operators include different types of limit-setting on their gambling website.
In an evaluation of the social responsibility practices of 30 British online gaming companies, Smeaton and Griffiths (2004) found that there was a wide variety of bet limits among the gaming sites they visited. The study found that minimum bet size among 30 companies was £1, whereas the maximum bet size (of those companies that set upper limits) was £20,000. Many of the gambling websites they evaluated typically had £250–£1,000 maximum bets and £10–£25 minimum bets. However, this study is now very old and carried out when social responsibility was only just emerg- ing as an issue for gambling operators.
Kazhaal et al. (2011) examined 74 online poker sites and found that less than half of these sites offered any limit- setting tools. Fifty of world’s most well-known online gambling sites were visited and reviewed by Bonello and Griffiths (2017) regarding social responsibility practices.
Out of 50 sites, 45 (90%) offered players the opportunity to voluntarily set monetary spending limits. Deposit and spending limits were the most common types of limit- setting. Spending limits by product type was only offered by one operator. Marrionneau and Järvinen-Tassopolous (2017) reviewed consumer protection among all 18 licensed online operators in France. Betting limits as well as deposit limits were offered by all 18 operators. Calvosa (2017)
reviewed 10 regulated online gambling sites in Italy and all 10 had a mandatory requirement for players to choose a deposit limit before they could play. However, in some countries, limit-setting is mandatory that explains why some researchers reported rates of 100% among operators.
In some jurisdictions, like the one in Austria, mandatory limits are introduced to protect the most vulnerable indi- viduals (Auer & Griffiths, 2013). The only way for the player to continue gambling is to choose other gaming sites that do not protect players with mandatory limits. As appropriate prevention tools, voluntary responsible gaming features require a certain level of self-awareness. Players should be introduced to responsible gaming from the very beginning of their gambling during registration on a specific site. Wohl, Gainsbury, Stewart, and Sztainert (2013) showed that players who watched an animated video prior to gambling more often stayed within their preset limits than players who did not watch the video. To the authors’knowledge, most operators who introduce limits also regularly ask their players to update them. This is also a highly recommended procedure, because players might only become familiar with their own gambling behavior over time.
Limited studies have examined the behavior of gamblers following the setting of monetary limits. Among video lottery players in Nova Scotia, a Canadian study by Focal Research Consultants (2007) found that RG features (including limit-setting tools) generally reduced the overall levels of player expenditure. However, Wood and Griffiths (2010) pointed out that the specific impact of monetary limit- setting was not separated out from the other RG features.
Since that study was published, identified video lottery terminal (VLT) play, which was a precursor for voluntary limit-setting, was discontinued in 2015 in Nova Scotia.
All other studies that have been carried out have used behavioral tracking data provided by online gambling operators. Broda et al. (2008) investigated the effects of player deposit limits among sports bettors (N=47,000) over a 2-year period using data provided by bwin Interactive Entertainment. They examined the gambling behavior of those who tried to exceed their deposit limit compared to all other players who did not. The deposit limit was simply the amount of money that was deposited into the gambler’s online account (excluding any winnings that the gambler had accumulated). At the time, data were collected in 2005, and it was mandatory forbwinplayers to set a deposit limit.
Furthermore, players could not set a limit of more than
€1,000 a day or€5,000 a month. There was also the facility for players to set their own deposit limits below that of the mandatory requirement. The results showed that only 0.3%
of the gamblers tried to exceed their deposit limit. It was argued by Wood and Griffiths (2010) that the large daily and monthly mandatory limits may have been the main reason why so few gamblers exceeded their limits. In fact, Broda et al. (2008) reported that most gamblers in their sample got nowhere near the maximum deposit limit. More specifically, 95% of gamblers never deposited more than €1,050 per month (i.e., approximately one-fifth of the monthly maxi- mum€5,000). It is also worth noting that the study did not report anyfindings relating to those who tried to exceed their own personally set expenditure limits.
Data from a random sample of 100,000 players who gambled on thewin2daygambling website during a 3-month period were analyzed by Auer and Griffiths (2013). The sample comprised 5,000 registered gamblers who chose to set themselves limits while playing on win2day, where deposits were limited to€800 per week. Overall, the results of this study demonstrated that voluntary limit-setting had a specific and statistically significant effect on high- intensity gamblers. High-intensity gamblers significantly decreased their play compared to similar players who did not choose a limit. Therefore, it was concluded that voluntary limit-setting had an appropriate effect in the desired target group (i.e., the most gaming-intense players). More specifically, the analysis showed that (in general) gaming-intense players specifically changed their behavior in a positive way after they limited themselves with respect to both time and money spent. In most of the analyses (with the exception of poker players), the setting of voluntary time duration limits was less important than voluntary monetary limits. It should also be noted that the study of Auer and Griffiths (2013) is the only study ever to analyze voluntary time limits using a real-world data set.
Messaging tools and personalized feedback in responsible gambling
In a laboratory study, Stewart and Wohl (2013) investigated the effect of a pop-up reminder concerning monetary limits.
They found that individuals were significantly more likely to stick to their limits while gambling, if they received a pop- up reminder, which informed them that they reached their preset spending limit compared to those who did not. In a similar study, Wohl et al. (2013) examined the efficacy of two different RG tools (a pop-up message and an educational-animated video) in relation to money limit adherence while gambling on a slot machine (n=72). The authors reported that both tools were effective in helping gamblers keep within their predeterminedfinancial spend- ing limits. In a virtual reality casino study of compris- ing 43 participants, Kim, Wohl, Stewart, Sztainert, and Gainsbury (2014) found that participants who were explic- itly asked to consider setting a time limit on their electronic gaming machine (EGM) play were significantly more likely to do so and spent less time gambling than those who were not given such instructions.
Munoz, Chebat, and Borges (2013) compared graphic warning signs to text-only warning signs about the negative effects of gambling. They reported that the graphic warnings were more successful than text warnings in getting gamblers to comply with the advice given, and more successful in getting participants to change their attitudes concerning gambling. They further found that the presence of family disruptions combined with graphic content increases the effectiveness for changing attitudes and complying with the warnings. Although the results of these studies support the use of RG tools, they are limited by the small sample sizes and the lack of ecological validity (i.e., the studies were carried out in a laboratory situation).
More recently, a number of studies have been carried out in real-world settings using real gamblers in real time. For instance, Auer, Malischnig, and Griffiths (2014)
investigated the effect of a pop-up message that appeared after 1,000 consecutive online slot machine games that had been played by individuals during a single gambling session. The study analyzed 800,000 gambling sessions (400,000 sessions before the pop-up had been introduced and 400,000 after the pop-up had been introduced compris- ing around 50,000 online gamblers). The study found that the pop-up message had a limited effect on a small percent- age of players. More specifically, prior to the pop-up message being introduced, five gamblers ceased playing after 1,000 consecutive spins of the online slot machine within a single playing session (out of approximately 10,000 playing sessions). Following the introduction of the pop-up message, 45 gamblers ceased playing after 1,000 consecu- tive spins (i.e., a ninefold increase in session cessations). In the latter case, the number of gamblers ceasing play was less than 1% of the gamblers who played 1,000 games consecutively.
In a follow-up study, Auer and Griffiths (2015a) argued that the original pop-up message was very basic and that redesigning the message using normative feedback and self- appraisal feedback may increase the efficacy of gamblers ceasing play. As in the previous study, the new enhanced pop-up message appeared within a single session after a gambler had played 1,000 consecutive slot games. In the follow-up study, Auer and Griffiths (2015a) examined 1.6 million playing sessions comprising two conditions [i.e., simple pop-up message (800,000 slot machine ses- sions) vs. an enhanced pop-up message (800,000 slot machine sessions)] with approximately 70,000 online gam- blers. The study found that the message with enhanced content more than doubled the number of players who ceased playing (1.39% who received the enhanced pop-up compared to 0.67% who received the simple pop-up).
However, as in Auer et al.’s (2014) previous study, the enhanced pop-up only influenced a small number of gamblers to cease playing after a long continuous playing session. At present, these two research studies (i.e.,Auer &
Griffiths, 2015a; Auer et al., 2014) are the only ones to examine the efficacy of pop-up messaging in a real-world online gambling environment comprising actual online gamblers.
An experimental study conducted by Auer and Griffiths (2016) with online gamblers from the Norwegian operator NT manipulated the effect of three different types of personalized feedback (personalized feedback, normative feedback, and/or a recommendation). The players were randomly assigned to the specific types of feedback. Com- pared to the control group (receiving no feedback at all), all five groups that received some kind of feedback significantly reduced their gambling behavior as assessed by theoretical loss [i.e., the amount of money wagered multiplied by the payout percentage of a specific game played (Auer &
Griffiths, 2014)], amount of money wagered, and gross gaming revenue. The results supported the hypothesis that personalized behavioral feedback enables behavioral change in gambling but that normative feedback did not appear to change behavior significantly more than personalized feedback.
Wohl, Davis, and Hollingshead (2017) investigated the use of a RG tool that provided personalized feedback to
players about how much they had won or lost during a 3-month period. Using tracking data from EGM players provided by the Canadian gambling operator Ontario Lottery and Gaming, they found that when players were asked to state whether they thought that the actual amount lost was more or less than they had expected, players who underestimated their losses (i.e., those who lost more money than they thought) reduced the amount they wagered and the amount they lost in the subsequent 3 months. These results suggest that informing gamblers about their expenditure appear to change subsequent gambling behavior.
Contextual background of the present study
In October 2016, NT (the Norwegian Government-owned gaming company) introduced a new global limit-setting procedure for all players.NT’sproduct portfolio comprises lottery, casino, sports betting, and VLTs, and players can either play offline or online (using computers, laptops, tablets, and smartphone). To play on NT games, players have to use a player card. It should also be noted that this is not a customer loyalty card, but a card that was specifically introduced from a RG perspective so that a customer’s play is individually identified across all NT products. Conse- quently, all games played (apart from the buying of scratch- cards offline) can be monitored using behavioral tracking technology. Therefore, each and every players’bet, win, or loss is recorded on every different game they play.
The global limit is a maximum allowed loss per month, which is NOK 20,000 per month across all games and all sales channels [NOK 20,000 equals approximately €2,100 or $2,450 (US)]. For specific game categories in digital channels, it is mandatory for all customers to set a personal global limit before they can play these games. This require- ment applies to games classified as medium- to high-risk games (using the game design evaluation tool Gamgard).
Players who only play lotteries and pool sports games can play without choosing a personal global limit. In physical channels, customers can also play without choosing a personal global limit, but they are of course bound by the maximum loss limit of NOK 20,000. If players want to play online casino/bingo/scratchcards in digital channels, they also have to choose a personal maximum daily and monthly loss limit specific to this game group. This limit has a maximum daily loss limit of NOK 4,000 and a maximum monthly loss limit of NOK 10,000. On VLTs, there is a maximum daily (NOK 2,700) and monthly (NOK 4,400) loss limit specific to that channel and players must choose a lower personal daily and monthly VLT loss limit.
The present study
Apart from introducing a global loss limit, a personal global limit, limits for the digital gaming channel, and limits for VLTs, NT also introduced a personal feedback tool. If players exceed 80% of their personal global limit they are informed of this through a pop-up message or a text message (depending on whether they play online or in physical channels). The message includes a link that informs players about their remaining available budget for the rest of the month. It has been shown that voluntary limit-setting and
pop-up reminders can have a positive effect on subsequent playing behavior. The set-up of this study can in a way be viewed as a real-world analogue of the studies conducted by Stewart and Wohl (2013) and Wohl et al. (2013) in which the effect of pop-up messages on the adherence of limit- setting was tested. Both of these previous studies were laboratory studies and only the effect of the adherence to the preset limit within a gambling session was tested. This study tested whether players receiving feedback about exceeding 80% of the monthly personal global loss has an effect on their gambling behavior in the following months.
Players voluntarily chose their monthly personal global loss.
METHODS
Participants
The authors were given access to a 20% random sample of all active NT players from September 2015 to September 2017. From this sample, 54,002 NT players had chosen a personal global monthly loss limit up to and including December 31, 2016. An individual setting a valid personal global monthly loss limit was one of only two inclusion criteria for this study. The second inclusion criterion was that players had to have played at least one game across any channel (online casino, VLT, sports betting, lottery, etc.) during the first quarter of 2017. The maximum monthly loss limit of NOK 20,000 was introduced in September 2016. The average age of participants was 41.73 years (SD=13.34) years and the percentage of females was 27%.
The most recent valid personal global monthly loss limit that 54,002 players had set before December 31, 2016 was recorded, as well as the total amount of money gambled and theoretical loss in thefirst quarter of 2017. The information was also available per game type. Out of 54,002 players, a total of 7,884 players (14.5%) received at least once piece of feedback that they had exceeded 80% of their personal global monthly loss limit between January and March 2017. To assess the effect on subsequent behavior, the average amount of money gambled per game and the theoretical loss between May, June, and July 2017 were measured. In the remainder of the present paper, January–March 2017 will refer to time period 1 (T1), and May–July 2017 will refer to time period 2 (T2). The present authors wanted to evaluate whether the loss-limit reminder had an effect on future gambling behavior beyond what had been studied in previous studies (i.e., in-session behavior or 1–2 weeks after the reminder message had been shown). The authors usedt-tests for data with a normal distribution,F-tests for data involving more than two groups, and Kruskal–Wallis tests for data with non- normal distributions.
Rationale for matched-pairs design
The aim of this study was to determine whether the receiv- ing of personalized feedback had an effect on subsequent playing behavior compared to those gamblers who did not receive personalized feedback. However, it is not appropri- ate to simply compare the behavioral change from T1 to T2 between the players who received feedback and the players
who did not receive feedback, because there may be other differences between those two groups of players that may affect the results (age, gender, money gambled on the games played, time spent gambling, limits chosen, etc.).
After the data were provided, the present authors gave very careful consideration to all of the ways in which the data could be analyzed. Following an initial inspection of the data, it became clear that analyzing the behavioral change from T1 to T2 for gamblers who received feedback (i.e., within-group analysis) would not be meaningful, because there was very large variation in the amount of money that individual gamblers spent. For instance, some gamblers spent a lot of money on every gambling session, whereas others spent very little. The resulting mean average differences in terms of money spent between T1 and T2 would therefore likely be spurious because of the large individual differences in gambling behavior. Furthermore, there was no way of assessing whether the difference in the amount of money spent within group was statistically significant, because there was no reliable comparison point.
Therefore, a control group was required.
One way to determine a valid control group is using a matched-pairs design in which similar players out of the population are assigned to each of 7,884 target group members who received feedback between January and March 2017. They could receive feedback at most thrice, because 80% of the monthly limit can only be reached once a month. The control group population only comprised gamblers who did not receive the feedback that they had exceeded 80% of the global spending limit but who were most similar to the target group with respect to their behavior between January and March 2017. All players (both 7,884 target group members and 46,518 control group members) had a personal monthly loss limit. Another option could have been to select land-based players who do not have to choose a personal monthly maximum loss limit as the control group. However, this only applies to players who play pool-sports games and the lottery. Compared to online casino games, these are entirely different types of games with regard to many structural characteristics, such as payout ratio and event frequency. For that reason, the aforementioned control group was chosen. Matched pairs for the target group members were chosen using the follow- ing criteria and were very similar to the procedure employed by Auer and Griffiths (2015b):
– Age:control group members had to be in the same age group as the target group member. Age groups were derived from Wardle et al. (2011) where age was categorized into <24, 24–34, 35–44, 45–54, 55–64, 65–74, and>74 years.
– Gender: control group members had to be the same gender as the target group member for matching purposes.
– Theoretical loss between January and March 2017:
control group members had the same theoretical loss as the target group. For instance, if a target group member’s theoretical loss was NOK 1,000, the control group member’s theoretical loss needed to be within NOK 900 to NOK 1,100 in order to be considered for matching purposes.
– Amount of money gambled between January 1 and March 31 (2017): control group members had gambled the same amount of money as the target group. For instance, if a target group member’s amount gambled was NOK 10,000, the control group member’s amount gambled needed to be within NOK 9,000 to NOK 11,000 in order to be considered for matching purposes.
– Game preference between January 1 and March 31, 2017: control group members had the same game-type preference as the target group. For instance, if a target group member gambled on the lottery, online casino, and live sports betting and nothing else, the target group member had to show the same profile to be considered for matching purposes.
This matching procedure ensured that a target group member was assigned one or more control group members only if the monetary gambling intensity, demographic profile, and game-type preference were most similar.
It has been reported that demographic variables correlate with gambling behavior. Potenza et al. (2001) reported gender-related differences in underlying motivations to gamble and in problems generated by excessive gambling.
They concluded that different strategies may be necessary to maximize treatment efficacy for men and for women with gambling problems. Several studies have reported playing bingo to be more frequent among female players than other types of games (e.g., Donati, Chiesi, & Primi, 2013;
Griffiths & Bingham, 2002;Hing & Breen, 2001; Tavares et al., 2003). Braverman, LaPlante, Nelson, and Shaffer (2013) found that the number of game-types is relevant with respect to gambling-related risk. They reported two high- risk groups (i.e., groups in which 90% of the members were identified bybwin.party’sRG program). Group 1 engaged in three or more gambling activities and displayed high wager variability on casino-type games. Group 2 engaged into two types of gambling activities and evidenced high variability for live action wagers. Afifi, LaPlante, Taillieu, Dowd, and Shaffer (2014) reanalyzed the data from the nationally representative Canadian Community Health Survey and showed that after adjusting for gambling in- volvement, gender and age no longer moderated the corre- lation between frequency of play and game type. In order to understand gambling behavior, Afifiet al. (2014) suggested a shift toward a more complex model, which should incor- porate the level of gambling involvement compared to only demographic variables.
All of the five criteria in this study (i.e., age, gender, theoretical loss, amount bet, and game preference) were weighted equally. For that reason, each target group member was matched with none, or one or more control group members (as described above). Out of 7,884 target group players who had received at least one feedback message during January–March 2017, 4,692 (60%) were assigned at least one control group member who did not receive any feedback. Therefore, 40% of the target group members did not match any control group member with respect to thefive criteria. They were subsequently discarded from the analy- sis. If a target group member was matched with several control group members, the average theoretical loss and
amount bet from May to July 2017 were computed for all the matched control group players for this specific target group member. The matched players were thus aggregated to one
“virtual”control group player for each target group player.
In order to determine the effect of each player, the theoreti- cal loss and amount bet in T2 were divided by the theoretical loss and amount bet in T1. This indicator is subsequently termed the “ratio.”
The smaller the ratio, the lower the subsequent gambling intensity (in terms of theoretical loss and amount bet), and therefore the higher the effect of the personalized feedback message(s). Each target group member’s computed ratio was compared to the ratio of the respective virtual matched- pairs player, both for theoretical loss and amount of money gambled. If a target group member’s ratio was smaller than the respective control group’s ratio, it was concluded that the target group member’s behavior decreased more as a consequence of the personalized feedback compared to the control group members who did not receive this informa- tion. Therefore, for each target/control pair, a binary vari- able was computed. The actual difference was not analyzed, because the different target/control pairs showed large individual variation. The way the study was designed was to ensure that the gambling behavior between the two groups was comparable (and is why the matched-pairs design was chosen).
Ethics
Ethical approval for the study was given by the research team’s university ethics committee and was carried out in accordance with the Declaration of Helsinki.
RESULTS
Gamblers using the personalized feedback system
A total of 7,884 players received feedback about reaching 80% of their personal monthly loss limit during January to March 2018. The feedback was either sent through e-mail or text message. The 7,884 players who received feedback were 44.5 years old and 33.8% are female. On average, they bet NOK 36,913 (January–March 2018) and their theoretical loss was NOK 32,077. However, the median bet was NOK 3,888 and the median theoretical loss was NOK 2,180. This large difference between mean and median represents that a small number of players generate a large bet and theoretical loss, respectively.
Table 1 shows the mean and standard deviation of a number of metrics for 4,692 players who received feedback that they had reached 80% of their global loss limit during January–March 2017 and were assigned to at least one player from the control group. The average bet and theoret- ical loss were much smaller compared to all players who received feedback. The differences for both metrics were significant between the players who had at least one match and players who do not have a match (t=28.5,df=3,297.1, p<.0001;t=27.503, df=3,297.5,p<.0001). The differ- ence was smaller with respect to the median amount bet and the median theoretical loss. These were NOK 2,525 and
NOK 1,342, respectively. The differences for both metrics were significant (χ2=2,728, df=1, p<.0001; χ2=2,951, df=3297.5,p<.0001) between the players who had at least one match and players who do not have a match. The control group comprised 46,518 players. The average age was 41.2 years and 25% were female. On average, players in the control group bet NOK 10,040 (January–March 2018) and their theoretical loss was NOK 8,391. These spending amounts were lower compared to 7,884 players who received loss-limit feedback and support the hypothesis that all high-spending players receive feedback at least once and are thus not part of the control group. On average, each target group member was matched with 17 control group players. The minimum number of matches was 1 and the maximum was 120. Out of the 46,518 players from the control group, 19,188 players were matched at least once with one of the 4,692 players who received feedback. The assignment of multiple controls to one was based on the recommendations of Miettinen (1969). More recently, Ming and Rosenbaum (2000) noted that matching with afixed number of controls may remove only 50% of the bias in a covariate, whereas matching a variable with many controls may remove 90% of the bias.
Age and gender distribution of samples
The average age of 4,692 players was 44 years (SD=13) and 37% of the players were female.
Gambling behavior
On average, 4,692 players bet NOK 6,035 over a 3-month period and the theoretical loss was NOK 4,387. On average, players played for 20 days during this period. Table1also reports the game-type-specific involvement. Almost all (99.2%) of the participants played the lottery, with 56.8%
playing via a digital channel (scratchcards and casino
games). Gamblers also played online casino (9.5%), pre- match sports betting (20.7%), and pool sports betting (15%).
Responsible gambling behavior
The average personal monthly global limit was NOK 1,252 and 3% of the group were high-risk players according to the player-tracking toolPlayScan. PlayScanis a player-tracking tool that classifies players into one of three risk groups (“green,” “yellow,” and “red”), according to their actual playing behavior where red indicates that the player is at high risk of problem gambling, yellow indicates the player is at medium risk of problem gambling, and green indicates the player is at low risk of problem gambling (Forsström, Hesser, & Carlbring, 2016; Griffiths, Wood, & Parke, 2009;Wood & Wohl, 2015). All of 4,692 players received at least one feedback message that they had lost more than 80% of their personal monthly global limit. On average, players received a feedback message 1.7 times. Only a small minority of the players (0.23%) chose the maximum monthly global limit (i.e., NOK 20,000) as their personal limit.
Effect of personalized feedback
The effect that personalized behavioral feedback had on subsequent theoretical loss and playing duration of those who received feedback that they had lost 80% of their monthly limit was then statistically analyzed and compared with that of the control group. It was assumed that any difference between the gambling behavior in the two groups could be due to chance and would be similar to the tossing of a coin. For that reason, it was assumed under the null hypothesis that in 50% of the cases the target group’s gambling behavior (as measured by time and money spent) would be higher than the control group’s gambling behav- ior, and in 50% of the cases the control group’s gambling behavior (as measured by the amount of money gambled and theoretical loss) would be higher than the target group’s gambling behavior. Therefore, it was assumed that any deviation from the distribution would be due to the effect of the feedback message(s). Consequently, the difference between the actual observed percentage and the expected percentage (50%) of gambling behavior was statistically examined.
Of the 4,692 target group members, 3,019 (64%) showed a smaller theoretical loss ratio and 2,942 (63%) showed a smaller bet amount ratio (compared to the ratio of the matched control group members). Among these target group members, overall gambling behavior (as assessed by theo- retical loss and amount of money gambled) decreased more after a feedback message was sent than among the matched control group members. The resulting ratios reported above were compared to the expected ratio of 50% using az-test.
The results showed significant differences for both theoreti- cal loss (Z=19.65, p<.001) and amount of money bet (Z=17.41, p<.001). Therefore, personalized behavioral feedback had the desired impact on subsequent playing behavior with respect to monetary spending. The actual ratio between the amount bet and theoretical loss from May to July compared with January to March supports the Table 1.Descriptive statistics of the 4,692 players who received a
feedback message saying they had reached 80% of their global loss limit compared to matched controls (January 1 to March 31, 2017)
Variable Mean SD
Number of matched controls 17.3 19.6
Age 44.5 13.1
Female 37% 0.5
Amount bet 6,035 23,392
Theoretical loss 4,387 21,795
Number of playing days 20 15
VLT (bingo shops) 0.1% 0.0
VLT (kiosks) 0.7% 0.1
Lottery 99.2% 0.1
Digital channel 56.8% 0.5
Pre-match betting 20.7% 0.4
Live sports betting 6.0% 0.2
Pool sports betting 15.0% 0.4
Online casino 9.5% 0.3
Personal global monthly limit 1,252 1,506.3
PlayScan risk 3% 0.2
Number of 80% feedback 1.7 1.0
Maximum global monthly limit 0.23% 0.0
Note. SD: standard deviation; VLT: video lottery terminal.
findings. In the target group, the theoretical loss ratio was 1.0994, which means that on average, players’theoretical loss increased by 9.994%. Among the matched controls, the theoretical loss increased by the factor 1.5455. The corre- sponding values for amount bet were 1.0931 and 1.379 for the target group and the matched controls, respectively.
Therefore, in both cases, the matched controls increased their gambling more than the target group. This is particu- larly interesting given that the matched controls were com- posed of an average across several matched players that usually leads to a smoothing of the distribution.
Personalized feedback and gambling intensity
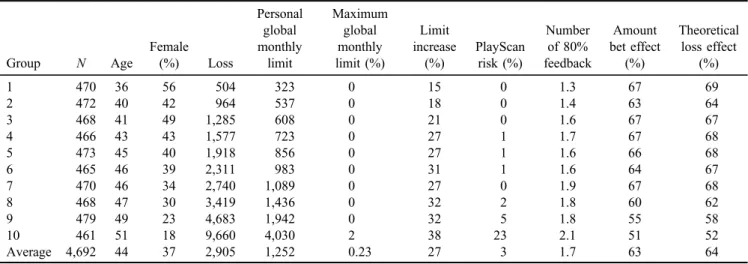
Analysis was also carried out to see if gambling intensity was associated with the effect of personalized feedback. To do this, 4,692 target group members were divided into 10 equally sized groups according to their actual losses between January 1 and March 31, 2017. Table2shows the number of target group members in each group. As the amount lost was used to classify the players, the amount monotonically increased from Group 1 to Group 10. Four hundred seventy players in Group 1 on average lost NOK 504 in thefirst quarter of 2017 and the respective value in Group 10 was NOK 9,660. As noted above, the average age of the sample receiving personalized feedback was 44 years and it is evident that age was correlated with the amount of money lost. In Group 1, the players were 36 years old and in Group 10, the players were 51 years old. The age difference across the groups was significant (F=67.46, df=9, p<0.0001).
The percentage of females steadily decreased with loss size. The results indicated that 56% of players in the lowest loss segment were female compared to 18% female players in the highest loss segment (F=27.75,df=9, p<.0001).
The personal monthly global limit increased as a function of gambling intensity. In Group 1, the personal monthly global limit was NOK 323 and in Group 10 it was NOK 4,030 (F=452.6,df=9,p<.0001). As noted above, the percent- age of players who chose the maximum monthly global limit was very low. In the highest loss group, it was
approximately 2% compared to 0% in the lowest loss group (F=7.265, df=9, p<.0001). Players can change their monthly limit at any time. They can either decrease the limit or increase it. Limit decreases take effect immediately whereas limit increases are only take effect on thefirst day of the following month. The column limit increases reported in Table2shows the percentage of players who increased their limit at least once between January 1 and March 31, 2017.
The results indicated that 15% of players increased the monthly limit at least once in the lowest loss group com- pared to 38% of players who increased the monthly limit at least once in the highest loss group (F=9.637, df=9, p<.0001). Overall, 3% of players were classed as high- risk gamblers by PlayScan. In Group 10, 23% of players were high risk compared to 0% in Group 1 (F=87.11, df=9, p<.0001). The greater the gambling intensity among players, the more often they received feedback on whether they had reached 80% of their global loss limit. On average, players receive the feedback message 1.7 times, but in Group 10 they receive the message 2.1 times (F=26, df=9, p<.001).
The two columns in Table 2(“amount bet effect”and
“theoretical loss effect”) show the percentage of target group players where the ratio for the target group member was lower than that of the control. A value greater than 50%
means that the target group members decreased their gam- bling intensity more than the control group in May 1 to July 30, 2017 compared to January 1 to March 31, 2017. A value of 50% means that the target group’s behavior changes the same way as the control group. Any positive deviation from 50% supports the alternative hypothesis. For both the amount of money gambled and theoretical loss, the three most intense groups showed the lowest value. Apart from Group 10 (Z=.23,df=458,p=.40), the effect was signifi- cant across all nine groups (Group 1: Z=7.29, df=468, p<.001; Group 2: Z=5.8, df=470, p<.001; Group 3:
Z=7.21, df=466, p<.001; Group 4: Z=7.23, df=464, p<.001; Group 5:Z=6.94, df=471, p<.001; Group 6:
Z=6.07, df=463, p<.001; Group 7: Z=7.56, df=468, p<.001; Group 8:Z=4.53, df=466, p<.001; Group 9:
Z=2.24,df=477,p<.001).
Table 2.Descriptive statistics and effect of behavioral feedback for 10 equally sized groups according to actual losses from January 1 to March 31, 2017
Group N Age
Female
(%) Loss
Personal global monthly
limit
Maximum global monthly limit (%)
Limit increase
(%)
PlayScan risk (%)
Number of 80%
feedback
Amount bet effect
(%)
Theoretical loss effect
(%)
1 470 36 56 504 323 0 15 0 1.3 67 69
2 472 40 42 964 537 0 18 0 1.4 63 64
3 468 41 49 1,285 608 0 21 0 1.6 67 67
4 466 43 43 1,577 723 0 27 1 1.7 67 68
5 473 45 40 1,918 856 0 27 1 1.6 66 68
6 465 46 39 2,311 983 0 31 1 1.6 64 67
7 470 46 34 2,740 1,089 0 27 0 1.9 67 68
8 468 47 30 3,419 1,436 0 32 2 1.8 60 62
9 479 49 23 4,683 1,942 0 32 5 1.8 55 58
10 461 51 18 9,660 4,030 2 38 23 2.1 51 52
Average 4,692 44 37 2,905 1,252 0.23 27 3 1.7 63 64
DISCUSSION
This study investigated the effect of players receiving an automated message informing them that they had reached 80% of their loss limit and the effect on subsequent gam- bling behavior (as measured by the amount of money bet and their theoretical loss). Players atNT have to choose a monthly loss limit, which applies to most games (except lottery and sports pool betting) and once their monthly loss exceeds 80% of that preset limit, they receive an e-mail or a text message, depending on where they play. Using a matched-pairs design, thefindings of this study demonstrat- ed that those gamblers receiving personalized feedback in relation to exceeding 80% of their monetary monthly limit showed significant reductions in the amount of money they gambled and their theoretical loss. Not all of the 7,884 players who received feedback were matched with players from the control group. The group of 4,692 players who received feedback on exceeding 80% of their monthly monetary limit (and who were matched with controls) played significantly less compared to all of the 7,884 players. The main reason for the lack of matched controls among the remaining 3,192 players was because of the high gambling intensity in this group. All of the players who played most intensely received at least one piece of feedback at one point of time and therefore could not be matched with any player from the control group who by definition did not receive any feedback. Age was positively correlated with gambling intensity across the 10 groups (categorized from least intensive gamblers to most intensive gamblers).
Whereas players in Group 1 with the lowest intensity were 36 years old on average, players in Group 10 were 51 years old on average. Apart from the top 10% most intense players, the message that they had exceeded 80% of their monthly monetary limit had a significant effect in all of the other nine groups. Across all 10 groups, 2% were classed as being at risk according to the player tracking system PlayScan. Among the top 10% of players, 23% were classed as being at risk.
A correlation between age and gambling intensity was found in a previous real-world study. In their study of 48,114 individuals who opened an account with the Internet betting service providerbwinduring February 2005, Broda and Shaffer (2012) found that high-risk gamblers were slightly older than low-risk gamblers. In this study, the most intense players did not show a gambling reduction after receiving the message that they had exceeded 80% of their monthly monetary limit. In their real-world experimen- tal study, the participants in Auer and Griffiths’(2016) study were provided with information about their losses over the past 6 months. The personalized feedback did not lead to a reduction of gambling expenditure among the highest spending casino players.
To date, only a few studies have investigated the effects of voluntary limit-setting in a real-world environment (e.g., Auer & Griffiths, 2013;Broda et al., 2008). Pop-up messages, which warn players about the nature of gambling or inform them about their own gambling behavior (e.g., money lost), are becoming regularly used player protection features by the gambling industry (Harris &
Griffiths, 2017). However, the effect on gambling behavior
has only been researched in real-world settings in a small number of studies (e.g., Auer & Griffiths, 2014, 2015a, 2015b,2016;Wohl et al., 2017).
This study found that in 63% of matched-pair compar- isons, target group players showed greater reduction than control group players in the amount of money bet following the receiving of the limit message. However, there was no significant effect among the top 10% of players with the highest losses. In this group, only 51% of the matched-pairs showed greater reductions for target group players than controls in amount of money bet. Auer and Griffiths (2015b) applied a similar matched-pairs design in their study of behavioral feedback. They investigated the effect of personalized feedback on money lost and time spent on gambling behavior over the 14-day period following the receiving of personalized feedback by players. They found that 62% of the target group players decreased their play more than the matched controls. However, in this study, the effect was assessed over a 3-month period and it was assumed by the present authors that long-term effects are more significant than short-term effects.
The loss-limit reminder in this study applied to all players at NT, except for specific land-based players. Land-based players who only play the lottery or pool-sports do not have to choose a personal monthly loss. For that reason, a matched-pairs design was chosen in which each player who received a message that they had exceeded 80% of their personal monthly monetary limit was assigned to “similar” players who did not receive a message. Matched-pairs designs are commonly used to study causal effects in retrospective studies and in situations where a randomized experimental setup is not possible (e.g., Cummings, McKnight, Rivara, & Grossman, 2002; Freedman, Gail, Green, & Corle, 1997). The null hypothesis in this study assumed that the target group would change their gambling behavior in the same way as the control group. However, this not the case. Compared to the control group, players who received feedback on their monetary spending were significantly more likely to reduce play after the feedback was received. High-spending players could not be matched with players from the control group, because the control group did not contain similar players with respect to gam- bling intensity. By definition, the control group only con- tained players who did not receive feedback. However, all high spending players at one point of time received feed- back. For this reason, no conclusions about the effects of the loss-limit reminder on high-spending players can be made.
Several studies recommend investigating the impact of feedback on long-term behavior (Auer & Griffiths, 2015b;
Wohl et al., 2013). This study is thefirst to investigate the effect of a loss-limit message over a 3-month period.
Despite the many strengths of this study, there are a number of limitations. Because players can choose their own per- sonal monthly loss limit, this study does not exclusively investigate the effect of the 80% reminder message. Players who choose very low loss limits will be more likely to receive a reminder message, compared to players who choose higher limits. However, this effect cannot be singled out because players are free to choose their personal month- ly loss. It should also be noted that the conclusions of this study do not apply to high intensity players. This is simply a
consequence of NT’s mandatory global limit. All high intensity players receive loss-limit feedback at some point of time and for this reason (and as noted above), the control group of players does not contain any matches for these players. One of the major limitations is that data were only collected from one gambling environment in one particular country (Norway). Replicating the results with other opera- tors and other gambling channels (such as electronic gambling machines) on gambling operators’websites from different countries would help further corroborate thefind- ings reported here. Another limitation is that there is no way of knowing whether the target group gambled with other online operators during the experimental period. Studies such as the British Gambling Prevalence Surveys (Wardle et al., 2007, 2011) have shown that at-risk and problem gamblers particularly engage with numerous gambling web- sites and gambling forms. Not being able to confirm such assertions via the use of self-report is arguably another limitation of the study. There is also the possibility that more than one player gambled using the same account (e.g., a husband and wife) although the number of instances where this occurred is likely to be low. Another limitation is that some players might have received the message about their spending in January whereas other players might have received a message in March. However, April was omitted to level out this effect and the fact that there was a significant behavioral change observed from May to July supports the authors’ hypothesis. In addition, this study did not distin- guish between players who received the message about exceeding 80% of their monthly monetary limit once or several times. Future studies could examine the impact on gambling behavior by comparing the impact of one message reminder compared to multiple reminders.
This is the latest study among a growing number of studies that have evaluated the efficacy of RG tools in real-world settings using real gamblers in real time and real gambling websites (as opposed to efficacy evaluations in laboratory situations where the sample size is often very small and not necessarily representative of real gamblers because of the use of convenience sampling). The results of this study are of use to many different stakeholder groups including researchers in the gambling studiesfield (who can attempt to replicate and extend this study in other jurisdictions and cultures), and the gambling industry (who can employ such RG features know- ing there is an empirical base demonstrating the efficacy of RG tools), as well as regulators and policymakers who can recommend or enforce that gambling operators utilize RG tools as a way of minimizing harm and protecting players.
Funding sources: This research was funded by Norsk Tipping, the Norwegian Government’s national lottery operator.
Authors’contribution:All authors contributed to the prepa- ration of this manuscript.
Conflict of interest: MDG’s university received funding from Norsk Tipping (the gambling operator owned by the Norwegian Government) for this research. MA was
subcontracted by Nottingham Trent University. MDG has received funding for a number of research projects in the area of gambling education for young people, social respon- sibility in gambling, and gambling treatment from Gamble Aware (formerly the Responsibility in Gambling Trust), a charitable body that funds its research program based on donations from the gambling industry. MA and MDG undertake consultancy for various gaming companies in the area of social responsibility in gambling.
REFERENCES
Abbott, M. W., Volberg, R. A., & Rönnberg, S. (2004). Comparing the New Zealand and Swedish national surveys of gambling and problem gambling.Journal of Gambling Studies, 20(3), 237–258. doi:10.1023/B:JOGS.0000040278.08853.c0 Afifi, T. O., LaPlante, D. A., Taillieu, T. L., Dowd, D., & Shaffer,
H. J. (2014). Gambling involvement: Considering frequency of play and the moderating effects of gender and age.International Journal of Mental Health and Addiction, 12(3), 283–294.
doi:10.1007/s11469-013-9452-3
Auer, M., & Griffiths, M. D. (2013). Voluntary limit setting and player choice in most intense online gamblers: An empirical study of gambling behaviour. Journal of Gambling Studies, 29(4), 647–660. doi:10.1007/s10899-012-9332-y
Auer, M., & Griffiths, M. D. (2014). An empirical investigation of theoretical loss and gambling intensity.Journal of Gambling Studies, 30(4), 879–887. doi:10.1007/s10899-013-9376-7 Auer, M., & Griffiths, M. D. (2015a). Testing normative and self-
appraisal feedback in an online slot-machine pop-up in a real- world setting. Frontiers in Psychology, 6,339. doi:10.3389/
fpsyg.2015.00339
Auer, M., & Griffiths, M. D. (2015b). The use of personalized behavioral feedback for online gamblers: An empirical study.
Frontiers in Psychology, 6, 1406. doi:10.3389/fpsyg.2015.
01406
Auer, M., & Griffiths, M. D. (2016). Personalized behavioral feedback for online gamblers: A real world empirical study.
Frontiers in Psychology, 7, 1875. doi:10.3389/fpsyg.2016.
01875
Auer, M., Malischnig, D., & Griffiths, M. D. (2014). Is‘pop-up’ messaging in online slot machine gambling effective as a responsible gambling strategy?Journal of Gambling Issues, 29(29), 1–10. doi:10.4309/jgi.2014.29.3
Auer, M., Reiestad, S. H., & Griffiths, M. D. (2018). Global limit setting as a responsible gambling tool: What do players think?
International Journal of Mental Health and Addiction. Ad- vance online publication. doi:10.1007/s11469-018-9892-x Bakken, I. J., Gotestam, K. G., Grawe, R. W., Wenzel, H. G., &
Øren, A. (2009). Gambling behavior and gambling problems in Norway 2007. Scandinavian Journal of Psychology, 50(4), 333–339. doi:10.1111/j.1467-9450.2009.00713.x
Bernhard, B. J., Lucas, A. F., & Jang, D. (2006). Responsible gaming device research report. Reno, NV: University of Nevada, Las Vegas International Gaming Institute.
Bonello, M., & Griffiths, M. D. (2017). Analyzing consumer protection for gamblers across different online gambling opera- tors: A descriptive study.Gaming Law Review and Economics, 21(3), 278–285. doi:10.1089/glre.2017.2134