Cite this article as: Hegedűs, T., Németh, B., Gáspár, P. (2020) "Challenges and Possibilities of Overtaking Strategies for Autonomous Vehicles", Periodica Polytechnica Transportation Engineering, 48(4), pp. 320–326. https://doi.org/10.3311/PPtr.15848
Challenges and Possibilities of Overtaking Strategies for Autonomous Vehicles
Tamás Hegedűs1*, Balázs Németh2, Péter Gáspár2
1 Department of Control for Transportation and Vehicle Systems, Faculty of Transportation Engineering and Vehicle Engineering, Budapest University of Technology and Economics, H-1111 Budapest, Stoczek street 2, Hungary
2 Institute for Computer Science and Control, H-1111 Budapest, Kende street 13-17, Hungary
* Corresponding author, e-mail: hegedus.tamas@mail.bme.hu
Received: 03 March 2020, Accepted: 11 March 2020, Published online: 07 August 2020
Abstract
This paper present three distinct probability-based methods for decision making and trajectory planning layers of overtaking maneuvering functionality for autonomous vehicles. The computation time of the proposed decision-making algorithms may be high, because the number of describing parameters of the traffic situations may vary in a high range. The presented clustering-based, graph-based and dynamic-based methods differ in the complexity of their computation algorithms. Since the decision-making process may require considerable online computation effort, a neural-network-based approach is presented for implementation purposes.
Keywords
overtaking, decision making, trajectory planning, autonomous vehicles
1 Introduction and motivation
Recently, the development of the autonomous vehicles has brought new challenges for engineers in the automo- tive industry. These challenges include numerous traffic situations that the autonomous vehicles must deal with, such as parking, traffic jam, highway situations, overtak- ing and car-following (Markou et al., 2019). Since most of the accidents are caused by human drivers (Singh, 2015), one of the main goals of the future vehicles is to reduce the number of the accidents. The overtaking is one of the most dangerous maneuvers during everyday traffic due to unexpected situations and high velocities. Therefore, the planning and providing performance guarantees for the overtaking maneuver are crucial tasks for the automated cars. In the recent years several methods have been devel- oped for these problems. Most of the algorithm consists of, at least, two subtasks such as decision making and trajec- tory planning (Schwarting et al., 2018).
The motion prediction of the surrounding vehicle is one of the most important features of the decision-making pro- cess. In several cases the future intentions of the vehicle are determined using probability-based approaches (Markov models) e.g. in (Guan et al., 2018; Guotao et al., 2018).
Furthermore, in the paper of (Okamoto et al., 2017)
a method can be found which uses past similarities to determine the future possible motions of the vehicle.
The paper of (Djuric et al., 2018) proposes a method using machine learning technique. Fuzzy Inference System and Q-learning framework overtaking strategies are used to determine the possible motion of the given vehicle e.g.
in (Zhang et al., 2018). In (Wissing et al., 2017), a Support Vector Machine (SVM) technique is used for the motion estimation of the surrounding vehicles.
The role of the paper is to present three own-developed methods for the motion prediction and decision-making process in overtaking maneuvers. In Section 2 a similar- ity-based method is introduced, which is able to predict the future motion of the surrounding vehicles. The method proposed in Section 3 applies graph-based algorithm to provide a computation method for collision free tra- jectory design. The last method is presented in Section 4, where the dynamical behavior of the controlled vehicle is also taken into account during the decision-making pro- cess. Section 5 presents a neural network-based solution, which exploits the results of the presented algorithms.
Finally, in the last section summarizes the efficiency of the presented methods.
2 Motion prediction-based decision making through clustering
The proposed method focuses on the motion prediction of the surrounding vehicles. The main goal of this algorithm is to identify the motion of the participants using a sim- ilarity-based approach. This method is able to take into consideration not only the autonomous vehicles, but also the human driven vehicles in the decision-making process.
Using a motion model, based on previously recorded data, the prediction can be more accurate. This recorded data includes the velocities of the vehicles, and other informa- tion associated with the traffic situation. The velocities of the vehicles can be recorded by the onboard sensors on each single vehicle or using other technologies such as V2X communication and the data can be stored on an external server (Naik et al., 2019).
The goal of the algorithm is to predict the future veloc- ity profile of a given vehicle. Since the reference velocity profile is given, (e.g. the maximum value of the velocity on the given road segment), the deviation from reference value can be easily computed. In the first step the data is divided into clusters. A cluster represents only one typical behavior of the given driver. A crucial part of the cluster- ing algorithm is to determine the actual number of clus- ters. In this algorithm the following cost function is used to select the optimal number of the clusters (Eq. (1)):
J x cj i
j N
i K
clusters = −
=
=
∑
∑
1 1, (1)
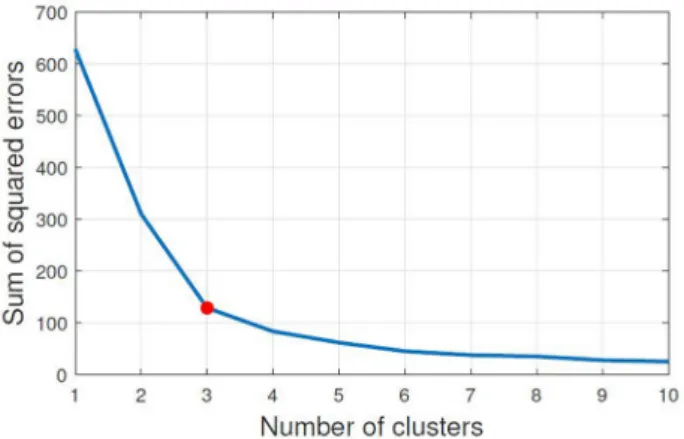
where i represents the number of the data points, and j is the center of the given cluster. Moreover, the costs can be evaluated for different number of clusters. Through the elbow method (Syakur et al., 2018) the optimal number of the clusters can be determined. Fig. 1. illustrates one result
using the mentioned algorithm, where the number of clus- ters are varied between 1 and 10. In this case the recom- mended selection for the number of clusters is 3.
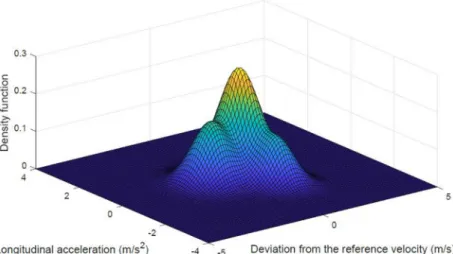
In the next step, a density function is fitted to each cluster, using normal distribution function. Note that, if there are more than 1 cluster, the sum of the density functions can be computed as fsum x f xi
i
( ) =
∑
N ( ). The final density functionis normalized using the number of data points as (Eq. (2)):
f N
N f x
x a
i i i
=
∑
K ( ), (2)where the final number of the clusters is K, and Na denotes the total number of the data points, and Ni is the number of the data points in the ith cluster. In Fig. 2. one density function is illustrated. Calculating the deviation value from the refer- ence velocity, the possible acceleration values can be deter- mined. Using the density function, the probability of being in the given road segment can be computed as (Eq. (3)):
P s si l i u f x dx
s s
i l i u
,, , ,
,
( )
=∫
, ( ) (3)where ( si,u, si,l ) the lower and upper bounds of the possible area at time step i. As a result of this algorithm, the pos- sible motions of the surrounding vehicles can be deter- mined and the predictions can be used for the computa- tion of the optimal trajectory of the controlled vehicle (Németh et al., 2018).
3 Graph-based overtaking decision algorithms
This algorithm consists of three main layers: the upper layer is responsible for the motion prediction and the mid layer determines the collision free trajectories. The lower layer uses the computed reference points to determine the feasible trajectory which can be performed by the con- trolled vehicle. In this section the decision-making layer is briefly presented, details about the further layers can be found in (Németh et al., 2019).
3.1 Division of the prediction horizon
The length of the prediction horizon can be computed as Spred = Tsvego, thus, the horizon depends on the velocity of the controlled vehicle. In the first step the whole prediction horizon is divided into discrete sets in both x and y direc- tions. Note that the width of the given road segment is con- sidered to be known. Using this information, the coordi- nates of the discrete sets can be computed, where the center
Fig. 1 Number of clusters
of the Cartesian coordinate system is the center of the grav- ity of the controlled vehicle. The coordinates of one arbi- trary chosen set can be computed as (Eqs. (4) and (5)):
x k N S
k
x pred
= , (4)
y l N W
l y
= road, (5)
where Nx and Ny specify how many sets the entire horizon is divided into.
3.2 Computation of the probability values
Since the whole prediction horizon is divided into equidis- tant discrete segments, the probability values of each set must be computed. The velocities and distances from the ego vehicle can be measured and the motion of the surrounding vehicles is predicted. Using this information, the probabili- ties of the collisions can be easily computed. For example, if the vehicle moves with constant velocity in the same lane, the algorithm gives the probability of the possible collisions at the given time step. The longitudinal prediction can be made as described in (Eq. (3)). Furthermore, the prediction method is extended with the computation of the possible col- lisions in lateral direction as well. The probability of the lat- eral vehicle motion is approximated using Gamma distribu- tion function (Mahapatra et al., 2018). The Gamma function can be computed as:
Γ( ) =α ∞
∫
x e dxα−1 −x0
. (6)
The advantage of this distribution is that it can be used for several motion models and it is easy to implement.
The Gamma distribution function is used to calculate
the density of the lateral accelerations. This value explicitly contains the curvature of the given trajectory and the veloc- ity of the vehicle at the same time. Assuming feasible tra- jectories for the surrounding vehicles, the maximum value of the curvature can be determined. The maximal lateral acceleration can be computed from the mentioned value.
Using the proposed prediction methods, the probabilities of the possible trajectories can be calculated. This computa- tion is made for the whole prediction horizon γ( ci,j ).
In the following step, one point is assigned to every discrete set. If the vehicle can reach one discrete set from another one, two points are linked to each other.
These results are projected on the prediction horizon through a directed graph as (Eq. (7)):
G=
(
V E, ,)
(7)where the points of the graph (V) are connected with the directed edges E. In Fig. 3 an example is shown, where the colors of the discrete sets represent the probabilities of collisions, together with the directed graph with the possible routes.
Fig. 2 Density function
Fig. 3 Feasible trajectories
3.3 The collision-free trajectory
In the following the directed graph (G) is aug- mented with the calculated probability values γ( ci,j ).
To any edges (Dp q, ,D∈E) between two points (P Pk l,, m n, ,m k n l≥ , ≥ ,P∈V) the probability values γ( cm,n ) are assigned. This results in a directed weighted graph, from which the collision-free trajectory can be selected.
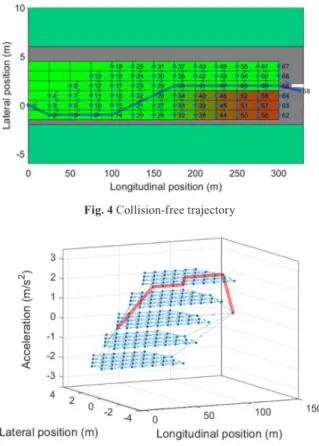
It is straightforward that the edges with lowest valued weights must be chosen. This problem can be solved using greedy algorithm, in our case Dijkstra's algorithm (Zhan, 1997) is implemented. Using the mentioned algo- rithm, the route with low collision values can be found as it is shown in Fig. 4.
It is noteworthy that there are some cases which can- not be solved only by the lateral control. In these cases, the longitudinal velocity of the controlled vehicle has to be adjusted. Thus, the decision-making algorithm is aug- mented with some extra layers. In these cases, the whole prediction horizon is also divided equidistantly in time.
A prediction map can be assigned to each layer, so using the presented greedy algorithm, the decision making is solvable. In Fig. 5 one example is presented, where the initial velocity of the vehicle is lower than the reference value, but there is another vehicle in front of it.
The algorithm proposes that the vehicle should start overtaking at the 4th point of the graph and at the same time it should start accelerating. Note that the algorithm can be used for arbitrary number of participants, since the motion prediction layer is separated from the decision- making algorithm. The size differences of the participant vehicles can be handled in the motion prediction layer.
The trajectory is built up by linear segments, so it can- not be tracked by the controlled vehicle, but using a Model Predictive Control (MPC) (Németh et al., 2019) which solves a quadratic optimization problem, a feasible trajec- tory can be calculated. Using this control algorithm, sev- eral constraints must be considered regarding the states and the control input, which guarantees the safety and the comfort requirements of the passengers.
It is important to remark that some extra weights can be added to the edge over discrete sets. This helps the com- pliance with traffic rules. For example, the vehicle can be forced going along the center of the lane or the deci- sion-making algorithm can be augmented with the longi- tudinal decision making.
4 Decision making considering dynamic parameters In the graph-based overtaking algorithm the prediction layer is separated from the layer which calculates the feasible tra- jectory with respect to any safety and comfort requirements.
The upper layer makes the decision and computes the ref- erence trajectory, although it does not use any information of the vehicle dynamics. This means that the decision and the computed feasible trajectory is may not be the optimal in some aspects. The role of this section is to briefly present a method, which takes into account the dynamics of the con- trolled vehicle during the decision- making process.
At the beginning of the process, the possible trajecto- ries are computed. Every trajectory is described with three parameters Rijk = { xsi, xfj, yfk } where xsi is the starting longitu- dinal position of the overtaking trajectory, xfj is the end of the trajectory and the final lateral value is yfk . As it is described in the previous subsection, Model Predictive Control (MPC) can be used for planning the feasible trajectory. The possible trajectories are arranged into a matrix Φ, whose elements a given feasible trajectory. Using this matrix and the com- puted trajectories, the maximum value of lateral acceleration can be determined. In Fig. 6 the feasible trajectories can be seen, where the size of the matrix is set to 4 × 4.
The resulted acceleration values can be also arranged into a similarly constructed matrix. The trajectory can be weighted by using the computed acceleration value
Fig. 5 Example on the extended graph for overtaking Fig. 4 Collision-free trajectory
to select the smoothest trajectory. The sigmoid function, which is widely applied in decision making, can be used for the weighting process (Wissing et al., 2017) (Eq. (8)):
Wlat = e m alat
− − 1
1 * . (8)
Since the possible trajectories are computed, the proba- bilities of possible collisions are determined for every tra- jectory. These values are also sorted in a matrix as well as the lateral accelerations. Moreover, the cost functions can be determined for the final lateral position of the con- trolled vehicle ( yfk ). It is necessary, because the controlled vehicle must comply with the traffic rules. The Wfin can be computed as the sum of the weights, which leads to the final optimization problem as (Eq. (9)):
min .
, , ,
x x y a fin
s f f W (9)
5 Application of neural networks in the selected overtaking algorithms
The purpose of the application of neural networks in the overtaking strategy is to reduce the number of the online computations. For example, online optimization methods can require high computational efforts, which can make its implementation difficult. Using neural networks, most of the computations can be performed offline and the neu- ral networks can be trained through the results.
5.1 Training neural networks for the graph-based overtaking
The goal of the graph-based algorithm is to find the short- est path, see Section 3. Due to the high number of choices, the graph can contain huge amount of information.
The weights are assigned to the edges, where the cal- culation of each weight is based on the geometry of the surrounding vehicles and their possible future positions.
The ultimate goal is to avoid vehicles and any other road obstacles. Using the results of this algorithm one feasi- ble trajectory is computed. Since the described method is computationally expensive, a neural network is used to make the computation faster.
For the training of the neural network to reduce the com- putational difficulties of the graph-based algorithm, large amount of training data has been generated through ran- domly selected situations. The results of the graph-based decision-making algorithm are saved. The algorithm gives the reference trajectory using linear segments, which can- not be taught with one neural network correctly. The data set has to contain the same amount of the possible cases to get a generalized network.
The idea behind the approach is that the results are converted into the form Tv = [Ob , Ow , On , a], where a is the longitudinal acceleration, Ob is a boolean value, which is set to 1 when the controlled vehicle should start overtak- ing, and to 0 in another situations. Ow provides the posi- tion, when the overtaking should be started. The value of On gives the information the final position in lateral direc- tion. The results converted into the described form; thus, the results of the decision-making algorithm can be han- dled easily. Unfortunately, the trained network cannot be accurate enough in the situations, when the controlled vehicle cannot finish the previously computed trajectory.
The algorithm can also be sensitive to errors, which must be considered during the training process. Therefore, the reference trajectory is converted into the following form Tv = [αi , a], i = 1...Nx , where the value of α is set to 0 if the controlled vehicle goes straight. The value of α is set to 1, when the vehicle goes a step to the left and to −1 if the vehicle goes a step to the right.
The input data of the neural network is sorted to the following vector: IN = [ ∆v, ypos , Di , vi ] where i = {FR, FL, RR, RL} represents the surrounding vehicles.
∆v is the deviation of the reference velocity, and ypos is the lateral position of the vehicle measured from the cen- ter of the lane on the right side of the road. In this case the prediction horizon is divided into 10 segments in longitu- dinal direction and it is divided into 7 in lateral direction.
In the example of this paper the structure of the trained neural network is the following: it contains 3 hidden lay- ers, the hidden layers contain 18-10-12 neurons. The num- ber of the hidden layers and the number of the neurons are determined using the cross-validation method. Using this method, the whole data set is divided into subset which serves the teaching of the network, and the remaining data
Fig. 6 Feasible trajectories of the overtaking maneuver
is to validate the trained network. The activation func- tion of the first and the third hidden layer is the Rectified Linear Unit (ReLU), and the second one is set to log-sig- moid functions. During the teaching process the learning rate is set to 0.05. For the training process the Levenberg- Marquardt algorithm is used (Hagan, et al., 1997).
5.2 Neural networks for dynamics-based approach In Section 4 a method is introduced, in which informa- tion about the vehicle dynamics is also used during the decision making. As it is described above, it leads to a complex optimization problem, which cannot be solved in real time. In this subsection the neural network-based solution is presented for this problem. In the first step, over 5000 different cases are evaluated where the following parameters are varied randomly. During the evaluation of the algorithm the following parameters are varied:
• the longitudinal velocity of the controlled vehicle,
• the lateral position of the controlled vehicle,
• the number of the surrounding vehicles,
• the distances and velocities of the surrounding vehicles.
The algorithm is evaluated for the different cases and the weight matrices, and the initial parameters are saved. This data set provides the training set for the neu- ral network. In this example the neural network consists of 4 hidden layers, which contain 20-25-30-20 neurons.
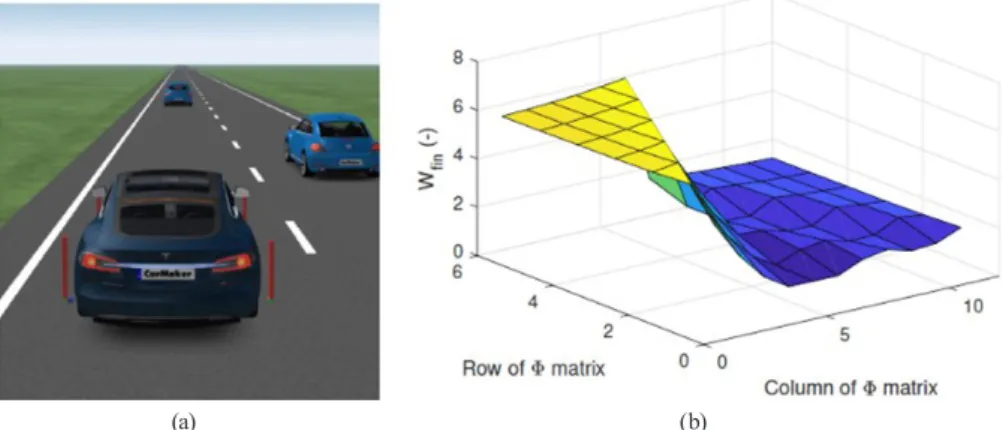
To determine the number of neurons and hidden layers, the k-fold cross validation method is used. In this case Rectified Linear Unit (ReLU) and log-sigmoid functions are used. For training the Levenberg-Marquardt algo- rithm is applied. Fig. 7 presents an example for the deci- sion-making process, which is implemented in CarMaker vehicle dynamics simulation software. On the left side
of the figure the traffic situation can be seen, and on the right side, the result of the neural network is illustrated.
The optimal decision making can be made by the selection of the minimal value of the function. In the illustration the resulted weighting matrix has low values in the actual lane, which means that the vehicle must drive straightfor- ward. The high values for left motion represent the edge of the road, while the high values for the right motion rep- resents vehicle on another lane.
6 Conclusions
The paper introduced three possible methods to make overtaking decisions for autonomous vehicles. It is also briefly shown, how the methods can be integrated to each other. The first method focuses on the motion prediction of the surrounding vehicles through clustering techniques.
The main purpose of the second, graph-based algorithm is to determine collision free trajectories in changing traf- fic situations. The aim of the third method is to extend the decision-making process with dynamic properties of controlled vehicle. Since the decision-making process can be computationally expensive, a neural network-based approach is presented, with which the high computational effort is significantly reduced through the learning of the offline computed results.
In the future the result of the trajectory design is incor- porated into the layer of the control design. Through this fusion the probability information about the actual sce- nario can be considered in the level of the control.
Acknowledgement
The research was supported by the Hungarian Government and co-financed by the European Social Fund through the project "Talent management in autonomous vehicle con- trol technologies" (EFOP-3.6.3-VEKOP-16-2017-00001).
(a) (b)
Fig. 7 Simulation example in CarMaker (a) Traffic scenario (b) Weighting function
The research reported in this paper was supported by the Higher Education Excellence Program of the Ministry of Human Capacities in the frame of Artificial Intelligence research area of Budapest University of Technology and Economics (BME FIKPMI/FM).
The work of Balázs Németh was partially supported by the János Bolyai Research Scholarship of the Hungarian
Academy of Sciences and the ÚNKP-19-4 New National Excellence Program of the Ministry for Innovation and Technology. The work of Tamás Hegedűs was partially supported by the ÚNKP-19-3 New National Excellence Program of the Ministry for Innovation and Technology.
References
Djuric, N., Radosavljevic, V., Cui, H., Nquyen, T., Chou, F. C., Lin, T.-H., Schneider, J. (2018) "Uncertainty-aware Short-term Motion Prediction of Traffic Actors for Autonomous Driving", [cs.LG], arXiv:1808.05819, Cornell University, Ithaca, NY, USA, [online] Available at: https://arxiv.org/abs/1808.05819 [Accessed:
01 March 2020]
Guan, Y., Li, S. E., Duan, J., Wang, W., Cheng, B. (2018) "Markov prob- abilistic decision making of self-driving cars in highway with ran- dom traffic flow: a simulation study", Journal of Intelligent and Connected Vehicles, 1(2), pp. 77–84.
https://doi.org/10.1108/JICV-01-2018-0003
Guotao, X., Hongbo G., Huang, B., Quian, L., Wang, J. (2018) "A Driving Behavior Awareness Model based on a Dynamic Bayesian Network and Distributed Genetic Algorithm", International Journal of Computational Intelligence Systems, 11(1), pp. 469–482.
https://doi.org/10.2991/ijcis.11.1.35
Hagan, M. T., Demuth, H. B., Beale, M. (1997) "Neural network design", PWS Publishing Co., Boston, MA, USA.
Mahapatra, G., Maurya, A. K. (2018) "Dynamic parameters of vehi- cles under heterogeneous traffic stream with non-lane discipline:
An experimental study", Journal of Traffic and Transportation Engineering, 5(5), pp. 386–405.
https://doi.org/10.1016/j.jtte.2018.01.003
Markou, I., Papathanasopoulou, V., Antoniou, C. (2019) "Dynamic Car–Following Model Calibration Using SPSA and ISRES Algorithms", Periodica Polytechnica Transportation Engineering, 47(2), pp. 146–156.
https://doi.org/10.3311/PPtr.8616
Naik, G., Choudhury, B., Park, J. M. (2019) "IEEE 802.11bd & 5G NR V2X: Evolution of Radio Access Technologies for V2X Communications", IEEE Access, 7, pp. 70169–70184.
https://doi.org/10.1109/ACCESS.2019.2919489
Németh, B., Gáspár, P., Hegedűs, T. (2018) "Optimal Control of Overtaking Maneuver for Intelligent Vehicles", Journal of Advanced Transportation, 2018, Article ID: 2195760.
https://doi.org/10.1155/2018/2195760
Németh, B., Hegedűs, T., Gáspár, P. (2019) "Model Predictive Control Design for Overtaking Maneuvers for Multi-Vehicle Scenarios", In: 2019 18th European Control Conference (ECC), Naples, Italy, pp. 744–749.
https://doi.org/10.23919/ECC.2019.8796013
Okamoto, K., Berntorp, K., Di Cairano, S. (2017) "Similarity-based vehi- cle-motion prediction", In: 2017 American Control Conference (ACC), Seattle, WA, USA, pp. 303–308.
https://doi.org/10.23919/ACC.2017.7962970
Schwarting, W., Alonso-Mora, J., Rus, D. (2018) "Planning and Decision- Making for Autonomous Vehicles", Annual Review of Control, Robotics, and Autonomous Systems, 1, pp. 187–210.
https://doi.org/10.1146/annurev-control-060117-105157
Singh, S. (2015) "Critical reasons for crashes investigated in the national motor vehicle crash causation survey", Traffic Safety Facts Crash•Stats, National Highway Traffic Safety Administration, US Department of Transportation, Washington, DC, USA, Rep. DOT HS 812 115.
Syakur, M. A., Khotimah, B. K., Rochman, E. M. S., Satoto, B. D.
(2018) "Integration K-Means Clustering Method and Elbow Method For Identification of The Best Customer Profile Cluster", IOP Conference Series: Materials Science and Engineering, 336, Article ID: 012017.
https://doi.org/10.1088/1757-899X/336/1/012017
Wissing, C., Nattermann, T., Glander, K. H., Hass, C., Bertram, T. (2017)
"Lane Change Prediction by Combining Movement and Situation- based Probabilities", IFAC-PapersOnLine, 50(1), pp. 3554–3559.
https://doi.org/10.1016/j.ifacol.2017.08.960
Zhan, F. B. (1997) "Three Fastest Shortest Path Algorithms on Real Road Networks: Data Structures and Procedures", Journal of Geographic Information and Decision Analysis, 1(1), pp. 69–82.
Zhang, M., Zhang, T., Zhang, Q. (2018) "An Autonomous Overtaking Maneuver Based on Relative Position Information", In: 2018 IEEE 88th Vehicular Technology Conference (VTC-Fall), Chicago, IL, USA, pp. 1–6.
https://doi.org/10.1109/VTCFall.2018.8690798
![theothervehiclesarealsoinmotion,thehandlingofintersectionscenariosisacomplex inthearchitectureofthecontrolsystemitcanbehandledasaspecialfeatureofapath , ].Nevertheless,consideringpositionerrorscausedbyhumanparticipants,robustcontrol ]andGPSandstereovision](data:image/gif;base64,R0lGODlhAQABAIAAAP///wAAACH5BAEAAAAALAAAAAABAAEAAAICRAEAOw==)