PROCEEDINGS OF THE
INTERDISCIPLINARY DOCTORAL SCHOOL 2012-2013 ACADEMIC YEAR
FACULTY OF INFORMATION TECHNOLOGY PÁZMÁNY PÉTER CATHOLIC UNIVERSITY
BUDAPEST
2013
Faculty of Information Technology Pázmány Péter Catholic University
PhD PROCEEDINGS
PROCEEDINGS OF THE
INTERDISCIPLINARY DOCTORAL SCHOOL 2012-2013 ACADEMIC YEAR
FACULTY OF INFORMATION TECHNOLOGY PÁZMÁNY PÉTER CATHOLIC UNIVERSITY
BUDAPEST June, 2013
Pázmány University ePress Budapest, 2013
designkisslászló
fides et ratio
© PPKE Információs Technológiai Kar, 2013
Kiadja a Pázmány Egyetem eKiadó Budapest 2013
Felelős kiadó
Ft. Dr. Szuromi Szabolcs Anzelm O. Praem.
a Pázmány Péter Katolikus Egyetem rektora
Készült a
TÁMOP-4.2.1.B-11/2/KMR-2011-0002 és a TÁMOP-4.2.2/B-10/1-2010-0014 projekt keretében, és az Új Széchenyi Terv támogatásával
A kiadvány megjelentetését az EMMI a
53724-2/2012/FOFEJL számú szerződés alapján támogatta.
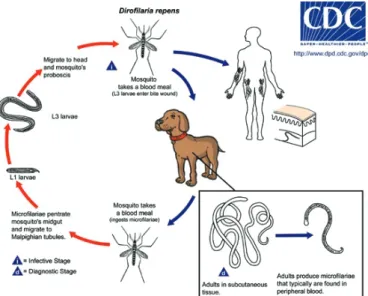
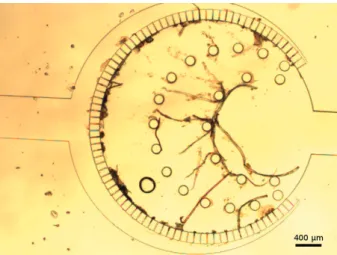
Cover image by András Laki, A simple microfluidic technique has been developed to detect living parasites from veterinarian blood using a monolithic polydimethylsiloxane (PDMS) structure. Several intravenous parasitosis can be observed by this developed
microcapillary system such as dirofilariasis or Lyme disease. Inside this microfluidic device a special flow-through separator structure has been implemented, which contains a cylindrical active zone, where the microfilariae or other few micron-size parasitic
infections remain trapped. The center region is partially surrounded by rectangular cross-section shaped microcapillaries.
TOP: Geometric description of the nematode filter; BOTTOM: The manufactured filter during veterinarian test.
A borítón Laki András ábrája látható: Az általunk fejlesztett, monolitikus (polidimetilsziloxán (PDMS)-üvegtechnikával előállított) mikrofluidikai eszköz segítségével kimutathatjuk vérben élő paraziták jelenlétét állatorvosi mintákból. Készülékünkkel több parazitológiai fertőzés detektálható, mint például a Dirofilaria fajok és a Lyme-kór. Mikrofluidikai eszközünkben egy speciális, keresztülfolyásos szűrőt implementáltunk, melynek központi aktív régiójában maradnak vissza a kiszűrt, pár mikron nagyságú
paraziták. A központi aktív régiót mikrokapilláris csatornák szegélyezik.
FELÜL: A szűrő geometriai leírása; ALUL: A legyártott szűrő állatorvosi használat során.
HU ISSN 1788-9197
Contents
I
ntroductIon7
V
amsIK
Irana
dhIKarla• Content processing for light field displaying 9 d
óraB
Ihary• Examination of bacterial mutants in open and closed models 13 B
enceJ
ózsefB
orBély• Myoelectric signal analysis using an embedded SoC 17 e
rzséBetf
arKas• Subcellular localization of the components of the nitric oxide system in
the hypothalamic paraventricular nucleus of mice 21
K
atharInah
ofer• Patterns of neuronal synchronous population activity in the human
neocortex in vitro 25
B
alázsI
ndIg• An extended spell checker for unknown words 29 a
ttIlaJ
ády• Metabolic changes during differentiation of neural stem cells 33 m
átyásJ
anI• Evaluation of speech music transitions in radio programs based on acoustic
features 37
I
mreB
enedeKJ
uhász• Simulation-based investigation of temporal and spatial
characteristics of photodynamics in two-photon microscope 41
a
ndrásJ
ózsefl
aKI• Integrated microcapillary system for microfluidic parasite analysis 47 g
áBorz
soltn
agy• Flow-through functionalized PDMS microfluidic device for sandwich
ELISA 51
d
énesP
álfI• New insights in neuroscience with two-photon lasermicroscopy 55 á
gnesP
olyáK• Effects of Fractalkine/CX3CR1 system on the development of obesity 59 n
orBerts
árKány• Biomimetic test bed hand 63 m
átés
IPos• Kisspeptinimmunoreactivity in human gonadotropin-releasing hormone
neurons 67
á
dámV
ály• A computer-aided setup for studying relations between EMG prediction,
signals and muscular activity 71
I
stVáne
ndrédy• More effective boilerplate removal: the GoldMiner algorithm 75 a
nnah
orVáth•Region-merging based on contour-structure of clusters in over-segmented
image 79
B
alázsg
yörgyJ
áKlI• High-resolution, multi-channel, FPGA-based time-to-digital
converter 83
B
alázsK
naKKer• Attentional modulation of visual cortical responses to sequential stimuli
- a Single-Trial approach 87
P
éterl
aKatos• Compressive sensing in digital in-line holography 93
e
ndrel
ászló• Multiset reordering for efficient large-scale unstructured grid simulation 97
B
alázsl
IgetI• Prioritization of cancer drug combinations by integrating drug-drug
interaction measures 101
a
ttIlan
oVáK• Improving the accuracy of morphological annotation 107 B
orBálas
IKlósI• Hungarian medical text processing - spelling correction, structuring and
distributional methods 111
z
soltg
elencsér• A computational workflow for automated genome annotation and result
validation 115
P
etrah
ermann• Resting-state functional connectivity predicts the face selectivity of
fMRI responses in the Fusiform Gyrus 119
a
ntalh
IBa• Data locality improvement for mesh computations 125 c
saBam
átéJ
ózsa• Efficient GPU implementation of lattice-reduction 129 B
álIntP
éterK
ereKes• Multimodal analysis of the human cortical spontaneous
synchronous population activity in vitro 133
m
ártonK
Iss• Digital holographic microscopy for single-shot, volumetric and fluorescent
measurements 137
g
yörgyo
rosz• Improving hungarian morphological disambiguation quality with tagger
combination 141
I
stVánr
eguly• Multi-layered abstractions for an industrial CFD application 145 J
ánosr
udan• Improved optimization methods for efficient chemical network structure
computation 149
e
mílIat
óth• Complex electrophysiological analysis of the effect of cortical electrical
stimulation in humans 153
a
PPendIx159
7
Introduction
It is our pleasure to publish this Annual Proceedings again to demonstrate the genuine interdisciplinary research done at the Jedlik Laboratories by young talents working in the Interdisciplinary Doctoral School of the Faculty of Information Technology at Pázmány Péter Catholic University. The scientific results of our PhD students show the main recent research directions in which our faculty is engaged. Thanks are also due to the supervisors and consultants, as well as to the five collaborating National Research Laboratories of the Hungarian Academy of Sciences, the Semmelweis Medical School and the University of Pannonia. The collaborative work with the partner universities, especially, Katolieke Universiteit Leuven, Politecnico di Torino, Technische Universität München, University of California at Berkeley, University of Notre Dame, Universidad de Sevilla, Universita di Catania is gratefully acknowledged.
As an important development of this special collaboration, we were able to jointly accredit a new undergraduate curriculum on Molecular Bionics with the Semmelweis Medical School, the first of this kind in Europe.
We acknowledge the many sponsors of the research reported here. Namely,
• the Hungarian National Research Fund (OTKA),
• the Hungarian Academy of Sciences (MTA),
• the National Development Agency (NFÜ),
• the Gedeon Richter Co.,
• the Office of Naval Research (ONR) of the US,
• NVIDIA Ltd.,
• Eutecus Inc., Berkeley, CA,
• MorphoLogic Ltd., Budapest,
• Analogic Computers Ltd., Budapest,
• AnaFocus Ltd., Seville,
and some other companies and individuals.
Needless to say, the resources and support of the Pázmány Péter Catholic University is gratefully acknowledged.
Budapest, June 2013.
t
amásr
osKag
áBorP
rószéKyP
éters
zolgay Head of the Jedlik Laboratory Chairman of the Board of Head ofthe Doctoral School the Doctoral School
Content processing for light field displaying
Vamsi Kiran Adhikarla (Supervisor: Péter Szolgay)
v.kiran@holografika.com
Abstract -- In this paper, we present a view synthesis method for generating multiview image sequences for 3DTV systems using a sparse set of views obtained from cameras in a multiview linear camera configuration. First, the input images are analyzed to extract information about sparse disparity and a mesh is constructed using a set of sparse disparities on all virtual views. Then, for each virtual view, pixels are interpolated inside the mesh by formulating and solving special warping functions and by fitting a uniform bicubic surface to the original data points from the input images. The method is fully automatic and can generate visually pleasing virtual views. Furthermore, we do not need any post processing operations like occlusion handling, hole filling or inpainting because of the warp driven approach. The method also supports view extrapolation in a limited range and can be implemented in real time, which is extremely needed in the present scenario.
Keywords— HoloVizio, multiview video, lightfield displays, image warping, view synthesis
I. INTRODUCTION
Stereoscopic 3D is a widely popular 3D technology for creating and enhancing the illusion of depth by presenting two perspectives of a scene separately to the left and right eye of the viewer. Very efficient and accurate methods are already available to create and handle such stereoscopic 3D data to ensure high quality end-user experience. However, in many cases two views are not sufficient to reproduce all natural 3D cues, and the user must necessarily wear glasses for 3D perception in stereoscopic 3D. Multiview autostereoscopic 3D display technology is designed to address these shortcomings of stereoscopic 3D.
Autostereoscopic 3D is a glasses free technology and the display uses a separate lens arrangement for transmitting/
blocking light in specific directions. These displays can project multiple views and also accommodate motion parallax to allow more natural 3D depth cue.
The field of view (FOV) of a multiview autostereoscopic displays is very limited because of the smaller number of views (typically 5-9). On the other hand, the transition between the two successive views is not smooth when the user moves around in front of the display. LightField Displays (LFDs) address these shortcomings of multiview autostereoscopic displays. LFDs can provide very large FOVs with continuous and smooth transition between individual views and it is also possible to extend the motion parallax in vertical direction. Fig. 1 illustrates the principle
of an LFD. An array of optical modules project light beams to hit a special holographic screen at various angles of incidence. The holographic screen then does the necessary optical transformation to distribute the light in various directions. The resulting 3D images are more natural since the light beams emitted correspond to the collection of light rays from each three dimensional coordinate in real world. HoloVizio, an LFD which is built on this principle has been proposed and developed by Holografika [5].
3D content creation today is dominated by stereo in all applications because it has less complexity, and is predicted to remain standard over many years [1]. Thus, it is needed to convert a limited number of views to a much larger number of views. LFDs support almost 20 times the interaxial distance of typical stereoscopic 3D content which makes content creation more tedious. Many ways to generate the required N views from M views (M<N) have been already proposed. These can be divided in to two main categories: depth based methods and warping based methods. Depth Image Based Rendering (DIBR) [3] is a very popular technique that falls under the first category and makes use of depth information in the scene to discriminate between different depth layers to generate virtual views.
Fig. 1.Concept of HoloVizio LFD.
In many cases, the depth generation [4] process is ill- posed and this makes it necessary to have a pre-processing algorithm, to refine the initial depth map. Fully automatic depth generation with reliable accuracy and robustness remains an unsolved problem today. On the other hand, warping based methods [1] are simple to use and completely
9
V. K. Adhikarla, “Content processing for light field displaying,”
in Proceedings of the Interdisciplinary Doctoral School in the 2012-2013 Academic Year, T. Roska, G. Prószéky, P. Szolgay, Eds.
Faculty of Information Technology, Pázmány Péter Catholic University.
Budapest, Hungary: Pázmány University ePress, 2013, vol. 8, pp. 9-12.
Content processing for light field displaying
Vamsi Kiran Adhikarla (Supervisor: Péter Szolgay)
v.kiran@holografika.com
Abstract -- In this paper, we present a view synthesis method for generating multiview image sequences for 3DTV systems using a sparse set of views obtained from cameras in a multiview linear camera configuration. First, the input images are analyzed to extract information about sparse disparity and a mesh is constructed using a set of sparse disparities on all virtual views. Then, for each virtual view, pixels are interpolated inside the mesh by formulating and solving special warping functions and by fitting a uniform bicubic surface to the original data points from the input images. The method is fully automatic and can generate visually pleasing virtual views. Furthermore, we do not need any post processing operations like occlusion handling, hole filling or inpainting because of the warp driven approach. The method also supports view extrapolation in a limited range and can be implemented in real time, which is extremely needed in the present scenario.
Keywords— HoloVizio, multiview video, lightfield displays, image warping, view synthesis
I. INTRODUCTION
Stereoscopic 3D is a widely popular 3D technology for creating and enhancing the illusion of depth by presenting two perspectives of a scene separately to the left and right eye of the viewer. Very efficient and accurate methods are already available to create and handle such stereoscopic 3D data to ensure high quality end-user experience. However, in many cases two views are not sufficient to reproduce all natural 3D cues, and the user must necessarily wear glasses for 3D perception in stereoscopic 3D. Multiview autostereoscopic 3D display technology is designed to address these shortcomings of stereoscopic 3D.
Autostereoscopic 3D is a glasses free technology and the display uses a separate lens arrangement for transmitting/
blocking light in specific directions. These displays can project multiple views and also accommodate motion parallax to allow more natural 3D depth cue.
The field of view (FOV) of a multiview autostereoscopic displays is very limited because of the smaller number of views (typically 5-9). On the other hand, the transition between the two successive views is not smooth when the user moves around in front of the display. LightField Displays (LFDs) address these shortcomings of multiview autostereoscopic displays. LFDs can provide very large FOVs with continuous and smooth transition between individual views and it is also possible to extend the motion parallax in vertical direction. Fig. 1 illustrates the principle
of an LFD. An array of optical modules project light beams to hit a special holographic screen at various angles of incidence. The holographic screen then does the necessary optical transformation to distribute the light in various directions. The resulting 3D images are more natural since the light beams emitted correspond to the collection of light rays from each three dimensional coordinate in real world.
HoloVizio, an LFD which is built on this principle has been proposed and developed by Holografika [5].
3D content creation today is dominated by stereo in all applications because it has less complexity, and is predicted to remain standard over many years [1]. Thus, it is needed to convert a limited number of views to a much larger number of views. LFDs support almost 20 times the interaxial distance of typical stereoscopic 3D content which makes content creation more tedious. Many ways to generate the required N views from Mviews (M<N) have been already proposed. These can be divided in to two main categories:
depth based methods and warping based methods. Depth Image Based Rendering (DIBR) [3] is a very popular technique that falls under the first category and makes use of depth information in the scene to discriminate between different depth layers to generate virtual views.
Fig. 1.Concept of HoloVizio LFD.
In many cases, the depth generation [4] process is ill- posed and this makes it necessary to have a pre-processing algorithm, to refine the initial depth map. Fully automatic depth generation with reliable accuracy and robustness remains an unsolved problem today. On the other hand, warping based methods [1] are simple to use and completely
Input images
Sparse disparity estimation
Warp calculation
Warping and blending
Synthetic images
Minput views Nsynthetic views LFD
Fig. 2.Concept of multiview generation & visualization on a LFD.
automatic, providing high quality results. They work directly on the input images and do not rely on depth estimation, which reduces the amount of processing. Thus it is more convenient to investigate possibility of real time implementation of such algorithms. In this paper, we present a warping based approach to synthesize the virtual views for a LFD automatically.
The rest of this paper is organized as follows. In the next section we give an overview of the system concept. Details of the algorithm are described in section 3. Then, section 4 presents the results, and finally, section 5 concludes the paper.
II. SYSTEM CONCEPT
As already mentioned in section 1, LFDs support wide FOVs and thus, the larger the number of views, the better the quality of the displayed image. The system uses an LFD requiring N views, and these N views are generated from a smaller number M of input views (M < N). Also we assume that the input Mviews are rectified i.e., the epipolar lines of all views are horizontally aligned. Fig. 2 illustrates the concept of the system.
It is a tedious task to produce the required Nviews for an LFD using Nreal time cameras because of the physical size of the cameras. Also we assume that the input images are projected to a common image plane (rectified), which imposes constraints on alignment and synchronization of the cameras. To fill the large FOV of the LFD, along with interpolation, we also extrapolate the views to a limited extent. In contrast to the DIBR methods, extrapolation does not result in serious problems due to disocclusions and hence there is no need for any further post-processing steps.
The algorithm is described in detail in the following section.
The resulting N views are processed using a lightfield converter which encodes the views in to a suitable format as required for a LFD.
III. ALGORITHM DESCRIPTION
In order to transform one view into another, we need a non- linear transformation. Information on this non-linear transformation is stored in an image, which is normally referred to as disparity map. The disparity map carries information on how much each pixel is shifted (horizontally) from one view to another. In the present algorithm, we first estimate a sparse disparity set and then use it to generate virtual views.
Fig. 3. Processing steps for virtual view generation.
Let us represent the set of input images as {I1, I2, I3...Im}.
As shown in Fig. 3, the overall algorithm contains three steps.
A. Sparse disparity estimation
Feature extraction matching is applied to detect reliable and accurate disparities. In addition to that, the extracted features are matched across all Minput images as shown in Fig. 4, to ensure the robustness of the extracted features.
B. Warp calculation
Warping distorts the input images and transforms them to a new perspective. Different regions of the image should be affected in a different manner and, in order to achieve this, we divide the image into various regions by incorporating a simple triangular mesh.
Warping based view
synthesis
3D lightfield conversion
Fig. 4.Feature matching across all input images.
1. Feature relocation
To generate a specific intermediate view, first we relocate all the sparse features extracted in the first step to the new location on the intermediate image as shown in Fig. 5. The destination locations for each feature are calculated by properly weighing the available feature locations on the input images.
2. Segregating the warping zones
The next step is to isolate the regions on input images which should be affected by a single warping function. These regions are referred to as warping zones. We construct a triangular mesh on each intermediate image using the approach in [2]. The vertices of each triangle denote a zone border, represented by a six element vector, tk = {x1k, y1k, x2k, y2k, x3k, y3k}, where (x1k, y1k), (x2k, y2k) & (x3k, y3k) are the coordinates of the vertices of a triangle tk on a specific intermediate image. Thus for every intermediate image, we have a set of warping boundaries, denoted by a vector T= {t1, t2,t3,…,tp}which contains the border information. Note that the number of zones may differ from one intermediate image to other. For a specific intermediate image, we fill the warping zones on it by considering immediate left and right images to it.
3. Defining the warp
Now we will solve a simple warp function for each warping zone for a specific intermediate view to identify the pixel locations on the sources images.
Consider an intermediate view; I1.5 between the pair of images I1&I2.For this view we have a set of warping zones in a vector T. Consider a single warping zone tk = {x1k, y1k, x2k, y2k, x3k, y3k}. Let the coordinates of all the pixels inside this warping zone are represented as (x1, y1), (x2, y2), (x3, y3)
….. (xl, yl). Now we define two matrices M1 and M2 as follows:
𝑀𝑀𝑀𝑀1 =�𝑥𝑥𝑥𝑥1𝑘𝑘𝑘𝑘 𝑥𝑥𝑥𝑥2𝑘𝑘𝑘𝑘 𝑥𝑥𝑥𝑥3𝑘𝑘𝑘𝑘 𝑦𝑦𝑦𝑦1𝑘𝑘𝑘𝑘 𝑦𝑦𝑦𝑦2𝑘𝑘𝑘𝑘 𝑦𝑦𝑦𝑦3𝑘𝑘𝑘𝑘
1 1 1 �,𝑀𝑀𝑀𝑀2 =�𝑥𝑥𝑥𝑥1 𝑥𝑥𝑥𝑥2 𝑥𝑥𝑥𝑥3
𝑦𝑦𝑦𝑦1 𝑦𝑦𝑦𝑦2 𝑦𝑦𝑦𝑦3 1 1 1…𝑥𝑥𝑥𝑥𝑙𝑙𝑙𝑙
𝑦𝑦𝑦𝑦𝑙𝑙𝑙𝑙 1� (1) As we have a set of sparse disparities already calculated, we know the coordinates of the borders of this warping zone on the source left and right images.
Fig. 5.Feature transformation to all the intermediate views.
These are represented by two separate matrices: M1_L & M1_R,respectively as below.
𝑀𝑀𝑀𝑀1_𝐿𝐿𝐿𝐿=�𝑥𝑥𝑥𝑥1𝑘𝑘𝑘𝑘_𝑙𝑙𝑙𝑙 𝑥𝑥𝑥𝑥2𝑘𝑘𝑘𝑘_𝑙𝑙𝑙𝑙 𝑥𝑥𝑥𝑥3𝑘𝑘𝑘𝑘_𝑙𝑙𝑙𝑙 𝑦𝑦𝑦𝑦1𝑘𝑘𝑘𝑘_𝑙𝑙𝑙𝑙 𝑦𝑦𝑦𝑦2𝑘𝑘𝑘𝑘_𝑙𝑙𝑙𝑙 𝑦𝑦𝑦𝑦3𝑘𝑘𝑘𝑘_𝑙𝑙𝑙𝑙
1 1 1 � (2)
𝑀𝑀𝑀𝑀1_𝑅𝑅𝑅𝑅=�𝑥𝑥𝑥𝑥1𝑘𝑘𝑘𝑘_𝑟𝑟𝑟𝑟 𝑥𝑥𝑥𝑥2𝑘𝑘𝑘𝑘_𝑟𝑟𝑟𝑟 𝑥𝑥𝑥𝑥3𝑘𝑘𝑘𝑘_𝑟𝑟𝑟𝑟 𝑦𝑦𝑦𝑦1𝑘𝑘𝑘𝑘_𝑟𝑟𝑟𝑟 𝑦𝑦𝑦𝑦2𝑘𝑘𝑘𝑘_𝑟𝑟𝑟𝑟 𝑦𝑦𝑦𝑦3𝑘𝑘𝑘𝑘_𝑟𝑟𝑟𝑟
1 1 1 � (3)
(x1k_l, y1k_l), (x2k_l, y2k_l) & (x3k_l, y3k_l) are the borders of the warping zone on the source left image (in this case I1) and similarly (x1k_r, y1k_r), (x2k_r, y2k_r) & (x3k_r, y3k_r) are the borders of the warping zone on the source right image (in this case I2). To identify the candidate pixels on the source left and right images, we solve the following equations
2 ) 1 _
1 ( _
2 L M L M
1M
M = ×
−×
(4)2 ) 1 _
1 ( _
2 R M R M
1M
M = ×
−×
(5)The matrices M2_LandM2_Rare of same dimension as M2 with the first two rows containing the xand ycoordinates of the target pixels on the left and right images respectively. C. Warping and blending
From the warp calculation stage, we have target pixel locations for each warping zone on an intermediate image. As the warp calculation process involves finding the matrix inverse, we may have the target pixel location as floating point values. The pixel values at these floating point locations are interpolated by fitting a bicubic surface to the data points on source left and right images.
The target pixels obtained from source left/right images are blended individually in to the warping zones. Let P1and P2be the target pixels on the source images Ikand Ik+1for a pixel Pinon an intermediate view at Ik+frac. Then Pincan be computed as:
(
1 frac)
P1 frac P2Pin = − × + × (5)
IV. EXPERIMENTAL RESULTS
The performance of the algorithm is evaluated by considering different test image sequences obtained using the experimental settings defined in MPEG. As an input, we considered three equally spaced views and the generated views are Along with these input images, a set of three
11 Input images
Sparse disparity estimation
Warp calculation
Warping and blending
Synthetic images
Minput views Nsynthetic views LFD
Fig. 2.Concept of multiview generation & visualization on a LFD.
automatic, providing high quality results. They work directly on the input images and do not rely on depth estimation, which reduces the amount of processing. Thus it is more convenient to investigate possibility of real time implementation of such algorithms. In this paper, we present a warping based approach to synthesize the virtual views for a LFD automatically.
The rest of this paper is organized as follows. In the next section we give an overview of the system concept. Details of the algorithm are described in section 3. Then, section 4 presents the results, and finally, section 5 concludes the paper.
II. SYSTEM CONCEPT
As already mentioned in section 1, LFDs support wide FOVs and thus, the larger the number of views, the better the quality of the displayed image. The system uses an LFD requiring N views, and these N views are generated from a smaller number M of input views (M < N). Also we assume that the input Mviews are rectified i.e., the epipolar lines of all views are horizontally aligned. Fig. 2 illustrates the concept of the system.
It is a tedious task to produce the required Nviews for an LFD using Nreal time cameras because of the physical size of the cameras. Also we assume that the input images are projected to a common image plane (rectified), which imposes constraints on alignment and synchronization of the cameras. To fill the large FOV of the LFD, along with interpolation, we also extrapolate the views to a limited extent. In contrast to the DIBR methods, extrapolation does not result in serious problems due to disocclusions and hence there is no need for any further post-processing steps.
The algorithm is described in detail in the following section.
The resulting N views are processed using a lightfield converter which encodes the views in to a suitable format as required for a LFD.
III. ALGORITHM DESCRIPTION
In order to transform one view into another, we need a non- linear transformation. Information on this non-linear transformation is stored in an image, which is normally referred to as disparity map. The disparity map carries information on how much each pixel is shifted (horizontally) from one view to another. In the present algorithm, we first estimate a sparse disparity set and then use it to generate virtual views.
Fig. 3. Processing steps for virtual view generation.
Let us represent the set of input images as {I1, I2, I3...Im}.
As shown in Fig. 3, the overall algorithm contains three steps.
A. Sparse disparity estimation
Feature extraction matching is applied to detect reliable and accurate disparities. In addition to that, the extracted features are matched across all Minput images as shown in Fig. 4, to ensure the robustness of the extracted features.
B. Warp calculation
Warping distorts the input images and transforms them to a new perspective. Different regions of the image should be affected in a different manner and, in order to achieve this, we divide the image into various regions by incorporating a simple triangular mesh.
Warping based view
synthesis
3D lightfield conversion
Fig. 4.Feature matching across all input images.
1. Feature relocation
To generate a specific intermediate view, first we relocate all the sparse features extracted in the first step to the new location on the intermediate image as shown in Fig. 5. The destination locations for each feature are calculated by properly weighing the available feature locations on the input images.
2. Segregating the warping zones
The next step is to isolate the regions on input images which should be affected by a single warping function. These regions are referred to as warping zones. We construct a triangular mesh on each intermediate image using the approach in [2]. The vertices of each triangle denote a zone border, represented by a six element vector, tk = {x1k, y1k, x2k, y2k, x3k, y3k}, where (x1k, y1k), (x2k, y2k) & (x3k, y3k) are the coordinates of the vertices of a triangle tk on a specific intermediate image. Thus for every intermediate image, we have a set of warping boundaries, denoted by a vector T= {t1, t2,t3,…,tp}which contains the border information. Note that the number of zones may differ from one intermediate image to other. For a specific intermediate image, we fill the warping zones on it by considering immediate left and right images to it.
3. Defining the warp
Now we will solve a simple warp function for each warping zone for a specific intermediate view to identify the pixel locations on the sources images.
Consider an intermediate view; I1.5 between the pair of images I1&I2.For this view we have a set of warping zones in a vector T. Consider a single warping zone tk = {x1k, y1k, x2k, y2k, x3k, y3k}. Let the coordinates of all the pixels inside this warping zone are represented as (x1, y1), (x2, y2), (x3, y3)
….. (xl, yl). Now we define two matrices M1 and M2 as follows:
𝑀𝑀𝑀𝑀1 =�𝑥𝑥𝑥𝑥1𝑘𝑘𝑘𝑘 𝑥𝑥𝑥𝑥2𝑘𝑘𝑘𝑘 𝑥𝑥𝑥𝑥3𝑘𝑘𝑘𝑘 𝑦𝑦𝑦𝑦1𝑘𝑘𝑘𝑘 𝑦𝑦𝑦𝑦2𝑘𝑘𝑘𝑘 𝑦𝑦𝑦𝑦3𝑘𝑘𝑘𝑘
1 1 1 �,𝑀𝑀𝑀𝑀2 =�𝑥𝑥𝑥𝑥1 𝑥𝑥𝑥𝑥2 𝑥𝑥𝑥𝑥3
𝑦𝑦𝑦𝑦1 𝑦𝑦𝑦𝑦2 𝑦𝑦𝑦𝑦3 1 1 1…𝑥𝑥𝑥𝑥𝑙𝑙𝑙𝑙
𝑦𝑦𝑦𝑦𝑙𝑙𝑙𝑙 1� (1) As we have a set of sparse disparities already calculated, we know the coordinates of the borders of this warping zone on the source left and right images.
Fig. 5.Feature transformation to all the intermediate views.
These are represented by two separate matrices: M1_L &
M1_R,respectively as below.
𝑀𝑀𝑀𝑀1_𝐿𝐿𝐿𝐿=�𝑥𝑥𝑥𝑥1𝑘𝑘𝑘𝑘_𝑙𝑙𝑙𝑙 𝑥𝑥𝑥𝑥2𝑘𝑘𝑘𝑘_𝑙𝑙𝑙𝑙 𝑥𝑥𝑥𝑥3𝑘𝑘𝑘𝑘_𝑙𝑙𝑙𝑙 𝑦𝑦𝑦𝑦1𝑘𝑘𝑘𝑘_𝑙𝑙𝑙𝑙 𝑦𝑦𝑦𝑦2𝑘𝑘𝑘𝑘_𝑙𝑙𝑙𝑙 𝑦𝑦𝑦𝑦3𝑘𝑘𝑘𝑘_𝑙𝑙𝑙𝑙
1 1 1 � (2)
𝑀𝑀𝑀𝑀1_𝑅𝑅𝑅𝑅=�𝑥𝑥𝑥𝑥1𝑘𝑘𝑘𝑘_𝑟𝑟𝑟𝑟 𝑥𝑥𝑥𝑥2𝑘𝑘𝑘𝑘_𝑟𝑟𝑟𝑟 𝑥𝑥𝑥𝑥3𝑘𝑘𝑘𝑘_𝑟𝑟𝑟𝑟 𝑦𝑦𝑦𝑦1𝑘𝑘𝑘𝑘_𝑟𝑟𝑟𝑟 𝑦𝑦𝑦𝑦2𝑘𝑘𝑘𝑘_𝑟𝑟𝑟𝑟 𝑦𝑦𝑦𝑦3𝑘𝑘𝑘𝑘_𝑟𝑟𝑟𝑟
1 1 1 � (3)
(x1k_l, y1k_l), (x2k_l, y2k_l) & (x3k_l, y3k_l) are the borders of the warping zone on the source left image (in this case I1) and similarly (x1k_r, y1k_r), (x2k_r, y2k_r) & (x3k_r, y3k_r) are the borders of the warping zone on the source right image (in this case I2). To identify the candidate pixels on the source left and right images, we solve the following equations
2 ) 1 _
1 ( _
2 L M L M
1M
M = ×
−×
(4)2 ) 1 _
1 ( _
2 R M R M
1M
M = ×
−×
(5)The matrices M2_LandM2_Rare of same dimension as M2 with the first two rows containing the xand ycoordinates of the target pixels on the left and right images respectively.
C. Warping and blending
From the warp calculation stage, we have target pixel locations for each warping zone on an intermediate image.
As the warp calculation process involves finding the matrix inverse, we may have the target pixel location as floating point values. The pixel values at these floating point locations are interpolated by fitting a bicubic surface to the data points on source left and right images.
The target pixels obtained from source left/right images are blended individually in to the warping zones. Let P1and P2be the target pixels on the source images Ikand Ik+1for a pixel Pinon an intermediate view at Ik+frac. Then Pincan be computed as:
(
1 frac)
P1 frac P2Pin = − × + × (5)
IV. EXPERIMENTAL RESULTS
The performance of the algorithm is evaluated by considering different test image sequences obtained using the experimental settings defined in MPEG. As an input, we considered three equally spaced views and the generated views are Along with these input images, a set of three
(a) (b) (c) (d) (e) (f)
(g) (h) (i) (j) (k)
Fig. 6.Output Views of sequence Tele Conference.
Note:Images (b), (f) & (j) are the source input images. Images (c), (d), (e), (g), (h) & (i) are a set of interpolated images and images (a) and (k) are extrapolated.
views are locally captured using a three horizontally aligned camera rig and synthesized views corresponding to these images are also presented. Because of the spacing constraint, the generated views from a locally generated images are shown in Fig. 6.
A. Limitations and future work
In many cases, the artifacts resulting from the method are in the form of ghosting or blurring in the synthetic views as illustrated in Fig. 7. These are due to the lack of a sufficient number of correspondence points in these areas. Another reason for these artifacts is the inaccuracy when matching the sparse disparities. These limitations can be handled in a better way, by obtaining a different set of sparse disparities from a different algorithm (e.g. optical flow) and populating the existing disparities with the new disparities. However compared to DIBR, the algorithm is robust and allows us to generate images corresponding to very large FOV with limited artifacts without requiring any post processing.
V. CONCLUSIONS
We presented a reliable, fast and automatic method to create content for LFD. We followed a warping driven approach which relies on the sparse disparities and constructs a mesh. A set of appropriate warping functions are formulated and solved for each region inside the mesh The method can generate good quality intermediate views and also support extrapolation. With simple warping functions, the method greatly reduces the complexity in the multiview content creation process. As the warping based approaches are continuous, the method will not introduce any holes in the synthesized views thus further reducing the complexity associated with the post processing steps and thus the algorithm can be a potential alternative to DIBR.
VI. ACKNOWLEDGEMENTS
The research leading to these results has received funding from the DIVA Marie Curie Action of the People programme of the European Union’s Seventh Framework
Programme FP7/2007- 2013/ under REA grant agreement 290227.
Fig. 7.Blurring artifacts.
VII. REFERENCES
[1] M. Farre, O. Wang, M. Lang, N. Stefanoski, A. Hornung, and A. Smolic. Automatic content creation for multiview autostereoscopic displays using image domain warping. In Proc. ICME, 2011, pp.1-6.
[2] L.P Chew. Constrained Delaunay triangulations. In Proceedings of the Third Annual Symposium on Computational Geometry, 1987, pp. 215-222.
[3] A. Smolic, K. Muller, K. Dix, P. Merkle, P. Kauff, and T.
Wiegand. Intermediate view interpolation based on multiview video plus depth for advanced 3d video systems.
In Proc. ICIP 2008, IEEE International Conference on Image Processing, pp. 2448–2451. IEEE, 2008.
[4] Wang, Daolei and Lim, Kah Bin. Obtaining depth map from segment-based stereo matching using graph cuts. J. Vis.
Comun. Image Represent,1047-3203, 2011, Vol. 22, pp.325- 331.
[5] T. Balogh, P. T. Kovacs and Z. Megyesi. HoloVizio 3D display system. In Proceedings of the First International Conference on Immersive Telecommunications, ser.
ImmersCom ’07. ICST, Brussels, Belgium, 2007, pp. 19:1–
19:5.
Examination of bacterial mutants in open and closed models
D´ora Bihary
(Supervisor: Dr. S´andor Pongor) bihary.dora@itk.ppke.hu
Abstract—Bacteria use a mechanism called quorum sensing for inter- and intraspecies communication. This is a concentration based phenomena: bacteria emit chemical compounds and they respond to its above threshold concentration. In this paper I summarize results obtained with open and closed bacterial models. In these two cases we examined quorum sensing cheaters.
These cheaters are mutant forms of the original wild type species that do not release as much chemical compounds - they do not take as big part in communication and cooperation - as wild type species do. This way they are not able to perform a swarming population on their own but in a population where wild type species can be found as well they can take part in the swarming of the other species and overgrow them because of their lower energy consumption.
Keywords-quorum sensing; wild type; signal negative; signal blind; closed model; open model
I. INTRODUCTION
Bacterial (or other similar) models can be classified in many ways [1]. We can classify models according to how they represent bacteria, space, medium or bacterial behavior.
In the next paragraphs I will give a short overview of these classification methods.
In the simplest case bacteria can be represented as a continuous mass that grows and diffuses in space [2]. These models are described with reaction-diffusion equations. In these models the individual representation of bacteria disap- pears. This is the reason why we usually represent bacteria as agents - as interacting entities. These interactions can be potential-based or rule-based. Potentials, like Lennard-Jones potential are frequently used in such models [3], they make a potential field for each bacteria. The movement in the next step is based on the distance from the surrounding agents. It is violated to go too close to each other and we can define an optimal distance between agents where they prefer to be.
Rule-based models give rules that a certain agent can follow during movement (e.g. try to avoid crowded places, try to suit your direction to your mate’s direction; try to suit your speed to your mate’s speed, try to move toward your mates etc. [4]).
These rules are usually sequentially evaluated beginning with the most important ones - like ”do not collide with others”.
The space that surrounds bacteria sometimes has no impor- tance and so it is not represented in some models. In more complex cases we describe the space by coordinates. This can happen in 1, 2 or 3 dimensions depending on the actual model.
In both cases we can talk about open [4] or closed [5] systems.
A closed model has fix or periodic boundary conditions at its
margins. In our work we compared closed and open models so these will be discussed in detail later.
Medium in our case means the rest of the model that is not the object of our work (e.g. all but bacteria). This medium sometimes may not be represented (vacuum), we can describe it at the level of physical forces or chemical particles [6]. In bacterial models the most commonly used representation is to describe medium as continuous mass where the participating materials can diffuse in space and time.
A bacterial colony consists of bacteria that try to achieve a common goal via a more or less common behavioral pattern. This way we can talk about the coordination of agents. This coordination can happen on several levels, we can for example coordinate the speed or direction of the movement. We can widen this concept to the inner states of agents or even to the whole genome [7].
II. BIOLOGICAL BACKGROUND
The communication mechanism of bacteria is called quorum sensing, it is based on the emission of chemical compounds [8] [9]. Bacteria secret a basal amount of signal that, in an open environment, continuously diffuses away. If there is a sufficient number of bacteria present in a small environment, the concentration of the emitted signal can raise and eventually reach a threshold concentration. The bacteria sense this thresh- old concentration and change their metabolism: they increase the production of signals, and start the production of factors. When in turn the concentration of factors reaches a threshold in the environment, the bacteria increase their movement, food intake and their division rate. They enter an active state - they start swarming.
Signal molecules are usually called as communication ma- terials since their function is to sign for each other that they are present on the surface. On the other hand factor molecules are usually called as cooperation materials, or public goods. This is because these factors are chemical compounds that are not needed in a basal state, the production of them is energy consuming, but they are sufficient for swarming - e.g. siderophores, surfactants.
Our model organism was Pseudomonas aeruginosa an opportunistic pathogen that can potentially cause death in patients of cystic fibrosis.
In the simulations we examined three kinds of bacteria: wild type (WT), signal negative (SN) and signal blind (SB) [10]. The form of a bacteria that can perform all the above
13 (a) (b) (c) (d) (e) (f)
(g) (h) (i) (j) (k)
Fig. 6.Output Views of sequence Tele Conference.
Note:Images (b), (f) & (j) are the source input images. Images (c), (d), (e), (g), (h) & (i) are a set of interpolated images and images (a) and (k) are extrapolated.
views are locally captured using a three horizontally aligned camera rig and synthesized views corresponding to these images are also presented. Because of the spacing constraint, the generated views from a locally generated images are shown in Fig. 6.
A. Limitations and future work
In many cases, the artifacts resulting from the method are in the form of ghosting or blurring in the synthetic views as illustrated in Fig. 7. These are due to the lack of a sufficient number of correspondence points in these areas. Another reason for these artifacts is the inaccuracy when matching the sparse disparities. These limitations can be handled in a better way, by obtaining a different set of sparse disparities from a different algorithm (e.g. optical flow) and populating the existing disparities with the new disparities. However compared to DIBR, the algorithm is robust and allows us to generate images corresponding to very large FOV with limited artifacts without requiring any post processing.
V. CONCLUSIONS
We presented a reliable, fast and automatic method to create content for LFD. We followed a warping driven approach which relies on the sparse disparities and constructs a mesh. A set of appropriate warping functions are formulated and solved for each region inside the mesh The method can generate good quality intermediate views and also support extrapolation. With simple warping functions, the method greatly reduces the complexity in the multiview content creation process. As the warping based approaches are continuous, the method will not introduce any holes in the synthesized views thus further reducing the complexity associated with the post processing steps and thus the algorithm can be a potential alternative to DIBR.
VI. ACKNOWLEDGEMENTS
The research leading to these results has received funding from the DIVA Marie Curie Action of the People programme of the European Union’s Seventh Framework
Programme FP7/2007- 2013/ under REA grant agreement 290227.
Fig. 7.Blurring artifacts.
VII. REFERENCES
[1] M. Farre, O. Wang, M. Lang, N. Stefanoski, A. Hornung, and A. Smolic. Automatic content creation for multiview autostereoscopic displays using image domain warping. In Proc. ICME, 2011, pp.1-6.
[2] L.P Chew. Constrained Delaunay triangulations. In Proceedings of the Third Annual Symposium on Computational Geometry, 1987, pp. 215-222.
[3] A. Smolic, K. Muller, K. Dix, P. Merkle, P. Kauff, and T.
Wiegand. Intermediate view interpolation based on multiview video plus depth for advanced 3d video systems.
In Proc. ICIP 2008, IEEE International Conference on Image Processing, pp. 2448–2451. IEEE, 2008.
[4] Wang, Daolei and Lim, Kah Bin. Obtaining depth map from segment-based stereo matching using graph cuts. J. Vis.
Comun. Image Represent,1047-3203, 2011, Vol. 22, pp.325- 331.
[5] T. Balogh, P. T. Kovacs and Z. Megyesi. HoloVizio 3D display system. In Proceedings of the First International Conference on Immersive Telecommunications, ser.
ImmersCom ’07. ICST, Brussels, Belgium, 2007, pp. 19:1–
19:5.
Examination of bacterial mutants in open and closed models
D´ora Bihary
(Supervisor: Dr. S´andor Pongor) bihary.dora@itk.ppke.hu
Abstract—Bacteria use a mechanism called quorum sensing for inter- and intraspecies communication. This is a concentration based phenomena: bacteria emit chemical compounds and they respond to its above threshold concentration. In this paper I summarize results obtained with open and closed bacterial models. In these two cases we examined quorum sensing cheaters.
These cheaters are mutant forms of the original wild type species that do not release as much chemical compounds - they do not take as big part in communication and cooperation - as wild type species do. This way they are not able to perform a swarming population on their own but in a population where wild type species can be found as well they can take part in the swarming of the other species and overgrow them because of their lower energy consumption.
Keywords-quorum sensing; wild type; signal negative; signal blind; closed model; open model
I. INTRODUCTION
Bacterial (or other similar) models can be classified in many ways [1]. We can classify models according to how they represent bacteria, space, medium or bacterial behavior.
In the next paragraphs I will give a short overview of these classification methods.
In the simplest case bacteria can be represented as a continuous mass that grows and diffuses in space [2]. These models are described with reaction-diffusion equations. In these models the individual representation of bacteria disap- pears. This is the reason why we usually represent bacteria as agents - as interacting entities. These interactions can be potential-based or rule-based. Potentials, like Lennard-Jones potential are frequently used in such models [3], they make a potential field for each bacteria. The movement in the next step is based on the distance from the surrounding agents. It is violated to go too close to each other and we can define an optimal distance between agents where they prefer to be.
Rule-based models give rules that a certain agent can follow during movement (e.g. try to avoid crowded places, try to suit your direction to your mate’s direction; try to suit your speed to your mate’s speed, try to move toward your mates etc. [4]).
These rules are usually sequentially evaluated beginning with the most important ones - like ”do not collide with others”.
The space that surrounds bacteria sometimes has no impor- tance and so it is not represented in some models. In more complex cases we describe the space by coordinates. This can happen in 1, 2 or 3 dimensions depending on the actual model.
In both cases we can talk about open [4] or closed [5] systems.
A closed model has fix or periodic boundary conditions at its
margins. In our work we compared closed and open models so these will be discussed in detail later.
Medium in our case means the rest of the model that is not the object of our work (e.g. all but bacteria). This medium sometimes may not be represented (vacuum), we can describe it at the level of physical forces or chemical particles [6]. In bacterial models the most commonly used representation is to describe medium as continuous mass where the participating materials can diffuse in space and time.
A bacterial colony consists of bacteria that try to achieve a common goal via a more or less common behavioral pattern.
This way we can talk about the coordination of agents. This coordination can happen on several levels, we can for example coordinate the speed or direction of the movement. We can widen this concept to the inner states of agents or even to the whole genome [7].
II. BIOLOGICAL BACKGROUND
The communication mechanism of bacteria is called quorum sensing, it is based on the emission of chemical compounds [8] [9]. Bacteria secret a basal amount of signal that, in an open environment, continuously diffuses away. If there is a sufficient number of bacteria present in a small environment, the concentration of the emitted signal can raise and eventually reach a threshold concentration. The bacteria sense this thresh- old concentration and change their metabolism: they increase the production of signals, and start the production of factors.
When in turn the concentration of factors reaches a threshold in the environment, the bacteria increase their movement, food intake and their division rate. They enter an active state - they start swarming.
Signal molecules are usually called as communication ma- terials since their function is to sign for each other that they are present on the surface. On the other hand factor molecules are usually called as cooperation materials, or public goods.
This is because these factors are chemical compounds that are not needed in a basal state, the production of them is energy consuming, but they are sufficient for swarming - e.g.
siderophores, surfactants.
Our model organism was Pseudomonas aeruginosa an opportunistic pathogen that can potentially cause death in patients of cystic fibrosis.
In the simulations we examined three kinds of bacteria:
wild type (WT), signal negative (SN) and signal blind (SB) [10]. The form of a bacteria that can perform all the above D. Bihary, “Examination of bacterial mutants in open and closed models,”
in Proceedings of the Interdisciplinary Doctoral School in the 2012-2013 Academic Year, T. Roska, G. Prószéky, P. Szolgay, Eds.
Faculty of Information Technology, Pázmány Péter Catholic University.
Budapest, Hungary: Pázmány University ePress, 2013, vol. 8, pp. 13-16.


![Fig. 1. Emergence of cardiopulmonary parasitoses in Europe. Yearly average predicted number of Dirofilaria generations obtained by Linear Kriging interpolation [1]](https://thumb-eu.123doks.com/thumbv2/9dokorg/1173073.85786/47.892.461.833.314.588/emergence-cardiopulmonary-parasitoses-predicted-dirofilaria-generations-obtained-interpolation.webp)