Reindustrialization patterns in the post-socialist EU members: a comparative study between 2000 and 2017
Benedek Nagy*, Imre Lengyel**, Beáta Udvari**
Abstract
Reindustrialization is gaining focus in developed countries and manufacturing is again becoming a priority in the economic policy documents of the European Union (EU). We investigate whether there is reindustrialization happening in the EU, and if so, whether the evolution of manufacturing is similar among the different member states. For this analysis, we selected two country groups, ten post-socialist member states (PS10) and the core fifteen members (EU15). We use a decomposition method to separate the effects of changing labor productivity in manufacturing, changing share of manufacturing in gross value added and changing aggregate labor productivity on the change in manufacturing’s share in employment between 2000 and 2017. We find deindustrialization in the EU15 group: a decrease in manufacturing employment share as well as manufacturing employment itself along with a stagnant share in total gross value added. Meanwhile the Post-socialist country group shows signs of reindustrialization:
the share of manufacturing employment slightly increased along with an increasing employment, and a dynamically increasing gross value added share. We also find that after the global financial crisis the evolution of the manufacturing sector in the Post-socialist group is more similar to that in the EU15 group than it was before the crisis.
JEL classification: L6, O11, O14
Keywords: Reindustrialization, Deindustrialization, Post-socialist, Labor intensity
1. Introduction
Today reindustrialization, and the associated ‘fourth industrial revolution’, plays a crucial role in economic policies. Reindustrialization itself emerged in the economic literature about three decades ago and following the global economic crisis in 2008 it has again gained attention (Krugman, 1988; Szirmai, 2012; Tregenna, 2013;
Cristopherson et al., 2014). Reindustrialization, which we are defining as an increase in the share of manufacturing employment, can both be a spontaneous economic process and a result of an economic policy effort, and it is closely related to the concepts of industrialization and deindustrialization. Manufacturing is a key sector that scholars use to analyze these processes (Szirmai, 2012; Tregenna, 2013). Industrialization primarily
* Corresponding author, University of Szeged Faculty of Economics and Business Administration, Szeged, Hungary, nagy.benedek@eco.u-szeged.hu
** University of Szeged Faculty of Economics and Business Administration, Szeged, Hungary This research was supported by the project nr. EFOP-3.6.2-16-2017-00007, titled Aspects on the development of intelligent, sustainable and inclusive society: social, technological, innovation networks in employment and digital economy. The project has been supported by the European Union, co-financed by the European Social Fund and the budget of Hungary.
refers to a structural change that is apparent in the declining importance of the agricultural sector, an increase in the number of persons employed in industry, and an increase in the share of industry within gross value added (Scott and Storper, 1992;
Krugman, 1988; Szirmai, 2012; Tregenna, 2013). By the second half of the 20th century, with the focus on services in developed countries, the significance of industry and industrial policy saw a substantial decline as well as industry’s social and political prestige. This process is called deindustrialization (Cairncross, 1982; Kudina and Pitelis, 2014; Pelkmans, 2006; Tregenna, 2009; Wolman et al., 2015). The literature identifies two types of deindustrialization. Mature deindustrialization is characteristic of high-income countries, where manufacturing loses importance with the emergence of the service sector, an increase in the efficiency of industrial activities, and outsourcing lower value- added activities to developing countries (Saeger, 1997, Rowthorn and Ramaswamy, 1997; Alderson, 1999; Rowthorn and Coutts, 2004; Palma, 2005, 2008; Cristopherson et al,. 2014). In developing countries premature deindustrialization (e.g. with the emergence of IT services) is a kind of early collapse of industry (McMillan et al., 2017; Palma, 2005, 2008; Rodrik, 2016; Tregenna, 2016). This deindustrialization is premature because it happens soon after industrialization has started, while the share of industry in the economy is still much lower than in the exemplar countries of industrial revolution (e.g.
United Kingdom or Germany). The literature mainly uses the share of manufacturing employment to assess deindustrialization (Tregenna, 2009; 2016) but often both employment share and GVA share is considered (Tregenna, 2013; Rodrik, 2016).
In order to boost and revitalize the European Union’s economy and competitiveness after the crisis of 2008, EU economic policy began to focus on reindustrialization, particularly in post-socialist member states (Lux, 2015; Nagy and Lengyel, 2016; Lengyel et al., 2017; Rachwall, 2015). The EU announced the Europe 2020 Strategy in 2010, aiming at achieving smart, sustainable and inclusive economic growth. To this end, the European Commission – among others – made a proposal on the overall restructuring of the European industrial policy (EC, 2010; EC, 2014a;
Landesman, 2015; Török et al., 2015). Although industrial policy is one of the flagships of the Europe 2020 Strategy (An industrial policy for the globalization era), specific objectives to be attained were not yet formulated at that time. The European Commission’s Communication two years later set a clear goal: the share of industry within GDP
should increase from the approximately 15 per cent it was then to at least 20 per cent by 2020 (EC, 2012), and simultaneously it should play a major role in economic growth and job creation (EC, 2014b). That is, (re)industrialization has become a crucial element in European economies.
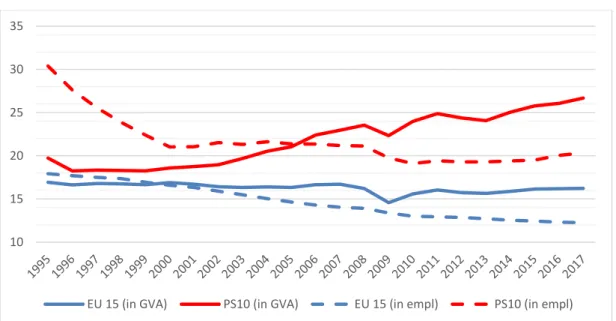
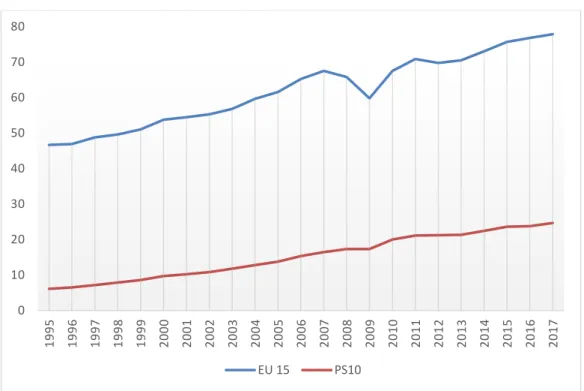
Analyzing the manufacturing1 trends in ten post-socialist EU members (PS10) and in the old EU states (EU15),2 reveals some conflicting trends (Figure 1). In 2017 manufacturing in the PS10 group has a considerably higher share in produced GVA (26.7%, with a standard deviation of 6.8) than in the EU15 group (16.2% with a standard deviation of 6.0).3 Manufacturing’s share within employment is also higher in the PS10 group (20.3%, standard deviation is 3.5) than in the EU15 group (12.3%, standard deviation is 3.0).4 In addition, the significance of manufacturing exhibits considerable variety between the member states in each group. In a ranking of the share of manufacturing employment in 2017 for all the countries involved in our study, eight of the first ten positions are held by post-socialist countries (with the Czech Republic in first place with 26.7%), while only two of the old member states of the EU rank in the top ten (Germany occupying the ninth place with 17.2%). Among the post-socialist countries the lowest value is in Latvia (13.4%) and even this is higher than the average of the EU15, which is 12.3%. However, the development of manufacturing is not homogeneous even in the case of post-socialist countries (Stojcic and Aralica, 2017), despite the fact that these countries were in an artificially “over-industrialized” condition before the regime change of 1990 (Barta et al., 2008; Chapman, 2013; Lux, 2017). Figure 1 illustrates a fast and substantial decline in the share of manufacturing in the PS10 countries in the late 90s, mostly in terms of employment. This period is still the transition period for the PS10 countries from socialism to capitalism (see e.g. Farkas, 2016), the time of adjustment to the new economic environment that is characterized by
1 Manufacturing is defined as Section C according to the Eurostat NACE Rev. 2 classification.
2 The 10 post-socialist countries making up the PS10 group are the Czech Republic, Estonia, Poland, Latvia, Lithuania, Hungary, Slovakia, Slovenia, Bulgaria and Romania. The EU15 country group contains Austria, Belgium, Denmark, Finland, France, Germany, Greece, Ireland, Italy, Luxembourg, Netherlands, Portugal, Spain, Sweden and the United Kingdom.
3 GVA data are from the nama_10_a10 database of Eurostat at
http://appsso.eurostat.ec.europa.eu/nui/show.do?dataset=nama_10_a10&lang=en
4 Employment data are from the nama_10_a10_e database of Eurostat at
http://appsso.eurostat.ec.europa.eu/nui/show.do?dataset=nama_10_a10_e&lang=en
opening up to free trade, privatization, high overall unemployment and high inflation.
We consider these processes to be different from organic deindustrialization.
Figure 1. Employment and GVA shares of manufacturing (%) for the PS10 and EU15 country groups between 1995 and 2017
Source: own calculations based on data from Eurostat
In the EU15, the share of manufacturing within employment decreased since 2000 and its share within GVA stagnated or slightly decreased, with the global financial crisis accelerating the process a little in terms of GVA. These changes fit the more strict requirements of deindustrialization when both shares are required to decrease. In the PS10 states, however, the share of manufacturing in GVA is almost continuously increasing, while the share of manufacturing employment seems to be decreasing. This trend does not meet the above-mentioned strict definition of deindustrialization. In light of the inconclusive trends we investigate in this paper whether deindustrialization or reindustrialization takes place in the PS10 and the EU15 countries and compare the evolution of the manufacturing sector of these country groups. De- and reindustrialization is generally assessed with reference to the change in the share of manufacturing employment and gross value added, and also to the change in their absolute levels. As any combination of direction of changes in these variables is possible for our study we define reindustrialization as an increase in the share of manufacturing employment and deindustrialization as a decrease therein (Tregenna, 2016). In order to analyze and compare the performance and evolution of the manufacturing
10 15 20 25 30 35
EU 15 (in GVA) PS10 (in GVA) EU 15 (in empl) PS10 (in empl)
sector of the two country groups mentioned above we use the number of persons employed and gross value added as basic variables. Applying a decomposition method, we analyze the change in labor intensity (essentially, labor productivity) and growth of manufacturing GVA.
In the first part of the study we present the methodology we apply to examine reindustrialization, followed by the analysis of the characteristics of manufacturing based on this method between 2000 and 2017 in the EU15 and PS10 countries, in three separate time periods. In the last section of our study we discuss the results regarding reindustrialization and the questions left open.
2. Methodological background
In this section, we examine the direction of processes taking place in the manufacturing sector of the EU15 and PS10 countries. We examine ten post-socialist countries (PS10), out of which eight (the Czech Republic, Estonia, Poland, Latvia, Lithuania, Hungary, Slovakia and Slovenia) joined the EU in 2004, and the other two (Bulgaria and Romania) did so in 2007. From the PS10 group we are excluding Croatia, first because its EU accession happened much later (2013) and second because as a consequence of this the Eurostat data about Croatia is very scant.
The performance of the manufacturing sector is generally assessed by various decomposition methods in the field of industrial economics. These methods concentrate on one of the followings as output variable: (1) number of persons employed in the industry; (2) gross value added of manufacturing; (3) labor productivity, and they use more or less detailed sectoral breakdown of the economies analyzed. For example, Tregenna (2009, 2013) uses the decomposition to separate the effects of factors causing a change in employment, Cantore et al. (2017) concentrate on gross value added, and McMillan and Rodrik (2011) are decomposing the change in the labor productivity. All of these methods look at the same phenomenon from different angles. There exist also other methods like the shift-share analysis or indices such as the Lilien index, the Havlik index, or UNIDO’s index of structural change but they are generally used to study multiple sectors in either a single country or for a variety of countries. Since we are concentrating on one single economic activity (manufacturing) in different countries, the use of decomposition to answer our research question is more appropriate.
In our analysis we follow the three-way decomposition method used by Tregenna (2009, 2013) which separates the effects of change in manufacturing labor intensity, share of manufacturing in GVA and overall labor productivity on the change in the share of manufacturing employment. The employment share of manufacturing can increase through a decreasing labor intensity in manufacturing as well as a higher share of GVA being produced in manufacturing or aggregate labor productivity increasing.
None of these factors alone are necessary or sufficient conditions for the share of manufacturing employment to grow, but their relative importance tells a more nuanced story about how and why the employment share of manufacturing changes. The decomposition also shows that the share of manufacturing employment can be rising coupled with an increase in the share of manufacturing within GVA or in spite of a decrease in it. A certain (percentage point) increase in the share of persons employed in manufacturing needs to be assessed in a different way in a country where the share of manufacturing (real) GVA also increases as opposed to where it decreases.5
A change in the share of persons employed in manufacturing in a country can be attributed to three factors (Tregenna, 2009, 2013). The labor intensity6effect shows how changing labor productivity should have affected the share of persons employed in manufacturing, assuming both a constant overall or aggregate labor productivity and share of manufacturing in GVA. The improvement of labor productivity means that production becomes less labor intensive, thus resulting in a negative labor intensity effect that in itself causes a decrease in the share of persons employed. The decline of labor productivity means that a higher share of employers would have to work in manufacturing to produce the same GVA, thus the labor intensity effect is positive. The second factor is the sector share effect which shows by what percentage point the share of persons employed in manufacturing should have changed as a result of changing share of manufacturing within total GVA assuming constant labor productivity both in manufacturing and at the economy level. A higher share of manufacturing within GVA means the sector share effect is positive, and that in itself warrants an increase in the share of persons employed. Similarly, a decrease in the share of manufacturing GVA
5 The other decomposition methods mentioned above also suffer from the same drawbacks.
6 Labor intensity is defined as the reciprocal of labor productivity, i.e. if labor productivity declines, production becomes more labor intensive and labor intensity increases.
means that, assuming constant labor productivity, a lower share of employees employed in manufacturing would be sufficient. The third component is the aggregate labor productivity effect. This component measures the contribution of the economy wide productivity change on the share of employment in manufacturing. When the overall economy becomes more productive ceteris paribus, the aggregate labor productivity effect is positive, thus manufacturing having constant labor productivity and producing a constant share of GVA has to increase its share in employment.
The three types of effect described above have complementary roles in determining the change in the share of persons employed used as a key variable and can be quantified as follows. Let the number of persons employed in manufacturing be 𝐿𝐶 and in the whole economy 𝐿. The gross value added (in real terms) produced by manufacturing is denoted by 𝑄𝐶 and for the whole economy it is 𝑄. Based on these indicators, labor intensity in manufacturing can be defined as: 𝜙 =𝑄𝐿𝐶𝐶, share of the manufacturing sector in GVA as 𝛿 =𝑄𝑄𝐶 and aggregate labor productivity as 𝜃 =𝑄𝐿. With the help of these indicators we can define the share of manufacturing employment can be as 𝜎 =𝐿𝐿𝐶= 𝜙 ∙ 𝛿 ∙ 𝜃.
Adding a time variable we can look at the change in the share of manufacturing within employment between years t and t + h as follows:
∆𝜎 = (𝜙𝑡+ℎ∙ 𝛿𝑡+ℎ∙ 𝜃𝑡+ℎ) − (𝜙𝑡∙ 𝛿𝑡∙ 𝜃𝑡) (1)
This can be broken down into the three components of labor intensity effect:
1
6(𝜙𝑡+ℎ− 𝜙𝑡)[(𝛿𝑡𝜃𝑡+ 𝛿𝑡+ℎ𝜃𝑡+ℎ) + (𝜃𝑡+ 𝜃𝑡+ℎ)(𝛿𝑡+ 𝛿𝑡+ℎ)] (2) sector share effect:
1
6(𝛿𝑡+ℎ− 𝛿𝑡)[(𝜙𝑡𝜃𝑡+ 𝜙𝑡+ℎ𝜃𝑡+ℎ) + (𝜃𝑡+ 𝜃𝑡+ℎ)(𝜙𝑡+ 𝜙𝑡+ℎ)] (3)
and aggregate labor productivity effect:
1
6(𝜃𝑡+ℎ − 𝜃𝑡)[(𝜙𝑡𝛿𝑡+ 𝜙𝑡+ℎ𝛿𝑡+ℎ) + (𝛿𝑡+ 𝛿𝑡+ℎ)(𝜙𝑡+ 𝜙𝑡+ℎ)] (4) One can verify that adding the three components, expanding and simplifying yields (1).7
Our main indicator for reindustrialization is the share of manufacturing employment, so the best case is when this indicator increases in such a way that the labor intensity effect is negative, and the other two effects are both positive, their sum being larger than the negative labor intensity effect. Such an increase in the share of manufacturing employment is clearly more favorable than one where the labor intensity effect is positive and the other two effects are both negative, their sum being smaller than the positive labor intensity effect.
To calculate these three components we use GVA and employment data. The GVA data we use are in real terms of 2005 provided by Eurostat (indicator “chain linked volumes (2005)”) from the nama_10_a10 database. Our employment indicator is the “total number of persons employed” indicator of Eurostat, which includes employees and self-employed persons. This data is obtained from the nama_10_a10_e database. As a starting year we use 2000. Consistent and reliable GVA and employment data are both available for all the countries we study from this year on. For some countries and some years only one of the indicators was available. The missing data were imputed using a linear extrapolation of labor productivity, as labor productivity is less sensitive to business cycles than output or employment. All data were downloaded from Eurostat on 15 December 2018.
3. Empirical results of decomposition
The time frame which we study is thus 2000–2017. If we consider this whole period, there is no reindustrialization taking place either in the PS10 or in the EU15 as the share of manufacturing employment decreased in both country groups (Table 1).
The PS10 follow the trend of the EU15, but at the same time, the decrease in
7 The detailed derivation of the components can be found in Tregenna (2009).
employment share is much lower, almost negligible in the PS10 country group. Within the PS10 group only Poland and Romania exhibit an increase in the share of manufacturing. These increases, however, mean an additional 464 thousand people employed in manufacturing in Poland, but a loss of 359 thousand manufacturing jobs in Romania. In the EU15 group no single country experienced an increase in the share of manufacturing employment.
Table 1. Effects underlying the change in the share of manufacturing employment for the whole time period
2000-2017
Total effect
Δσ% Labor intensity
effect Sector share
effect
Aggregate labor productivity effect
Bulgaria –2.7 –16.9 3.6 10.6
Czech Republic –0.7 –24.9 13.0 11.2
Estonia –2.8 –17.1 3.1 11.1
Latvia –2.6 –9.3 -3.7 10.3
Lithuania –1.9 –20.0 5.0 13.1
Hungary –4.8 –13.6 2.3 6.5
Poland 0.7 –22.5 11.8 11.4
Romania 0.4 –20.8 1.9 19.3
Slovakia –2.2 –37.9 21.0 14.7
Slovenia –6.6 –16.6 2.2 7.8
PS 10 –0.7 –21.3 8.3 12.3
EU 15 –4.3 –5.3 –0.6 1.6
Source: own calculations. Note: Labor intensity effect is % change in employment assuming constant share of manufacturing in GVA and constant aggregate labor productivity. Sector share effect is % change in employment assuming unchanged labor intensity in manufacturing and unchanged aggregate labor productivity. Aggregate labor productivity effect is % change in employment assuming constant labor intensity in manufacturing and constant share of manufacturing in GVA..
Examining the factors of the change in manufacturing’s share in employment we find that the labor intensity effect is negative, and the aggregate labor productivity effect is positive for both country groups as well as for every country in the PS10 group.
These indicate that both the overall economies and the manufacturing sectors became more productive, but a larger productivity gain in manufacturing in both country groups acts in the direction of falling share of manufacturing employment. An important difference is different sign of the sector share effect as the share of manufacturing within GVA produced decreased in the EU15, while it increased in the PS10. It is worth mentioning that if we include the years leading up to the millennium for the whole 1995–2017 period we get a slightly larger decrease in the share of manufacturing employment for the EU15 (a 5.7 percentage point decrease) and a much more drastic 10
percentage point decrease for the PS10. This latter breaks down to a much larger labor intensity effect than seen in table 1 as well as a much larger aggregate labor productivity effect. We attribute this fast decrease in employment and the quick increase in labor productivity in the PS10 countries in the late 90s to the disintegration of the outdated socialist manufacturing sector as it was, and its subsequent modernization through privatization and foreign investment.
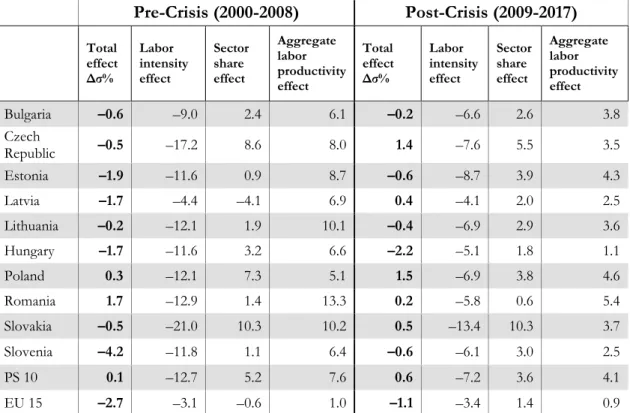
We believe that the global financial crisis and the ensuing Great Recession is a short-run phenomenon from the point of view of the longer run processes of reindustrialization. Accordingly, to exclude its disturbing effects we divide the time frame into two sub-periods: (1) the pre-crisis years (2000–2008) and (2) the period after the crisis to the present days (2009–2017).8 If we perform the decomposition for the two sub-periods separately, we get a much more mixed picture (Table 2).
Table 2. Effects underlying the change in the share of manufacturing employment for the two sub-periods
Pre-Crisis (2000-2008) Post-Crisis (2009-2017) Total effect
Δσ%
Labor intensity effect
Sector share effect
Aggregate labor productivity effect
Total effect Δσ%
Labor intensity effect
Sector share effect
Aggregate labor productivity effect
Bulgaria –0.6 –9.0 2.4 6.1 –0.2 –6.6 2.6 3.8
Czech
Republic –0.5 –17.2 8.6 8.0 1.4 –7.6 5.5 3.5
Estonia –1.9 –11.6 0.9 8.7 –0.6 –8.7 3.9 4.3
Latvia –1.7 –4.4 –4.1 6.9 0.4 –4.1 2.0 2.5
Lithuania –0.2 –12.1 1.9 10.1 –0.4 –6.9 2.9 3.6
Hungary –1.7 –11.6 3.2 6.6 –2.2 –5.1 1.8 1.1
Poland 0.3 –12.1 7.3 5.1 1.5 –6.9 3.8 4.6
Romania 1.7 –12.9 1.4 13.3 0.2 –5.8 0.6 5.4
Slovakia –0.5 –21.0 10.3 10.2 0.5 –13.4 10.3 3.7
Slovenia –4.2 –11.8 1.1 6.4 –0.6 –6.1 3.0 2.5
PS 10 0.1 –12.7 5.2 7.6 0.6 –7.2 3.6 4.1
EU 15 –2.7 –3.1 –0.6 1.0 –1.1 –3.4 1.4 0.9
Source: own calculations. Note: Labor intensity effect is % change in employment assuming constant share of manufacturing in GVA and constant aggregate labor productivity. Sector share effect is % change in employment assuming unchanged labor intensity in manufacturing and unchanged aggregate labor productivity. Aggregate labor productivity effect is % change in employment assuming constant labor intensity in manufacturing and constant share of manufacturing in GVA..
8 A further advantage of this arrangement is that the two time periods are equal in length.
Manufacturing employment seems to be hit by the crisis more severely in the Post-socialist country group, the small pre- and post-crisis increases are eliminated during the crisis year, whereas in the EU the crisis only slightly accelerated the already- present downward trend in employment share. The 0.1 percentage point increase in manufacturing employment share in the PS10 countries between 2000 and 2008 means an additional 283 thousand jobs, and the 0.6 percentage point increase in the post-crisis period means 410 thousand manufacturing jobs created. In the EU15 the 2.7 percentage point decline in manufacturing employment share before the crisis means the disappearing of almost 2.5 million jobs and the post-crisis decrease of 1.1 percentage point in employment share means a further little over 1 million jobs disappearing. In all the PS10 countries and both sub-periods we find negative labor intensity effect and positive aggregate labor productivity effect – just like between 2000 and 2017. In the pre-crisis period out of the PS10 only Romania and Poland could increase their manufacturing employment share, but if we look at employment levels we find that six out of the ten post-socialist countries increased their manufacturing employment, even with improving labor productivity. This pre-crisis growth of manufacturing employment in the PS10 countries is also documented e.g. by Elekes and Halmai (2013). The Post- socialist countries behaved more alike in terms of the three effects than the EU15 countries: with the sole exception of Latvia, where the sector share effect is negative for the total time period and the first sub-period, all countries had negative labor intensity effect, positive sector share effect and positive aggregate labor productivity effect.
Within the EU15 although the labor intensity effect is also universally negative we can find member states with signs for the sector share and aggregate labor productivity effect in any combination.
During the crisis year we exclude (from 2008 to 2009) there is a 1.3 percentage point decrease in manufacturing employment in the PS10 (a loss of 760 thousand jobs) and a 0.5 percentage point decrease (a loss of about 1.4 million jobs) in the EU15. The post-crisis evolutions start from this lower basis. In the years following the crisis, between 2009 and 2017, both county groups perform better than before the crisis. In the post crisis periods both country groups experience negative labor intensity effect in manufacturing, coupled with positive sector share effect and positive aggregate labor productivity effect. For the PS10 countries all effects are smaller in the later period than
in the earlier. In the second sub-period beside Poland and Romania also the Czech Republic, Slovakia and Latvia sees an increase in their share of manufacturing employment, while from among the EU15 countries only Portugal does.
The decomposition tells us about the way a country’s manufacturing sector evolves over time. We can use the labor intensity, sector share and aggregate labor productivity effects to signify a country in a three-dimensional graph having the labor intensity effect (in percentage points) on the x axis, the sector share effect (also in percentage points) on the y axis and the aggregate labor productivity effect on the z axis.
The closer two point to each other are, the more similarly their employment shares have evolved during a given time period (Grodzicki, 2014; Deichmann et al., 2017).
Interpreting the three effects of the decomposition as coordinates that place a country group or country in this space, we can calculate the distance between any two points.
The number we thus get does not have any particular meaning as such, it is an ordinal variable telling us how similar or different the evolution of the share of manufacturing employment between two country(groups) is. Within the PS10 country group we find a larger spread than within the EU15 group. The PS10 countries’ average distance from the PS10 group is 5.9, whereas the average distance between EU15 countries and the EU15 group is 2.4. Even though we earlier mentioned, that PS10 countries evolve more similarly in a sense that x < 0, y > 0 and z > 0, they are more spread out around the group average. The two groups also seem to be evolving differently: the distance between the EU15 and the PS10 is 13.0. In the post-crisis period the spread in both country groups decreases: the average distance of individual countries from the group average in the EU15 falls back slightly to 2.3, but in the PS10 group it decreases to 2.9.
Also, the two groups get closer to each other, their distance in the later period in only 5.5.
Placing the countries on the graph we mostly need the (–,+,+), the (–,–,+) and the (–,–,–) octants of the three dimensional space described above. We can introduce the x + y + z = 0 plane into the graph, and if an (x; y; z) combination representing a country group or country is above this plane, then the share of manufacturing employment increased in that particular country(group) and that particular time period. The greater the distance from this plane is, the greater the change is in the share of manufacturing employment. If we rotate the three-dimensional graph 45 degrees around the x axis so
that the plane indicating constant manufacturing employment share appears as a line, we can even get a two-dimensional graphical representation of the country groups and countries. The x axis is still the labor intensity effect, but the y axis now is a combination of the sector share and aggregate labor productivity effects. Figure 2 shows the two country groups and the individual PS10 countries in the pre-crisis time period.
Figure 2. Change of manufacturing in each country according to decomposition in the pre-crisis period of 2000–2008 (% points)
Source: authors’ own calculations Note: subscript 1 refers to the first period (2000–2008). BG – Bulgaria, CZ – The Czech Republic, EST – Estonia, H – Hungary, LT – Latvia, LV – Lithuania, PL – Poland, RO –
Romania, SK – Slovakia, SLO – Slovenia
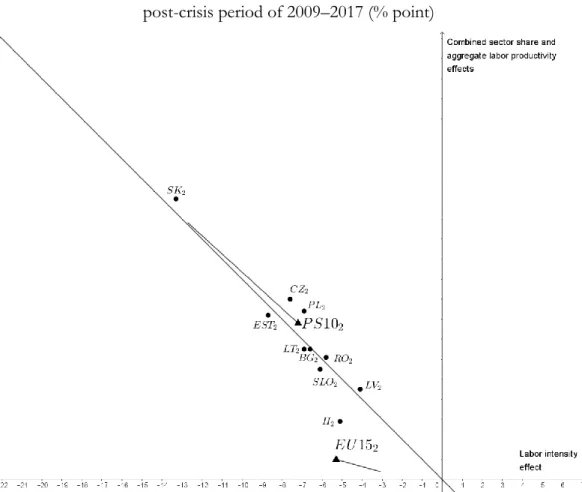
In the pre-crisis period, virtually no PS10 country experienced a pattern of evolution in manufacturing similar to that of the EU15 (the closest being Latvia). After the crisis, the development of manufacturing was more similar to the average development of the EU15 in the post-socialist countries. Figure 3. shows the same country groups and countries for the post-crisis period. The segments connected to the EU15 and the PS10 points indicate the displacement of these country groups from the
earlier time period. When we take the EU15 as a point of reference, the evolution pattern of the share of manufacturing employment in this later time period is most closely followed by Hungary. Latvia is still about the same distance from the EU15 pattern than in the first time period, an important qualitative difference being that in the post-crisis time period Latvia experiences an increase in the share of manufacturing employment. Comparing figures 2. and 3. one can see also visually how much more clustered the individual PS10 countries around the country group average are.
Figure 3. Change of manufacturing in each country according to decomposition in the post-crisis period of 2009–2017 (% point)
Source: authors’ own calculations Note: subscript 2 refers to the second period (2009–2017). BG – Bulgaria, CZ – the Czech Republic, EST – Estonia, H – Hungary, LT – Latvia, LV – Lithuania, PL – Poland, RO – Romania, SK – Slovakia, SLO – Slovenia
Altogether, we found that there is (mature) reindustrialization, albeit a slow one, in PS10 countries meaning an increasing trend in their manufacturing share in employment but deindustrialization in EU15. This result can possibly be explained by two processes, which can also be interlinked. On the one hand, although in the post-
socialist countries there was a drastic decline in manufacturing employment after the regime change, as they had a significant manufacturing sector in the planned economy before the 1990s, there was also a great opportunity for reindustrialization, which is also indicated by high share of manufacturing employment. On the other hand, a considerable influx of foreign capital also contributed to this process of reindustrialization. This comes primarily from establishing units that perform assembling activities of low value added and high labor intensity (Lux, 2017; Resmini, 2007), but proximity to the EU border had also considerable impact on the process, benefiting some regions more than others (Kallioras and Petrakos, 2010; Resmini, 2007).
4. Discussion
Finding slow but steady reindustrialization trends in the post-socialist countries and a persistent deindustrialization in the core EU 15 country group we would expect the relative importance of the manufacturing in the PS10 to increase within the EU.
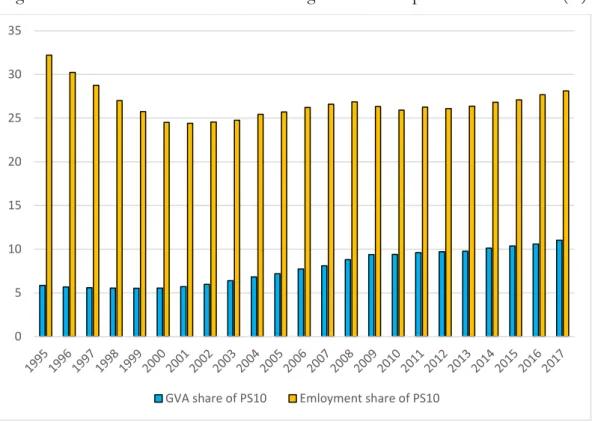
Looking at how the share of the PS10 countries in manufacturing employment and GVA changed within the EU25 (which is the aggregate of our two country groups), we find that since 2000 the PS10 gains importance within the EU25 (Figure 4). Even though the importance of the PS10 group increases, the shares are still quite low: in 2017 28.7% of those employed in manufacturing produce only 11.0% of manufacturing (as opposed to 25.5% and 5.5% in 2000). Even a strong reindustrialization in the PS10 countries would not substantially change the whole EU’s manufacturing performance.
For comparison, in terms of manufacturing GVA the PS10 group is comparable to Spain, and about one-fifth the size of Germany, while it employs more people than Spain and Germany combined.
Figure 4. Share of PS10 in the manufacturing of EU in the period of 2000–2017 (%)
Source: Eurostat, authors’ own calculation
The difference in these shares and their evolution indicates massive differences in labor productivity between the two groups. Labor productivity, calculated as manufacturing GVA per person employed in manufacturing, is shown in Figure 5. In the EU15 countries there was a nearly 12% increase in total labor productivity from 2000, but manufacturing did much better than this: there the efficiency improvement was 44%.
The PS10 countries outperform both of these values with 71% of increase in overall and 154% in manufacturing labor productivity. However, they still lag considerably behind the labor efficiency characterizing the EU15 countries, which can be attributed to the fact that they started from a low base. This difference can be explained by differing employment shifts between sectors where productivity difference is large as opposed to where it is small (Bah and Brada 2009).
0 5 10 15 20 25 30 35
GVA share of PS10 Emloyment share of PS10
Figure 5. Real GVA per person employed in manufacturing1995–2017 (1000 euro), in real terms of 2005
Source: Eurostat, authors’ own edition based on nama_10_a10 and nama_10_a10_e
The PS10 countries started from a very low basis: in 1995 their labor productivity was only about 13% of that of the EU15. By 2000, this had increased to 18%, in 2008 it was already 26%, and by 2017 it increased to about 32%. The highest manufacturing labor productivity in the PS10 group (Slovenia, 37 700 euro/employed) still only surpasses the two lowest 1995 labor productivities in the EU15 (Portugal had 15 900 and Greece had 28 100 euro/employed). The global financial crisis seems to have affected the EU15 manufacturing more than it has the PS10.
Domestic value added in the export of Central and Eastern European countries is still of relatively low level, particularly in high-tech industries (Olczyk and Kordalska, 2017), but foreign capital, technology, and business models brought by western companies are crucial for their further development (Grodzicki and Geodecki, 2016;
Resmini, 2007). Farkas (2016), Ženka et al. (2014), Lengyel (2017) and Rachwal (2015) point out that the post-socialist EU member states are lagging considerably behind in terms of the export of higher value-added, research-based products compared to the performance of western countries and are still more specialized in traditional, or low- tech manufacturing (Chapman, 2013).
0 10 20 30 40 50 60 70 80
1995 1996 1997 1998 1999 2000 2001 2002 2003 2004 2005 2006 2007 2008 2009 2010 2011 2012 2013 2014 2015 2016 2017
EU 15 PS10
The parallel deindustrialization in one part of a group of countries and reindustrialization in another can be an indication of a change in the division of labor between these countries. The division of labor between developed and developing countries is studied by the new economic geography (Fujita et al., 1999; Krugman, 1995), among others. According to the spatial core-periphery model, the spatial restructuring of the global economy is primarily affected by decreasing unit transport costs, increasing returns to scale characterizing global (traded) industries, and monopolistic competition (Brakman et al., 2009; Fujita et al., 1999; Fujita and Thisse, 2002). In the description of the core-periphery model, commending Paul Krugman’s Nobel Prize, renowned figures of the new economic geography point out that “Some firms now relocate from the core to the periphery. In other words, the periphery experiences a process of reindustrialization.
Simultaneously, the core might start losing firms, thus becoming deindustrialized”
(Fujita and Thisse, 2009, p. 114). As described by Combes et al. (2008, p. 168): “This amounts to the reindustrialization of the periphery, and possibly a simultaneous deindustrialization of the core”. Bartlett and Prica (2017) distinguish between inner and outer core, and also inner and outer periphery within the EU, and based on the strength of interdependence with the inner core, put some of the PS10 countries into the outer core, and the rest (Bulgaria, Hungary and Romania) in the outer periphery. One cannot be more specific about the changing division of labor without looking into the subsector-breakdown of manufacturing or also investigating the evolution of the service sector in these countries.
The fourth industrial revolution (Industry 4.0) based on digitalization may also have a considerable impact on manufacturing, as technological development may lead to the emergence of “connected smart factories” (EC, 2016, p. 12). The fourth industrial revolution may also generate the deindustrialization processes during which the share of manufacturing in employment is expected to further decline, while productivity and GVA is projected to increase, or at least not to decrease, as a result of technological changes. These processes in turn are expected to have different effects in developed and developing countries, also contributing to the creation of a new division of labor between the core and the periphery in the European Union.
The data and trends in manufacturing indicate that different processes take place in the two country groups. In the EU15, the share of persons employed in
manufacturing decreases while the share of manufacturing gross value added stagnates or slightly decreases, which we claim indicates the continuation of deindustrialization, but in a different way than before. Meanwhile in the PS10, the share of persons employed in manufacturing slightly increases and the share of manufacturing gross value added dynamically increases, which is similar to traditional reindustrialization.
5. Conclusion
In our study we examined how reindustrialization takes place in the EU recently, if it actually does, and how the processes taking place in the 10 post-socialist new member states are similar to the ones taking place in the EU15. The relevance of the topic is supported by the fact that the strategic documents of the European Union and the economic policies of member states both place emphasis on the reevaluation of the role of manufacturing from 2010. Analyzing statistical data on both employment and GVA, however, shows conflicting manufacturing trends in the EU15 and PS10 countries. Manufacturing has significantly transformed over the past decades in developed countries: its relative importance has decreased due to the growth of the service sector. However, the economic policy documents drawn up after the crisis of 2008 in both old and new (i.e. post-socialist) EU member states assign an important role to the sector in employment, announcing reindustrialization. The contribution of manufacturing to GVA, however, is different in these two country-groups.
Our results point out that there are different processes taking place in manufacturing in the two country groups of the EU: the EU15 is characterized by deindustrialization, while the PS10 by reindustrialization. The processes occurring in the PS10 can be explained by their considerable industrial base before the 1990s on the one hand, and the foreign capital settling on this base on the other, which brought mostly low value-added, high labor-intensity activities. We note that 24.5% of the persons employed in the manufacturing of the EU25 worked in the PS10 in 2000, a proportion which increased to 28.1% by 2017. In our analysis we examined the development of manufacturing by using a decomposition of the change in the share of persons employed separating the effects of changing labor intensity, changing sector share in gross value added and changing aggregate labor productivity. Our decomposition showed that in the PS10 countries there is a negative labor intensity effect coupled with
a positive sector share and a positive aggregate productivity effect. In this group the positive effects dominate the negative labor intensity effect in a growing number of countries (only two countries before the crisis, but six countries after the crisis). The slow and steady increase in the share of manufacturing employment came to a halt and reversed for a few years around 2008, but the share of manufacturing in GVA increases fast. The EU15 countries, on the other hand, are characterized by a different process:
the negative labor intensity dominates the other two and thus the share of manufacturing employment steadily decreases, while manufacturing GVA share also decreases slightly. There is just one single EU15 country where the share of manufacturing employment could increase.9 It seems that Central and Eastern Europe are gradually becoming the manufacturing background of Western European countries.
Whether this parallel reindustrialization at the periphery and deindustrialization at the core means a restructuring of the division of labor between these groups could only be determined by further analysis of the internal structure of the manufacturing sector in both country groups. Individually investigating the most important manufacturing countries in the two group (e.g. Germany, Austria, Finland from the EU15, and Czech Republic, Slovak Republic, Poland from PS10) and looking into the trends at the sub- section level of manufacturing as well as trade in low-, medium- and high-tech (manufactured) products would be able to shed light on the potential restructuring of the core-periphery division of labor in the EU.
References
Alderson A. (1999), ‘Explaining Deindustrialization: Globalization, Failure, or Success?’, American Sociological Review, 64 (5), 701–721.
Bah E-H.M., Brada J.C. (2009), ‘Total Factor Productivity Growth, Structural Change and Convergence in the New Members of the European Union’, Comparative Economic Studies, 51 (4), 421–446.
Barta Gy., Czirfusz M., Kukely Gy. (2008), ‘Re-industrialization in the world and in Hungary’, European Spatial Research and Policy, 15 (2), 5–26.
Bartlett W., Prica I. (2017), ‘Interdependence between core and peripheries of the European economy: secular stagnation and growth in the West Balkans’, The European Journal of Comparative Economics, 14 (1), 123–139.
9 This country is Portugal that experienced a 0.5 percentage point increase in manufacturing employment share in the post-crisis period, and even this means a decrease in actual employment by 250 thousand manufacturing jobs.
Brakman S., Garretsen H., Marrewijk van C. (2009), The New Introduction to Geographical Economics, Cambridge University Press, Cambridge.
Cairncross A. (1982), ‘What is deindustrialisation?’, in Blackaby F. (ed), Deindustrialisation, Pergamon Press, London, 5–17.
Cantore N., Clara M., Lavope A., Soare C. (2017), ‘Manufacturing as an engine of growth:
Which is the best fuel?’, Structural Change and Economic Dynamics, 42 (9), 56–66.
Chapman S. A. (2013), ‘Specialization and Agglomeration Patterns in Eastern Europe’, The European Journal of Comparative Economics, 10 (1), 49–79.
Combes P., Mayer T., Thisse J.-J. (2008), Economic geography. The integration of regions and nations, Princeton University Press, Princeton and Oxford.
Cristopherson S., Martin R., Sunley P., Tyler P. (2014), ‘Reindustrialising regions: rebuilding the manufacturing economy’, Cambridge Journal of Regions, Economy and Society, 7 (3), 351–358.
https://doi.org/10.1093/cjres/rsu023
Deichman J. I., Eshghi A., Haughton D., Li M. (2017), ‘Socioeconomic Convergence in Europe One Decade After the EU Enlargement of 2004: Application of Self-Organizing Maps.’
Eastern European Economics, 55, 236-260. DOI:
https://doi.org/10.1080/00128775.2017.1287547
EC (2010), EUROPE 2020. A strategy for smart, sustainable and inclusive growth, COM(2010) 2020 final. Brussels: European Commission
EC (2012), A Communication From the Commission to the European Parliament, the Council, the European Economic and Social Committee and the Committee of the Regions. A Stronger European Industry for Growth and Economic Recovery, COM(2012) 582 final. Brussels: European Commission.
EC (2014a), Reindustrializing Europe. Member States. Competitiveness Report 2014, Brussels: European Commission.
EC (2014b), Communication from the Commission to the European Parliament, the Council and the European Economic and Social Committee and the Committee of the Regions. For a European Industrial Renaissance, COM(2014) 14 final. Brussels: European Commission.
EC (2016), Communication from the Commission to the European Parliament, the Council and the European Economic and Social Committee and the Committee of the Regions. Digitizing European Industry Reaping the full benefits of a Digital Single Market, COM(2016) 180 final. Brussels: European Commission.
Elekes A., Halmai P. (2013), ‘Growth Model of the New Member States: Challenges and Prospects’, Intereconomics, 48 (2), 124–130.
Farkas B. (2016), Models of Capitalism in the European Union: Post-crisis Perspectives, Palgrave Macmillan, London.
Fujita M., Krugman P., Venables A. J. (1999), The Spatial Economy. Cities. Regions. and International Trade, MIT Press, Cambridge, MA.
Fujita M., Thisse J.-F. (2002), Economics of Agglomeration. Cities, Industrial Location, and Regional Growth, Cambridge University Press, Cambridge, MA.
Fujita M., Thisse J.-F. (2009), ‘New Economic Geography: An appraisal on the occasion of Paul Krugman’s 2008 Nobel Prize in Economic Sciences’, Regional Science and Urban Economics, 39 (2), 109-119. https://doi.org/10.1016/j.regsciurbeco.2008.11.003
Grodzicki M. J. (2014), ‘Structural Similarities of the Economies of the European Union’, Equilibrium. Quarterly Journal of Economics and Economic Policy, 9(1), 93-117. DOI:
http://dx.doi.org/10.12775/EQUIL.2014.006
Grodzicki M. J., Geodecki T. (2016), ‘New Dimensions of Core-Periphery Relations in an Economically Integrated Europe: The Role of Global Value Chains’, Eastern European Economics, 54 (5), 377–404. DOI: 10.1080/00128775.2016.1201426
Kallioras D., Petrakos G. (2010), ‘Industrial growth, economic integration and structural change:
evidence from the EU new member-states regions’, The Annals of Regional Science, 45 (3), 667–
680.
Krugman P. (1988), ‘Deindustrialization, Reindustrialization, and the Real Exchange Rate’, NBER Working Paper Series, 2586. National Bureau of Economic Research, Cambridge (MA).
doi:10.3386/w2586
Krugman P. (1995), Development, Geography and Economic Theory, MIT Press, Cambridge (MA).
Kudina A., Pitelis C. (2014), ‘De-industrialisation, comparative economic performance and FDI inflows in emerging economies’, International Business Review, 23 (5), 887–896.
http://dx.doi.org/10.1016/j.ibusrev.2014.02.001
Landesman M. A. (2015), ‘Industrial Policy: Its Role in the European Economy’, Intereconomics, 3, 133–138.
Lengyel I. (2017), ‘Competitive and Uncompetitive Regions in Transition Economies: The case of the Visegrad post-socialist countries’, in Huggins R., Thompson P. (eds), Handbook of Regions and Competitiveness. Contemporary Theories and Perspectives on Economic Development, Edward Elgar, Cheltenham, 398–415.
Lengyel I., Vas Zs., Szakalne K. I., Lengyel B. (2017), ‘Spatial differences of reindustrialization in a post-socialist economy: manufacturing in the Hungarian countries’, European Planning Studies, 25 (8), 1416–1434. http://dx.doi.org/10.1080/09654313.2017.1319467
Lux G. (2015), ‘The Institutional Conditions of Reindustrialization on Post-crisis Central Europe’, Journal of Economics and Management, 19(1), 16–33.
Lux G. (2017), ‘Industrial competitiveness’, in Lux G., Horváth G. (eds), The Routledge Handbook to Regional Development in Central and Eastern Europe, Routledge, Abingdon, 29–46.
McMillan M. S., Rodrik D. (2011), ‘Globalization, structural change and productivity growth’, NBER working paper, 17143. National Bureau of Economic Research, Cambridge, MA.
McMillan M., Rodrik D., Sepulveda C. (2017), ’Structural Change, Fundamentals and Growth: A Framework and Case Studies’. NBER Working Paper, 23378. National Bureau of Economic Research, Cambridge, MA.
Nagy B., Lengyel I. (2016), ‘The Structural Change of Manufacturing in Hungary, 2008–2014’, Studies in International Economics: Special Issue of Külgazdaság, 2, 3–27.
Olczyk M., Kordalska A. (2017), ‘Gross Exports Versus Value-Added Exports: Determinants and Policy Implications for Manufacturing Sectors in Selected CEE Countries’, Eastern European Economics, 55 (1), 91–109. https://doi.org/10.1080/00128775.2016.1254564.
Palma J. G. (2005), ‘Four Sources of “De-Industrialisation” and a New Concept of the “Dutch Disease”’, in Ocampo J. A. (ed), Beyond Reforms: Structural Dynamics and Macroeconomic Vulnerability, Stanford University Press and World Bank, New York.
Palma J. G. (2008), ‘Deindustrialisation, Premature Deindustrialisation, and the Dutch Disease’, in Blume L., Durlauf S. (eds), The New Palgrave: A Dictionary of Economics, Palgrave Macmillan, Basingstoke, 401–410.
Pelkmans J. (2006), ‘European industrial policy’, in Bianchi P., Labory S. (ed), International Handbook on Industrial Policy, Edward Elgar, Cheltenham (UK) 45–78.
Rachwal T. (2015), ‘Structural changes in Polish industry after 1989’, Geographia Polonica, 88 (4), 575–605.
Resmini L. (2007), ‘Regional Patterns of Industry Location in Transition Countries: Does Economic Integration with the European Union Matter?’, Regional Studies, 41 (6), 747–764.
Rodrik D. (2016), ‘Premature deindustrialization’, Journal of Economic Growth, 21 (1), 1 –33.
Rowthorn R., Coutts K. (2004), ‘De-industrialisation and the Balance of Payments in Advanced Economies’, Cambridge Journal of Economics, 28 (5), 767–790.
http://dx.doi.org/10.1093/cje/beh034
Rowthorn R., Ramaswamy R. (1997), ‘Deindustrialization: Causes and Implications’, Working Paper 97/42, IMF, Washington, DC.
Saeger S. (1997), ‘Globalization and Deindustrialization: Myth and Reality’, OECD Review of World Economics, 133 (4), 579–608. http://dx.doi.org/10.1007/BF02707404
Scott A., Storper M. (Eds.) (1992), Pathways to Industrialization and Regional Development, Routledge, London.
Stojcic N., Aralica Z. (2017), ‘Choosing Right from Wrong: Industrial Policy and (De)industrialization in Central and Eastern Europe’, EIZ Working Paper no. 1703, Ekonomski Institut Zagreb, Zagreb.
Szirmai A. (2012), ‘Industrialisation as an engine of growth in developing countries, 1950-2005’, Structural Change and Economic Dynamics, 23 (4), 406–420.
http://dx.doi.org/10.1016/j.strueco.2011.01.005
Török Á., Csuka G., Veres A. (2015), ‘Transformation of the European Union’s Industrial Policy and it Impacts on Industrial Policies of the New Member Countries’, International Journal of Business Insight and Transformation, 9 (1), 5–7.
Tregenna F. (2009), ‘Characterising deindustrialisation: An analysis of changes in manufacturing employment and output internationally’, Cambridge Journal of Economics, 33 (3), 433–466.
http://dx.doi.org/10.1093/cje/ben032
Tregenna F. (2013), ‘Deindustrialization and Reindustrialization’, in Szirmai A., Naudés W., Alcora L. (eds), Pathways to Industrialization in the Twenty-First Century. New Challenges and Emerging
Paradigms, 76–101, Oxford University Press, Oxford (UK).
http://dx.doi.org/10.1093/acprof:oso/9780199667857.003.0003
Tregemma F. (2016), ‘Deindustrialization and premature deindustrialization’, in Reinert E. S., Ghosh J., Kattel R. (eds), Handbook of Alternative Theories of Economic Development, Edward Elgar, Chettelham, pp 710–728
Wolman H., Wial H., Hill E. (2015), ‘Introduction to Focus Issue on Deindustrialization, Manufacturing Job Loss, and Economic Development Policy’, Economic Development Quaterly 29 (2), 99–101. http://dx.doi.org/10.1177/0891242414567055
Ženka J., Novotný J., Csank P. (2014), ‘Regional competitiveness in central European countries:
in search of a useful conceptual framework’, European Planning Studies, 22 (1), 164–183.