Psychological resources, dropout risk and academic performance in university students – pattern-oriented analysis and prospective study of Hungarian freshmen
Tamás Martos1 &Balázs Jagodics1&Judit Kőrössy1&Éva Szabó1
Accepted: 4 July 2021
#The Author(s) 2021
Abstract
A growing number of studies support the idea that academic performance is based on specific psychological resources and cognitive abilities. As early university dropout is a widespread problem, it is increasingly important to explore which psychological resources can enhance learning, academic motivation, and achievement during the transition from high school to university. The goal of our study was to explore the psychological resources at the start of the studies linked to subsequent academic achievement. Coping mechanisms, time perspective, self-esteem, mindset, motivation, and test anxiety were measured using questionnaires in a voluntary online study among first-year university students (N = 1113, 53.0 % female). Using exploratory factor analysis, we identified three different factors of psychological resources:
‘Academic achievement focus’, ‘Self-confidence’, and 'Search for interests’. Based on the factor scores, hierarchical cluster analysis identified five subgroups of students. These subgroups showed differential association with first semester GPA and the number of attained credits. The combination of a focus on high academic achievement but low self- confidence could be traced as characteristics predicting the highest risk of decreased achievement and loss of credits.
These results indicate that training in psychological resources could support academic achievement and prevent university dropout.
Keywords Academic performance . Psychological resources . Exploratory factor analysis . Hierarchical cluster analysis . Higher education
Introduction
It is well known that higher levels of formal education are associated with better possibilities in the job market and increased income (Heckman et al., 2018). People who complete a higher education course are more secure as regards the effects of economic crises and they are more capable of adapting to changing employment challenges (Quinn, 2013). Therefore, the number of people who start and finish higher education successfully is important from both individual and societal aspects. As the worldwide ratio of dropout in higher education is around 30%
(OECD,2013), it is important to explore the factors which
can either enhance or decrease the chance of successful graduation. In a prospective study with Hungarian first- year students, we address the dropout risk and academic achievement by focusing on the role of general and study- related psychological resources. Such resources may sup- port the transition process from high school to university (Gál et al., 2021), and optimally, provide the necessary conditions for sustainable achievements (Heckhausen et al., 2013). Importantly, we will apply a pattern- oriented approach of these resources, where specific, non- linear combinations of these resources represent character- istic subgroups of students who may be subject of targeted preventive psychological interventions (Ortiz-Lozano et al., 2018).
Psychological Resources Affecting Academic Achievement and Dropout Prevention
Several theoretical models apply a multidimensional and mul- tivariate approach to the prediction of academic achievement in higher education and risk of dropout (Bennett,2003; Quinn,
* Tamás Martos
tamas.martos@psy.u-szeged.hu
1 Institute of Psychology, University of Szeged, Szeged, Hungary https://doi.org/10.1007/s12144-021-02073-z
2013; Winne & Nesbit,2010). The majority of these complex models distinguish between personal level, social level, and institutional level factors and researchers call for targeted ac- tions at each level to fill the“gap between research and prac- tice”(Tinto,2006; p.4.). While institutional and social level factors provide context to individual academic functioning and achievements (Winne & Nesbit,2010), here we focus on personal level factors that can be addressed by psycholog- ical interventions. Moreover, we apply a personal-resource approach (Hobfoll,2002) that gives a general framework to explore the potential role of a series of psychological re- sources at multiple levels of students’functioning (Salmela- Aro & Upadyaya,2014).
Hobfoll (2002, p. 307.) refers to resources as“entities that either are centrally valued in their own right (…) or act as a means to obtain centrally valued ends”. Important aspects of resources are that they are actively used by the individual when facing stressful situations, challenges, and, therefore,
“the possession of reliable resource reservoirs is critical in promoting and maintaining well-being and health”(Hobfoll, 2002, p. 311.). The transition from high school to university is undoubtedly a stressful and resource-demanding cascade of life changes (Conley et al.,2014) that may significantly affect later achievements and well-being (Conley et al.,2020). The transition process involves many aspects of the students’ social-ecological reality, such as change in their social net- works, work possibilities including part-time jobs, and, mov- ing from home in many cases. Indeed, during the transition process, there is a complex task of‘niche construction’(Eden, 2008; Oishi,2014), constructing a new personal world. It is important to note that the constructive process involves not just study-related challenges issues but also the management of several life circumstances connected to studies: social roles (e.g., establishing connection to mentors and lecturers, explor- ing new ways of friendships and romantic relationships), fi- nances, practical issues. Consequently, successful manage- ment of the transition process may require complex sets of personal resources appropriate for handling several types of situations inside and outside the actual domain of study.
Given this complexity of challenges and the personal re- sources necessary to manage them, we may assume that sat- isfactory mobilization of personal resources may be conclu- sive for navigating through the transition process and estab- lishing a successful academic career (Conley et al., 2020;
Santisi et al.,2018). Corresponding to the broad types of chal- lenges that young adults may face, those directly linked to studies (management of learning situations, information ac- quisition, assignments, and exams) and more general ones encompassing them (social situations), we can distinguish be- tween general as well as study-related psychological resources (Salmela-Aro & Upadyaya,2014). Several studies show that academic achievement is dependent on nonintellective vari- ables beyond cognitive, study-related factors (Boerchi et al.,
2018; Magnano et al.,2020a; Magnano et al.,2020b). These factors include social relationships (family, peers, and teachers), motivation, self-efficacy, self-esteem, and time management skills, among others (Magnano et al., 2020a;
Magnano et al.,2020b). The variables used in our study will be described in the following sections, classified as‘general‘ and‘study-related’resources. Below we summarize previous studies that provide evidence for the importance of general and study-related resources in academic achievement, and dropout prevention.
General Resources and Academic Achievement Self-Esteem
Self-esteem is an appraisal of one’s own performance, char- acteristics, and value, and is an important component of psy- chological well-being. Generally, people who report higher self-esteem cope better with stress, they are in better physical condition (Taylor & Stanton,2007) and are more able to per- severe in the face of difficulties (Di Paula & Campbell,2002) which can explain previous results that have found a link between self-esteem and academic achievement (Booth &
Gerard,2011).
Life Satisfaction
According to previous studies, life satisfaction is a core com- ponent in psychological well-being, motivation, and behavior (Diener & Fujita,1995). Life satisfaction can be associated with academic achievement in terms of both a cause and a consequence (Rode et al.,2005). Students who are generally more satisfied with their lives could be more motivated to study. On the other hand, being unsuccessful in one’s studies can result in decreased life satisfaction.
Meaning in Life
The search for meaning in life is an essential psychological need and finding meaning in life is an important way of avoiding stress, while it is also associated with higher psycho- logical well-being (King et al., 2006). Theoretical consider- ations differentiate between two different aspects of meaning in life. The first is presence of meaning which refers to experiencing a sense of significance in life and the feeling of having meaningful purposes and goals. The other aspect is the search for meaning which describes the active efforts people make in order to find a purpose and a sense to life (Steger et al.,2006). Among students, higher meaning in life is asso- ciated with higher intrinsic motivation and life satisfaction scores (Bailey & Phillips,2016) which, in turn, may lead to higher academic achievement.
Social Support
Social support is the perceived level of care and assistance received from one’s family, friends, and significant others.
Social support can take various forms (e.g. informational, emotional or tangible); however, regardless of its source, it has been associated with reduced stress (Lee & Goldstein, 2016) and, among students, it is also negatively related to burnout (Kim et al.,2018). Based on these results, social sup- port seems to be an important resource for students in terms of the challenges and obstacles they may face in higher education.
Time Perspective
There are considerable differences between individuals as regards their attitude to time and this attitude, also called time perspective, may influence their behavior.
Zimbardo and Boyd (1999) identified five different time perspectives (TP), which all have different behavioral outcomes. Past positive TP is a contented attitude to- ward events of the past, while, in contrast, past negative TP is characterized by holding on to troubling and un- pleasant memories. Present hedonistic TP is a joy- seeking attitude, which goes hand in hand with risk- taking tendencies. Individuals with higher present hedo- nistic TP prefer immediate pleasure over more potential- ly favorable future outcomes. Present fatalistic TP refers to a helpless and hopeless attitude toward life. Finally, people with high future TP prefer to achieve long-term goals. Studies show that time perspective is related to a wide range of behaviors, such as coping, health, sub- stance use or drinking (Wills et al., 2001). Among stu- dents, future TP is associated with higher academic achievement (Zimbardo & Boyd,1999), as higher future TP is characterized by the ability to delay rewards for possibly better long-term outcomes. Moreover, future TP is associated with mastery goal orientations and in- trinsic motivation (de Bilde et al., 2011).
Study-Related Specific Resources and Academic Achievement
Procrastination
Procrastination is defined as the reluctance to fulfill tasks, which is followed by a subjective sense of dis- comfort (Choi & Moran, 2009). Procrastination can lead to decreased performance or the complete failure to ful- fill tasks, and is often linked to low self-regulation (Park & Sperling, 2012); therefore, it can influence con- tinuing behavior in various areas of life, such as work and education. Procrastination is often studied in
educational contexts, as students who are prone to pro- crastinate more often have lower academic achievement (Bennett, 2003; De Paola & Scoppa, 2015). On the other hand, certain models distinguish between harmful, passive instances of procrastination and the more bene- ficial forms of active procrastination. According to this model, passive procrastination equates to the avoidance of negative emotions; in contrast, active procrastination is based on a conscious decision to delay tasks until the optimal time to be efficient and productive. Several studies claim that active procrastination could indeed be effective in an academic context (Corkin et al., 2011).
Self-Efficacy
Self-efficacy refers to the beliefs that a person holds about their own abilities to successfully complete tasks and challenges in a given situation. Self-efficacy is widely studied in educational contexts. Students who report higher self-efficacy in learning are more success- ful and report higher study engagement (Olivier et al., 2019), as they make more effort to complete tasks, have more control over their achievement, and are generally more self-confident (Luszczynska et al., 2005).
Test Anxiety
Although excitement is a natural reaction to important events, excessive anxiety can also inhibit performance. In educational contexts, students who worry more about failing exams or are afraid of performing poorly in tests tend to report lower aca- demic achievement (Chapell et al.,2005). High test anxiety leads to decreased performance in cognitive tasks such as attention and memory (MacLeod & Donnellan,1993).
Factors in Academic Achievement: Pattern-Oriented Accounts
Variable-oriented analysis is often used in models built to predict dropout, as researchers aim to explore how certain factors affect academic achievement. The strength of these models depends on how the variables used in the analysis can cover the diverse variety of psychological constructs.
Although the models can be compelling, in most cases, the results cannot be interpreted as causal links, even if the vari- ables are defined in the model as effective agents instead of independent variables. Moreover, the main weakness of variable-oriented models is that they cannot take complex and dynamic interrelations of variables into account.
Therefore, researchers increasingly apply a different theo- retical and data analytic approach, namely some type of the pattern-oriented framework, also known as a person-oriented
or person-centered approach1(Howard & Hoffman, 2018).
The variable-oriented data analytic approaches aim at the identification of (linear) associations between selected sets of variables, and are informative on main effects, central ten- dencies and the strength of general relationships between the variables. The pattern-oriented approach, in contrast, treats individual characteristics (variables) as interdependent parts in an integrated, holistic functioning (Bergman et al.,2003).
In the case of academic achievement, it means that the stu- dents function as cohesive, integrated persons whose personal resources may form specific configurations/types, that is, non- linear combinations of the resources. Subsequently, each type of students can be explored regarding their study achieve- ments. This way, the pattern-oriented approach provides an alternative way to study complex sets of individual character- istics (Asendorpf,2015).
While variable-oriented methodologies are frequently ap- plied in academic achievement research, the pattern-oriented approach has also attracted scholarly attention. Research has focused primarily on patterns of discrete constructs, such as social skills and strategies of emotion regulation (Keefer et al., 2012), study-related cognitions and attitudes (Bouckenooghe et al., 2016), and various motivational constructs (Litalien et al.,2019). Relatively few studies have addressed complex sets of characteristics as a basis for pattern-oriented analysis.
For example, Gonçalves and colleagues explored profiles of multiple kinds of achievement and social goals (Gonçalves et al.,2017) and Chittum and colleagues found that profiles of course-related complex experiences could predict several course outcomes (Chittum et al.,2019). The results of studies using cluster-based profiles and latent profile analysis suggest that, compared to variable-oriented studies searching for linear relationships, these models can provide more complex expla- nations for differences in student pathways in higher educa- tion. In line with these findings, we assume that a pattern- oriented analysis of university students’personal resources can meaningfully be applied to explain academic achievement.
Moreover, one advantage of the pattern-oriented approach lies in its ability to identify real-life subgroups that, in turn, may help to develop evidence-based sensitivity toward both vulnerable and resourceful types of students and study trajec- tories. Therefore, a pattern-oriented approach may be condu- cive to the early identification of at-risk student subgroups
both in theoretically meaningful and in praxis-oriented ways (Keefer et al.,2012). This, in turn, may be applied to provide early intervention programs systemically embedded in the in- stitutions’curricula and services, preferably at the beginning of the first year of study (Winne & Nesbit,2010). By insisting on “early interventions,”such as tutoring, counseling, and mentoring (Mitchell et al.,2019), it is widely acknowledged that dropout prevention optimally should be delivered within the first year of the studies (Wilson & Buttrick,2016).
The Present Study
The study applies a psychological-resources-based, bottom- up approach. It explores the meaningful dimensions of multi- ple psychological resources and typical subgroups of first- year students. Since both study-related and personal charac- teristics were assessed at the same time, namely, the start of higher education studies, it is assumed that these characteris- tics describe the whole person (not just “the student”).
Moreover, we applied a pattern-oriented data analysis proce- dure to identify complex types of first-year students. This approach extends the limitations of two- or three-way interac- tion analyses, as used in a traditional variable-centered ap- proach, allowing nonlinear combinations of several indepen- dent characteristics.
We also expected that the emergent patterns of first-year students’personal resources would explain the variations in the prospective academic achievement of the students. While a pattern-oriented analysis applies an explorative way of iden- tifying meaningful combinations of a set of characteristics, we may also form general assumptions about the direction of the associations. Previous studies confirm the individual signifi- cance of each study-related and psychological characteristic in academic achievement. Therefore, we assume that better aca- demic achievement and lower dropout risk (i.e., credits attained) at the end of the first semester would be predicted at the start of studies in higher education by:
(H1) higher level of psychological resources in self-esteem (Booth & Gerard,2011), life satisfaction (Rode et al.,2005), meaningfulness in life (Bailey & Phillips,2016), social sup- port (Kim et al.,2018), academic self-efficacy (Olivier et al., 2019), and future oriented and past positive time perspective (Zimbardo & Boyd, 1999), along with lower level of test anxiety (MacLeod & Donnellan,1993),
(H2) higher level of active and lower level of passive pro- crastination (Bennett,2003; Corkin et al.,2011; De Paola &
Scoppa,2015),
(H3) lower level of search for meaning in life and present fatalistic as well as present hedonistic time perspective (representing distraction from long term strivings) (Steger et al.,2006; Zimbardo & Boyd,1999).
It is important to note that, while we assume that study- related and psychological resources may predict prospective
1While the term‘person-oriented’is used more frequently than‘pattern-ori- ented’for studies with similar methodology and assumptions, we prefer the latter one. Research that seeks to identify patterns in the variables’configura- tions is not person-oriented in the sense that it still focuses on groups of respondents. Concerning the studied characteristics, the group members are more similar to each other than to members of other subgroups. However, there might be considerable variability inside the subgroups, and the patterns identified correspond only to the most typical respondents. In this way, the patterns represent group-level tendencies and not specific persons. However, they still have a certain personal character.
academic achievement at the start of the first semester, it is still unclear 1) how these characteristics bundle into different di- mensions of psychological resources, and 2) which combina- tions of these dimensions of resources are the most and the least conducive with respect to achievement. In these regards, our study is explorative in nature. We will present the results of a multistep analysis that aimed to identify 1) dimensions of academic and psychological resources, 2) subgroups of freshmen students based on these dimensions 3) who are at risk of lower academic achievement and higher dropout.
Methods
Sample and Procedure
A total of 1113 first-year university students participated in the study—590 females (53.0%) and 520 males (46.7%, 3 cases had missing data). Their mean age was 22.04 years (SD = 5.99). Data was gathered using an online survey. All enrolled freshman students (N= 3727) were invited to partic- ipate in the study at the start of the autumn semester of 2017.
The students were informed about the survey on the newsboard of the university’s online system. Participation in the research was voluntary. All participants were informed of the research goals and methods beforehand, and they signed an informed consent in which they agreed to track their grades using the method mentioned above. One thousand and one hundred sixty-five students decided to answer the questions (response rate = 31,3%), and 52 participants were excluded from the analysis due to incomplete data. A unique identifier was assigned to the participants, which enabled tracking their academic performance while maintaining their anonymity.
Research ethics approval was obtained before starting the study from the Unified Ethics Committee for Psychological Researches (EPKEB, Hungary) under the Nr. 2017/131, and is in accordance with the Declaration of Helsinki.
Measures Life Satisfaction
Life satisfaction was measured with a single question (Kuger et al.,2016). Using an 11-grade visual analog scale (ranging from 0 = worst possible to 10 = best possible), respondents were asked to indicate how much they regarded their current life as satisfactory.
Self-Esteem
Self-esteem was measured with using the Rosenberg Self- esteem Scale (Rosenberg,1965; Sallay et al.,2014). Ten items tap into the feeling of self-worth (a sample item being“I take a
positive attitude toward myself”). The Likert-type response format ranges from 1 (strongly disagree) to 4 (strongly agree), and internal consistency was excellent in the sample (Cronbach’sα= 0.902).
Meaning in Life
The presence of and search for meaning in life was assessed with a shortened six-item version (Martos & Konkolÿ,2012) of the Meaning in Life Questionnaire (Steger et al.,2006).
Three items measured the feeling of meaningfulness in life (i.e., from the Presence subscale,“I have a good sense of what makes my life meaningful”), and three items measured the search for meaning (i.e., from the Search subscale,“I am al- ways searching for something that makes my life feel signif- icant.”). Items were scored on a 7-point Likert-type scale (1 = strongly disagree, 7 = strongly agree). Internal consistency was satisfactory in the sample (Cronbach’s α= 0.728 and 0.688, respectively).
Time Perspective
Time perspective was assessed by the 17-item version of the Zimbardo Time Perspective Inventory (Orosz et al.,2017;
Zimbardo & Boyd, 1999) which consists of five subscales.
These are as follows: Past Negative (e.g. “I think about the bad things that have happened to me in the past.”four items, Cronbach’sα= 0.874), Past Positive (e.g.“Happy memories of good times spring readily to mind.”three items, Cronbach’s α= 0.629), Present Hedonistic (e.g.“I take risks to put excite- ment in my life.”three items, Cronbach’sα= 0.543), Present Fatalistic (e.g. “You can’t really plan for the future because things change so much.”three items, Cronbach’sα= 0.605), and Future (e.g.“I am able to resist temptations when I know that there is work to be done.”four items, Cronbach’sα= 0.763). Respondents provided their responses on a 5-point Likert-type scale (1 = very uncharacteristic; 5 = very characteristic).
Social Support
With 10 items from the Multidimensional Scale of Perceived Social Support (Papp-Zipernovszky et al.,2017; Zimet et al., 1988), we assessed the support received from the family (e.g.,
“My family really tries to help me”), friends (e.g.,“I can count on my friends when things go wrong”), and from other people in general (e.g.,“There is a special person in my life who cares about my feelings”). Items were evaluated on a 5-point Likert- type scale ranging from 1 (strongly disagree) to 5 (strongly agree). Since the three subscales had substantial intercorrela- tions, we calculated the total score for the ten items (‘Cronbach’sα= 0.914).
Academic Self-Efficacy
Academic self-efficacy was measured with a modified version of the General Self-efficacy Scale (Kopp et al.,1995). The items were slightly modified in order to fit the academic con- text. The scale consists of four items (e.g.“In my studies, I can solve most problems if I invest the necessary effort”), and uses a four-point Likert-type scale. The scale has good internal reliability (Cronbachα= 0.785).
Test Anxiety
A four-item subscale of the Motivated Strategies for Learning Questionnaire (Pintrich et al.,1991) was used to measure test anxiety, which uses a five-point Likert-type scale (e. g.“When I take tests, I think of the consequences of failing”). The scale has good internal reliability (Cronbach’sα= 0.842).
Procrastination
Procrastination was measured with the shortened version of the Active Procrastination Scale (Choi & Moran,2009;
Jagodics et al.,2019). Sample items are:“I often start things at the last minute and find it difficult to complete them on time”(passive procrastination; Cronbach’sα= 0.677) and“I don’t do well if I have to rush through a task”(active procras- tination, reverse coded; Cronbach’sα= 0.538).
Data Analytic Plan
Data was analyzed using IBM SPSS Statistics 22.0 software and the cluster analysis module of ROPstat (Vargha et al., 2015). In the first step, we applied principal axis factoring on the raw scores of the scales to determine the optimal num- ber of factors of psychological resources and their meaning.
Furthermore, we applied the regression method to calculate the factor scores that represented the underlying psychological constructs of the factors. In the next step, the factor scores were entered into a two-step cluster analysis that followed the recommendation of Vargha et al. (2016) to find the opti- mal cluster solution. The number of clusters was determined in a hierarchical cluster analysis using several adequacy mea- sures, and a subsequent k-means clustering (i.e., relocation) procedure was applied to provide the optimal individual fit of the cluster memberships. Cluster interpretation was based on the subsample means of the initial factor scores. In the final step, these clusters—representing specific subgroups of first- year students according to their characteristic psychological resources at the start of their first semester—were compared in two achievements at the end of the first semester: GPA, a common and widely used measure of academic achievements (Westrick,2017), and the number of attained credits in the first semester.
The number of attained credits may provide a supplemental aspect to evaluate individual achievements and to identify elevated risk of later dropout. In the current regulations on higher education in Hungary, the typical curriculum provides 30 credits per semester. Moreover, students with state-funded places are expected to attain at least 18 credits on average in the last two semesters. If they cannot comply with this expec- tation, they lose their state funding for their studies. Therefore, low credit attainment may considerably increase the burden of later studies (e.g., the pressure to attain more and more credits to comply with the minimum requirements) and, thus, the risk of dropout (Sosu & Pheunpha,2019).
Results
Descriptive Statistics
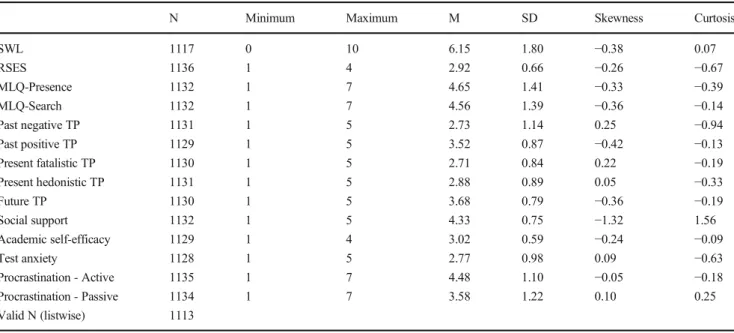
In the first step of the analysis, the mean scores of the sub- scales were computed according to the regular method of each questionnaire. Therefore, the range, mean and standard devi- ation scores of the initial variable set showed considerable variety. Descriptive statistics of the variables are shown in Table1.
Principal Axis Factoring
Principal axis factoring was used to explore the complex associations between the psychological resources and to identify their dimensions. All 14 variables presented in Table 2 were included in the analysis. Parallel analysis was used to determine the number of factors which rep- resent the structure of the data the most reliably. The analysis supported the presence of three valid factors.
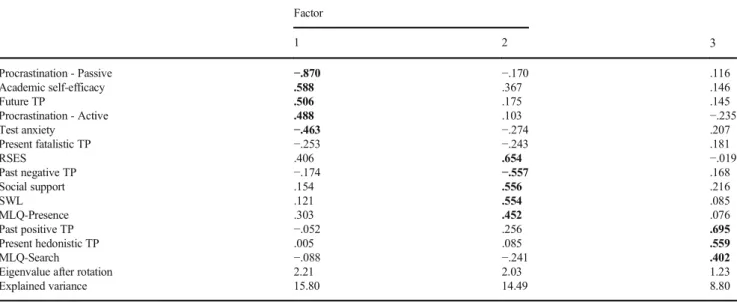
Consequently, we extracted three factors and submitted them to Varimax rotation. Rotated factor scores were com- puted using the regression method (provided as a baseline option in the SPSS package). Factors, factor loadings of the variables, and the variances explained by each factor are presented in Appendix Table 5. According to the pat- tern of the factor scores, the three academic resource di- mensions may be labeled as follows:
1. ‘Academic achievement focus’: high scores represent the abandonment of passive and the use of active procrastina- tion, along with high academic self-efficacy and low test anxiety. Future time perspective loaded on this factor too, indicating that a resistance to present temptations and con- scientious task management are also part of this dimension.
2. ‘Self-confidence’: high scores indicate better psychologi- cal well-being and resourcefulness, including self-esteem, satisfaction with life, support experienced in social
networks, the presence of meaningfulness in life, and the absence of traumatic childhood experiences that might weaken present self-confidence.
3. ‘Search for interests’: high scorers can be characterized by an increased striving for positive stimulation, either in the present or in the past, along with a search for meaningful- ness in life.
In the next step of the analysis, cluster analysis was imple- mented based on the three new factor scores described above.
Cluster Analysis
Hierarchical cluster analysis was conducted (Vargha et al., 2015) based on the z-scores of the factors in principle axis factoring and by applying the Ward method with squared Euclidean distances to maximize the differences between groups (Bergman et al.,2003; p.58–59.). The following ade- quacy measures were checked for the cluster solutions with 3–
10 clusters using the cutoff criteria of Vargha et al. (2015):
Explained Error Sum of Squares (EEES%; preferably >50%), Point biserial correlation coefficient (>0.3), Silhouette- coefficient (>0.5), modified Xie-Beni index, and homogeneity Table 1 Descriptive statistics of the variables in the analysis
N Minimum Maximum M SD Skewness Curtosis
SWL 1117 0 10 6.15 1.80 −0.38 0.07
RSES 1136 1 4 2.92 0.66 −0.26 −0.67
MLQ-Presence 1132 1 7 4.65 1.41 −0.33 −0.39
MLQ-Search 1132 1 7 4.56 1.39 −0.36 −0.14
Past negative TP 1131 1 5 2.73 1.14 0.25 −0.94
Past positive TP 1129 1 5 3.52 0.87 −0.42 −0.13
Present fatalistic TP 1130 1 5 2.71 0.84 0.22 −0.19
Present hedonistic TP 1131 1 5 2.88 0.89 0.05 −0.33
Future TP 1130 1 5 3.68 0.79 −0.36 −0.19
Social support 1132 1 5 4.33 0.75 −1.32 1.56
Academic self-efficacy 1129 1 4 3.02 0.59 −0.24 −0.09
Test anxiety 1128 1 5 2.77 0.98 0.09 −0.63
Procrastination - Active 1135 1 7 4.48 1.10 −0.05 −0.18
Procrastination - Passive 1134 1 7 3.58 1.22 0.10 0.25
Valid N (listwise) 1113
Note: SWL = satisfaction with life (1 item); RSES = Rosenberg Self-esteem Scale; MLQ = Meaning in Life Questionnaire; TP = time perspective
Table 2 Bivariate associations of the psychological characteristics
2 3 4 5 6 7 8 9 10 11 12 13 14
1 SWL .380** .319** −.113** −.304** .173** −.147** .068* .206** .397** .278** −.151** .077** −.208**
2 RSES .451** −.212** −.432** .137** −.252** .085** .259** .379** .501** −.426** .271** −.420**
3 MLQ-Presence −.159** −.212** .129** −.188** .084** .324** .286** .365** −.224** .067* −.311**
4 MLQ-Search .214** .200** .120** .193** .001 −.011 −.032 .177** −.181** .204**
5 Past negative TP −.026 .200** .048 −.149** −.354** −.265** .299** −.177** .277**
6 Past positive TP .066* .502** .061* .305** .121** .053 −.115** .067*
7 Present fatalistic TP .108** −.121** −.134** −.234** .233** −.200** .254**
8 Present hedonistic TP −.001 .103** .121** .001 −.058 .058
9 Future TP .244** .449** −.116** .100** −.536**
10 Social support .306** −.098** .115** −.223**
11 Academic self-efficacy −.371** .267** −.481**
12 Test anxiety −.418** .440**
13 Procrastination - Active −.511**
14 Procrastination - Passive
SWL = satisfaction with life (1 item); RSES = Rosenberg Self-esteem Scale; MLQ = Meaning in Life Questionnaire; TP = time perspective.
of cluster index (preferable <1.0). Indices of cluster solutions are shown in Appendix Table6.
The number of clusters used in the subsequent analysis was determined by evaluating the adequacy indices, while also considering the possible interpretations of the clusters and aiming at balanced sample sizes. The five-cluster solution was the first to have adequate fit measures, as the Xie-Beni index indicated the local maximum. The seven-, and nine- cluster solutions proved to be excessively complex while of- fering only a slight novelty compared to other solutions.
Consequently, the five-cluster solution was used in the subse- quent analysis. After determining the number of clusters, we performed a relocation process which increased the explained variance from 48.89% to 55.03% while it also improved the other fit indices (Appendix2). Finally, the individual cases were assigned to the clusters for further analysis.
Interpretation of the Clusters
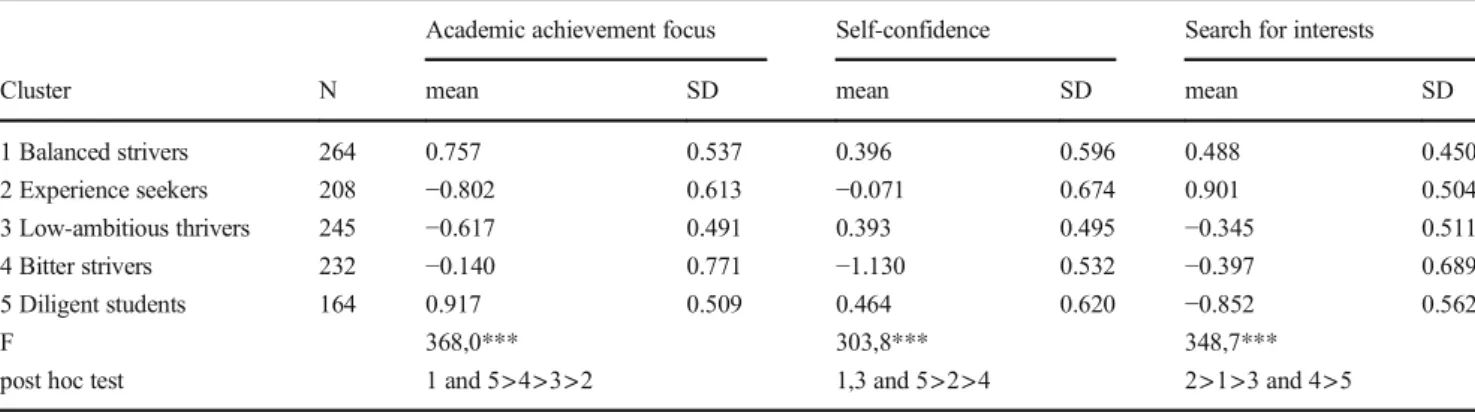
Clusters were compared using One-way Analysis of Variance to determine whether there are significant differences between them according to the resource dimensions. The analysis re- vealed significant differences in the mean scores which con- firmed that the clusters have distinct profiles and represent valid subgroups of respondents. The characteristics of each cluster are presented in Table3. Furthermore, we also com- puted graphs to make the meaning of the clusters more com- prehensible (see Fig.1).
Close inspection of the profiles provided the following in- terpretation of the student subgroups:
Cluster 1 is the biggest subgroup in the sample (N= 264) and can be characterized by high scores in all dimensions (high achievement focus, self-confidence and search orienta- tion); we may label this group as‘Balanced strivers’as they maintain a balance—presumably successfully, and as far as we are concerned, this relates to their high self-confidence—
between academic achievement and the search for new inter- ests and experiences.
Cluster 5 (N= 164) shows a partly similar pattern, but com- pared to Cluster 1, this subgroup shows the lowest search orientation in the sample. They may be labeled as‘Diligent students’, exhibiting good resources for high academic achievement without much interest in potentially distracting, alternative interests.
In contrast, Cluster 2 (N= 208) shows an opposite pattern.
While self-confidence is moderate (although lower than in Clusters 1, 3 and 5), achievement focus is definitely low, while the search for interests is extremely high. They may be labeled as‘Experience seekers’whose main concerns lie beyond formal academic achievement—where they presum- ably find little satisfaction and success.
Similarly, Cluster 3 (N= 245) is low in achievement focus, however, they have high self-confidence and only a low to
moderate interest in finding stimulation. They may be labeled as‘Low-ambitious thrivers’who are contented and satisfied without explicitly striving for academic success.
Finally, Cluster 4 (N= 232) is similar to Cluster 3 in their low to moderate search for interests, however, their distinctive characteristic is very low self-confidence, along with a mod- erate achievement focus. These students form the group of the
‘Bitter strivers’, whose primary focus is on achievement; how- ever, they may eventually become overwhelmed by doubts about their general self-worth and low emotional well-being.
During the further analyses, we will present the clusters according to these labels. Beyond their individual description and labeling, we can also note that two pairs of clusters (clus- ters 2 and 5, as well as clusters 3 and 4) can be regarded as mirroring each other. This means that‘Diligent students’and
‘Experience seekers’have mutually exclusive characteristics and, similarly,‘Low-ambitious thrivers’and‘Bitter strivers’
can be characterized as each other’s counterparts.
Comparison of the Clusters in Academic Achievement
We performed ANCOVA analyses with the cluster member- ship as a grouping variable and gender and age as controls.
Furthermore, due to the fact that different faculties have dif- ferent ways of learning where the attainment of specific aca- demic outcomes may partly depend on the learning environ- ment, we also included faculty membership as a covariate to control for potential contextual effects on academic outcomes.
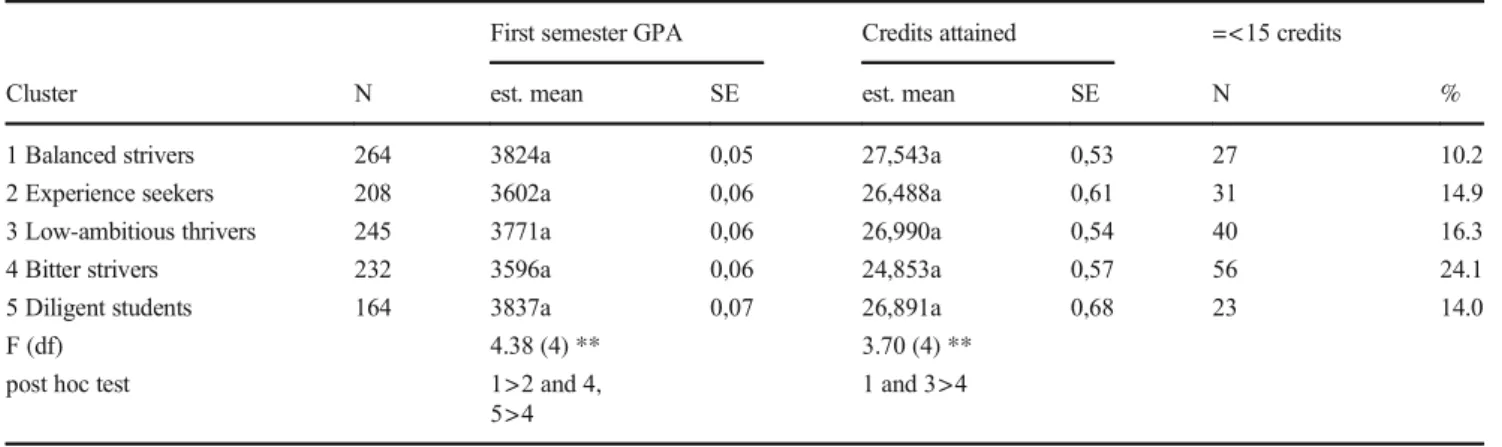
Moreover, in these analyses, we omitted the cases where the frequency of faculty affiliation was low in the sample (i.e., 17 or less). In total, 24 cases (2.2%) were omitted that belonged to three faculties. Outcome variables were first semester GPA and the number of attained credits. The estimated marginal means for the clusters are presented in Table4.
The model for first semester GPA was significant (F = 11.98 (13), p < .001, Partial eta 2 = .135). The main effect of cluster membership was also significant (F = 3.76 (4),p< .01, Partial eta 2 = .015), indicating that there were significant dif- ferences between the average GPA of the clusters. According to the post hoc test with Bonferroni adjustment, the estimated mean was higher in Cluster 1 (‘Balanced strivers’) than in Clusters 2 and 4 (‘Low-ambitious thrivers’ and ‘Bitter strivers’). Furthermore, Cluster 5 (‘Diligent students’) proved to have a higher average GPA than Cluster 4. When compar- ing the number of attained credits in the first semester, the pattern was similar. The model was significant (F = 7.44 (13), p< .001, Partial eta 2 = .088) and cluster membership had a significant main effect on the outcome measure (F = 3.63 (4), p < .01, Partial eta 2 = .014) after controlling for gen- der, age, and faculty membership. At the subgroup level, Cluster 4 (‘Bitter strivers’) had the lowest estimated marginal mean of attained credits and the difference was significant
between this student group and Clusters 1 and 3 (‘Balanced strivers’and‘Low-ambitious thrivers’) in the post hoc test.
In addition to the latter analysis, we also performed a lo- gistic regression analysis to test whether cluster membership predicts the risk of low credit attainment. The outcome vari- able was the dummy coded number of attained credits (0 = <
15, 1 > 15 credits, respectively) while predictors were gender, age, and faculty. Again, we omitted the cases of faculties with low frequency from the sample. We also omitted a further faculty (N= 53, 4.8%) since there were no students with low credit attainment in this subgroup and the model became un- stable when we tried to use these cases. Above gender, age, and faculty membership, cluster membership explained a sig- nificant amount of variance (Cox & Snell R Square = .013, Nagelkerke R Square = .021, Chi2(4) = 13,66,p= .008) while the whole model was also significant (Cox & Snell R Square = .068, Nagelkerke R Square = .112, Chi2(13) = 71,09, p < .001). Concerning the individual clusters, Cluster 4 (‘Bitter strivers’) was the only significant negative predictor (B =−0.909, OR = 0.403, 95% CI = 0.240–0.678, p= .001;
reference category: Cluster 1), meaning that, compared to oth- er clusters, ‘Bitter strivers’ showed a lower probability of attaining at least 18 credits in their first semester.
Discussion
Predicting prospective academic achievements and study dropouts is increasingly important in higher education (Bennett,2003; Quinn,2013; Winne & Nesbit,2010). In a sample of first-year Hungarian students, we explored how we can identify subgroups of students, based on their study- related and personal characteristics at the start of their studies (i.e., the start of their first semester in their major).
Furthermore, we also explored how specific subgroups of stu- dents performed in their studies at the end of the first semester.
The general aim of this procedure was to identify potential characteristics and, especially, combinations of characteristics that may be the target of future prevention programs.
Table 3 Comparisons of the clusters on the initial factor scores of the psychological resources
Academic achievement focus Self-confidence Search for interests
Cluster N mean SD mean SD mean SD
1 Balanced strivers 264 0.757 0.537 0.396 0.596 0.488 0.450
2 Experience seekers 208 −0.802 0.613 −0.071 0.674 0.901 0.504
3 Low-ambitious thrivers 245 −0.617 0.491 0.393 0.495 −0.345 0.511
4 Bitter strivers 232 −0.140 0.771 −1.130 0.532 −0.397 0.689
5 Diligent students 164 0.917 0.509 0.464 0.620 −0.852 0.562
F 368,0*** 303,8*** 348,7***
post hoc test 1 and 5>4>3>2 1,3 and 5>2>4 2>1>3 and 4>5
Note: subgroup comparisons of means are based on Bonferroni post hoc tests usingp= .05 threshold
-1.5 -1 -0.5 0 0.5 1 1.5
1 2 3 4 5
Achievement Self-confidence Search Fig. 1 Cluster profiles of the
personal resources
Factors of Resources
The factor of‘academic achievement focus’explained the greatest proportion of variance and, obviously, this factor is more salient in relation to the studies themselves. It included aspects of an efficient and purposeful learning attitude, includ- ing high self-efficacy, low study-related anxiety, and destruc- tive procrastination, as well as an ability to delay gratification as represented by future time perspective (Chapell et al.,2005;
Corkin et al.,2011; de Bilde et al.,2011; Kennett et al.,2020;
Olivier et al.,2019).
The second factor, that we labeled as‘Self-confidence’, accounted for almost the same proportion of variance as the first factor. The second factor represents a more general as- sembly of personal resources that may be important for a successful and balanced life. Self-worth and well-being (sat- isfaction and meaningfulness) are connected to the inner har- mony of the person while low‘past negative’time perspective and high social support provide interpersonal security. Taken together, these characteristics may contribute to the emotional and cognitive stability of the person, and thus, they may pro- vide a secure background to meet the eventual challenges of studying (c.f., Backmann et al.,2019).
Finally, we found a third factor that depicted charac- teristics connected to interest seeking and search for meaning in life. This kind of quest orientation may be normative in emerging adulthood when higher education studies and extensive self-exploration run parallel (Boardman, 2017). They can sometimes seem like con- tradictory tasks to accomplish in life. While normal and even necessary for the balanced development of identi- ty, quest and search are often connected to a certain degree of insecurity (James et al., 2020). Therefore, the connection between these kinds of personal re- sources and academic success can be ambivalent.
It is important to note that, as a basic assumption, we an- ticipated that these factors relating to personal resources form an integrated system in the lives of the freshmen and do not appear independently during studies. Therefore, we further explored the student subgroups that can be regarded as typical combinations of these resources.
Student Subgroups
Based on the three dimensions of‘Academic achievement fo- cus’,‘Self-confidence’, and‘Search for interests’we identified five student subgroups that could be characterized by the unique and typical combinations of these resources. The five subgroups were tentatively labeled as‘Balanced strivers’(Cluster 1: high achievement focus, self-confidence, and search orientation),
‘Experience seekers’(Cluster 2: low achievement with medium self-confidence and extremely high search for interests),‘Low- ambitious thrivers’(Cluster 3: low in achievement focus, high self-confidence, and only low to moderate interest in finding stimulation),‘Bitter strivers’(Cluster 4: low to moderate search for interests, very low self-confidence, along with a moderate achievement focus), and‘Diligent students’(Cluster 5: high achievement focus and self-confidence along with low search orientation). These clusters can be regarded as typical student positions at the start of higher education and represent trends in individual profiles that freshmen can rely on during their studies (De Clercq et al.,2017).
One interesting result is that we have not found any robust subgroup that would have exhibited a low profile on every resource dimension. All subgroups could be characterized with at least a medium level of one or more resources.
While group-based and individual profiles may differ (i.e., specific students may have provided low profile responses to the questionnaire), this also means that the majority of freshmen in this assessment had a set of valuable resources.
Table 4 Comparisons of the clusters in academic achievements
First semester GPA Credits attained =<15 credits
Cluster N est. mean SE est. mean SE N %
1 Balanced strivers 264 3824a 0,05 27,543a 0,53 27 10.2
2 Experience seekers 208 3602a 0,06 26,488a 0,61 31 14.9
3 Low-ambitious thrivers 245 3771a 0,06 26,990a 0,54 40 16.3
4 Bitter strivers 232 3596a 0,06 24,853a 0,57 56 24.1
5 Diligent students 164 3837a 0,07 26,891a 0,68 23 14.0
F (df) 4.38 (4) ** 3.70 (4) **
post hoc test 1>2 and 4,
5>4
1 and 3>4
Estimated marginal means are from ANCOVA analyses, controlled for gender, age, and faculty.
Subgroup comparisons of means are based on Bonferroni post hoc tests using p = .05 threshold.
**p< .01.
Further developments may be built on the predominant re- sources along with making improvements to other resources.
One advantage of a pattern-oriented approach is that we can explore the real-life configurations of the resources and how to find interactions and non-linear associations between them (Asendorpf,2015; Bergman et al.,2003). The final rea- son for doing this was to find out how these specific config- urations worked in relation to the challenges of the first se- mester. As a result, we compared the subgroups according to their academic achievements in the first semester.
Academic Achievement in the Subgroups
We referred to two indices of academic achievements in the first semester, GPA and the number of attained credits. Both indica- tors are relatively objective and comparable within and between students and groups of students. Moreover, both indicators may provide important feedback for the students themselves about their future chances of finishing their chosen major and of attaining a high-quality professional training and degree. When we compared the typical subgroups according to these dimen- sions, we also adjusted the results for potential confounding fac- tors like gender, age, and faculty of the major. Below, we refer to the adjusted average values of the subgroups.
The first lesson learned from the results is that there may be several ways of being successful at the start of one’s studies.
While‘Balanced strivers’ and ‘Diligent students’ clearly outperformed ‘Experience seekers’, and in the case of
‘Diligent students’, also ‘Bitter strivers’in faculty adjusted GPA, even the average GPA of ‘Low-ambitious thrivers’
was closer to the higher level. A common characteristic of the three higher performing subgroups (‘Balanced strivers’,
‘Diligent students’, and‘Low-ambitious thrivers’) is their rel- atively high level of self-confidence, regardless of their level of focus on their academic achievement.
When we scrutinized the number of attained credits, a partly different picture emerged.‘Balanced strivers’and‘Low-ambi- tious thrivers’were the most successful in attaining the most credits during the semester, while‘Bitter strivers’attained signif- icantly less credits. This result points to the potential vulnerability of this latter subgroup in terms of dropout. This interpretation is further confirmed by the results of the logistic regression analy- sis. When we used the attainment of 18 or less credits as an indicator, the only subgroup that significantly predicted this out- come was the cluster membership in‘Bitter strivers’. This may mean that students in this subgroup are disproportionately prone to having an increased risk of low credit attainment, and thus, the risk of later dropout. This may contradict the fact that they had at least a moderate level of achievement focus, higher than other subgroups that were still more successful in their studies. The specific vulnerability of the‘Bitter strivers’may lay in their rel- atively low level of self-confidence, which was the lowest among the subgroups.
On the contrary, ‘Experience seekers’, whose academic interest is relatively low, seem to be better at managing aca- demic challenges in a practical way. Although they exhibited an average GPA, they were as successful in attaining the nec- essary amount of credits and avoiding the “too few credit”
pitfall as the other three subgroups with a higher GPA. We can hypothesize that‘Experience seekers’use their years in higher education as a journey of conscious self-exploration where the attainment of new interests and life experiences may seem as important—or even more important—than the highest academic success.
Initial Assumptions and Subgroup Achievements
The comparison of student subgroups provided support to our initial, general hypotheses as well. ‘Balanced strivers’ and
‘Diligent students’showed higher achievement orientation and self-confidence and also exhibited higher achievement at the end of the semester, thus confirming H1, and H2. Contrary to some of the assumptions, however, student subgroups with low-moderate achievement focus were also relatively success- ful in their academic strivings, presumably based on their high self-confidence, which again highlights the importance of per- sonal resources as partially indicated in H1. The inverse of the same pattern can be found in the relative risk of ‘Bitter strivers’where low self-confidence can hamper the positive effects of academic orientation (H1 partially confirmed but H2 not). Finally, results are mixed with regard to H3 since a h i g h e r le v e l o f s e a r c h o r i e n t a ti o n c o u l d b e we l l counterbalanced in‘Balanced strivers’and was only moder- ately risky in‘Experience seekers’. In sum, our results support the general notion of pattern-oriented approach that holds that the effects of complex configurations cannot be entirely de- rived from linear associations of the individual characteristics (Bergman et al.,2003; Howard & Hoffman,2018).
Limitations of the Study
Our study has certain limitations that need to be considered when interpreting the results. First, the assessment of the per- sonal and study resources was self-administered and cross- sectional. We had no information about their potential devel- opment during the first semester. Second, we focused on the entrance assessment and the outcome and we could not ex- plore the specific processes regarding how students used their academic and psychological resources during their first se- mester. Third, in later studies, inclusion of further academic and personal resources should be considered. For example, constructs of academic motivation (e.g., goal orientation, per- sonality traits) could broaden the scope of the investigation and may provide valuable insights into the dynamics of cop- ing with academic challenges. Moreover, students voluntarily participated in the study, which means that we do not have
data about those who are less motivated. This can explain the lack of low-resource subgroups in the sample. Finally, we concentrated only on the outcomes of the first semester.
Therefore, following up the academic career of the respon- dents in later studies may further validate the conclusions.
Conclusions and implications for the practiceAs a result of our study, we can see that academic success and, in a similar way, diminishing efficacy may have multiple pathways. A vulnerable group’s main characteristics cannot be identified in the absence of just one specific resource. Instead, combi- nations of missing or less developed resources may predict an elevated risk of later academic failure (Keefer et al.,2012;
Olivera-Aguilar et al.,2017). These characteristic group-level combinations may have practical implications as well.
Although the pattern-oriented approach used to create student profiles is not appropriate to apply at the individual level, it enables identifying actual groups of students who are poten- tially at risk at the start of their university years. As Keefer et al. (2012, p. 411) argue:“Knowledge of these nuanced interactions can be quite valuable for designing client- centered interventions aimed at neutralizing personal vulner- abilities by honing complementary skill sets.”
In sum, identifying the vulnerable profiles may help in the early identification of vulnerable subgroups of students, and, on the basis of personal profiles, individually tailored inter- ventions may be suggested and provided (Wilson & Buttrick, 2016). Based on the student profiles, it is possible to plan
specific training programs to enhance the necessary psycho- logical resources. Setting up training groups consisting of stu- dents who have comparable strengths and weaknesses may offer the students an opportunity to meet peers who face sim- ilar difficulties, fostering social support. Moreover, it is pos- sible to offer personalized training programs with more flex- ible planning and increased efficiency in such homogenous groups. These measures can be implemented by applying a thorough entrance assessment and a careful analysis of the profiles of personal resources, as presented in our study.
We focused on a vulnerable period in emerging adulthood, the transition from high school to university, and applied a psychological resource approach understanding how students may navigate successfully through the transition process.
While multiple patterns of general and study-related psycho- logical resources may support a secure pathway during the process, the results also indicate that there is still room for supportive systemic interventions. Eventually,‘college years’
do not mean an abstract landscape to conquer (or fail within) but rather a‘niche’: a living system that the students constant- ly construct while it provides feedback to them. In this regard, effective and complex monitoring and development of the freshmen’s psychological resources may mean systemic sup- portive feedback. Future studies need to address how these programs can be best implemented.
Appendix 1
Table 5 Factor solution for the psychological resources
Factor
1 2 3
Procrastination - Passive −.870 −.170 .116
Academic self-efficacy .588 .367 .146
Future TP .506 .175 .145
Procrastination - Active .488 .103 −.235
Test anxiety −.463 −.274 .207
Present fatalistic TP −.253 −.243 .181
RSES .406 .654 −.019
Past negative TP −.174 −.557 .168
Social support .154 .556 .216
SWL .121 .554 .085
MLQ-Presence .303 .452 .076
Past positive TP −.052 .256 .695
Present hedonistic TP .005 .085 .559
MLQ-Search −.088 −.241 .402
Eigenvalue after rotation 2.21 2.03 1.23
Explained variance 15.80 14.49 8.80
Note: Principal axis factoring with Varimax rotation
SWL = satisfaction with life (1 item); RSES = Rosenberg Self-esteem Scale; MLQ = Meaning in Life Questionnaire; TP = time perspective
Appendix 2
Code Availability Not applicable.
Authors’Contributions All authors contributed to the study conception, design, material preparation, and data collection management. Data anal- ysis was performed by TM and BJ. The first draft of the manuscript was written by TM and all authors contributed to the final version of the manuscript. All authors read and approved the final manuscript.
Funding Open access funding provided by University of Szeged. The study was funded by the European Union / Ministry of Human Capacities Hungary (EFOP-3.4.3–16-2016- 00014 project).
Data Availability The datasets analysed during the current study are available from the corresponding author on reasonable request.
Declarations
Ethics Approval Research ethics approval was obtained from the Unified Ethics Committee for Psychological Researches (EPKEB) under the Nr. 2017/131, and is in accordance with the Declaration of Helsinki.
Consent to Participate Informed consent was obtained from all partic- ipants included in the study.
Consent for Publication Not applicable.
Conflict of Interest The authors state that there are no conflicts of interest.
Open Access This article is licensed under a Creative Commons Attribution 4.0 International License, which permits use, sharing, adap- tation, distribution and reproduction in any medium or format, as long as you give appropriate credit to the original author(s) and the source, pro- vide a link to the Creative Commons licence, and indicate if changes were made. The images or other third party material in this article are included in the article's Creative Commons licence, unless indicated otherwise in a credit line to the material. If material is not included in the article's
Creative Commons licence and your intended use is not permitted by statutory regulation or exceeds the permitted use, you will need to obtain permission directly from the copyright holder. To view a copy of this licence, visithttp://creativecommons.org/licenses/by/4.0/.
References
Asendorpf, J. B. (2015). Person-centered approaches to personality. InAPA handbook of personality and social psychology, volume 4: Personality processes and individual differences(pp. 403–424). American Psychological Association.https://doi.org/10.1037/14343-018.
Backmann, J., Weiss, M., Schippers, M. C., & Hoegl, M. (2019). Personality factors, student resiliency, and the moderating role of achievement values in study progress.Learning and Individual Differences, 72, 39–48.https://doi.org/10.1016/j.lindif.2019.04.004.
Bailey, T. H., & Phillips, L. J. (2016). The influence of motivation and adaptation on students’subjective well-being, meaning in life and aca- demic performance.Higher Education Research & Development, 35(2), 201–216.https://doi.org/10.1080/07294360.2015.1087474.
Bennett, R. (2003). Determinants of undergraduate student drop out rates in a university business studies department.Journal of Further and Higher Education, 27(2), 123–141.https://doi.org/10.1080/
030987703200065154.
Bergman, L. R., Magnusson, D., & El Khouri, B. M. (2003).Studying individual development in an interindividual context: A person- oriented approach. Psychology Press.
Boardman, L. (2017). An experiential exploration of identity during emerging adulthood: The impact of growth experiences on emerging adulthood characteristics. In J. D. Sinnott (Ed.),Identity flexibility during adult- hood: Perspectives in adult development(pp. 71–81). Springer International Publishing.https://doi.org/10.1007/978-3-319-55658-1_4.
Boerchi, D., Magnano, P., & Lodi, E. (2018). Development and prelim- inary validation of the college competencies scale.Current Psychology, 40(1), 172–187.https://doi.org/10.1007/s12144-018- 9910-y.
Booth, M. Z., & Gerard, J. M. (2011). Self-esteem and academic achieve- ment: A comparative study of adolescent students in England and the United States.Compare: A Journal of Comparative and Table 6 Adequacy indices of the hierarchical cluster analysis in the 3 to 10 cluster solutions
Step N EESS% Point biserial Xie-Beni (mod) Silhouette HC mean
i=1103 10 66.45 0.283 0.235 0.436 0.677
i=1104 9 64.37 0.297 0.631 0.435 0.718
i=1105 8 61.90 0.293 0.224 0.430 0.767
i=1106 7 58.73 0.319 0.594 0.427 0.830
i=1107 6 54.85 0.316 0.487 0.437 0.907
i=1108 5 48.89 0.298 0.580 0.433 1.026
i=1109 4 40.93 0.279 0.312 0.398 1.185
i=1110 3 32.66 0.273 0.129 0.411 1.349
i=1111 2 21.31 0.234 0.105 0.503 1.575
Relocation 5 55.03 0.325 0.493 0.541 0.903
Notes:N = number of clusters; EESS % = Explained Error Sum of Squares; Point biserial = Point biserial correlation; Xie-Beni (mod) = modified Xie- Beni index; HC mean = average cluster homogeneity