Determinants of pharmaceutical innovation diffusion: social
contagion and prescribing characteristics
by Ágnes Lublóy,
Judit Lilla Keresztúri, Gábor Benedek
C O R VI N U S E C O N O M IC S W O R K IN G P A PE R S
CEWP 17 /2014
Determinants of pharmaceutical innovation diffusion: social contagion and prescribing characteristics
Ágnes Lublóy1
Department of Finance, Corvinus University of Budapest Email: agnes.lubloy@uni-corvinus.hu,
Judit Lilla Keresztúri
Department of Finance, Corvinus University of Budapest Email: lilla.kereszturi@uni-corvinus.hu and
Gábor Benedek
Department of Mathematical Economics and Economic Analyses, Corvinus University of Budapest and Thesys SEA Pte Ltd.
Email: gabor.benedek@thesys.hu June 25, 2014.
Abstract
This article studies the determinants of pharmaceutical innovation diffusion among specialists. To this end, it investigates the influences of six categories of factors—social embeddedness, socio-demography, scientific orientation, prescribing patterns, practice characteristics, and patient panel composition—on the use of new drugs for the treatment of type 2 diabetes mellitus in Hungary. Here, in line with international trends, 11 brands were introduced between April 2008 and April 2010, outperforming all other therapeutic classes.
The Cox proportional hazards model identifies three determinants—social contagion (in the social embeddedness category) and prescribing portfolio and insulin prescribing ratio (in the prescribing pattern category). First, social contagion has a positive effect among geographically close colleagues—the higher the adoption ratio, the higher the likelihood of early adoption—but no influence among former classmates and scientific collaborators.
Second, the wider the prescribing portfolio, the earlier the new drug uptake. Third, the lower the insulin prescribing ratio, the earlier the new drug uptake—physicians’ therapeutic convictions and patients’ socioeconomic statuses act as underlying influencers. However, this finding does not extend to opinion-leading physicians such as scientific leaders and hospital department and outpatient center managers. This article concludes by arguing that healthcare policy strategists and pharmaceutical companies may rely exclusively on practice location and prescription data to perfect interventions and optimize budgets.
JEL code: C14, I19, O33
Keywords: Cox proportional hazards model, diffusion, pharmaceutical innovations, prescribing characteristics, social contagion
1 The authors are grateful to Judit Géczi and Tamás Prajczer at GeoX Ltd (http://www.geoindex.hu), for providing the patient income data free of charge, and to AXA Research Fund, for awarding Ágnes Lublóy the post-doctoral research grant that enabled this research.
1. Introduction
Innovation and the successful diffusion of new drugs are critical for the financial performance of pharmaceutical companies—as well as the health of patients. At macro level, governments are also major influencers, both through regulatory and approval agencies and through budgetary allocations. The diffusion of innovation is thus determined by the strategies of pharmaceutical companies, government policies, as well as the behavior of medical professionals. This article concentrates on the last, through investigating the determinants of prescribing new drugs by specialists (SPs).
Understanding the mechanisms leading to prescribers’ early adoption of new drugs is important for several reasons (Lublóy 2014). First, it accelerates diffusion. Although companies are increasingly innovative and efficient in producing new drugs, the implementation of pharmaceutical innovations is often delayed (Berwick 2003). Where new drugs expand therapeutics in areas of yet unmet clinical need, accelerated adoption benefits both medicine and society, through fast and homogeneous availability. Second, it promotes cost-efficiency. Healthcare systems worldwide operate with limited financial resources. When the same pharmacological therapy is available as different brands at different prices, prescribers need to select the new, more expensive brand on medical grounds rather than socioeconomic considerations—such as wealthy or demanding patients, for example (Ohlsson et al. 2009). Third, it forecasts utilization. Accurate prediction is important not only for pharmaceutical companies, but also for healthcare professionals and policy makers in charge of healthcare budget planning. Fourth, it develops targeted detailing and continuing medical education. Distinguishing between doctors who prescribe new drugs early and those who prescribe them late or never enables targeted pharmaceutical company intervention, through relevant, tailored information; economies of both time and money; and appropriate use of new drugs, through prescription of the most efficient/least expensive alternatives.
Doctors have to strike a balance between using new drugs, potentially exposing patients to side effects, and delaying their use, depriving patients of possible benefits. The ensuing diffusion process is complex—although doctors consider new drugs on individual merits, some may be more predisposed to adopt than others. Several factors are significantly positively associated with early adoption of new drugs (Lublóy 2014): (1) physicians’ interest in particular therapeutic areas, participation in clinical trials, and prescribing volume, either in total or within the therapeutic class of the new drug (for example, Coleman et al. 1966; Glass
& Rosenthal 2004; Lin et al. 2011; Liu & Gupta 2012); (2) pharmaceutical companies’
marketing efforts (for example, Kremer et al. 2008; Manchanda et al. 2008, Iyengar et al.
2011; Liu & Gupta 2012); (3) social interactions among colleagues, with pharmaceutical sales representatives, and with patients (for example, Coleman et al. 1966; Manchanda et al. 2008;
Iyengar et al. 2011; Lin et al. 2011; Liu & Gupta 2012)—colleagues are indispensable to gaining knowledge and reduce uncertainty about the consequences of new drug adoption (Peay & Peay 1994; McGettigan et al. 2001; Prosser & Walley 2006); and (4) physicians with younger patients, patients with higher socioeconomic statuses, and/or patients with poorer health statuses (for example, Mark et al. 2002; Greving et al. 2006; Ohlsson et al. 2009; Liu et al. 2011). Some (5) socio-demographic factors and (6) practice-related factors also play important—albeit lesser—roles in the diffusion process.
This article acknowledges the variety of variables likely to influence new drug uptake—and the likely prominent role of social interactions—and sets to answer two research questions.
First, do social interactions with former classmates, scientific collaborators, and geographically close colleagues influence the likelihood of adoption equally? Second, which prescribing characteristics predict new drug uptake consistently across various drugs from the same therapeutic class? Predicting physicians’ prescribing behaviour is a complex, multifactoral exercise. However, patients, physicians, policymakers, and pharmaceutical companies would all benefit from understanding the influencing factors and their interactions.
The large-scale model suggested here would particularly benefit healthcare policy strategists—with perfecting their interventions—and pharmaceutical companies—with optimizing their marketing budgets.
This article contributes to the literature in two ways. First, by investigating the presence of social contagion (also known as interpersonal network effect, word-of-mouth effect, or peer influence), where individual adoption behaviors regarding a new drug are affected by exposure to others’ knowledge, attitudes, or behaviors in relation to that drug. In particular, this article assesses the impacts of three types of social interaction—with former classmates, with scientific collaborators, and with geographically close colleagues. To the authors’
knowledge, the influences of the first two social networks on new drug diffusion have never been analyzed in the pharmaceutical literature before, whereas a contagion measure aggregating the adoption behaviors of geographically close colleagues for each physician was used in only two recent studies (Manchanda et al. 2008; Liu & Gupta 2012). However, anecdotal evidence shows that physicians regularly exchange ideas with former classmates (Bajaj 2012; Wong 2014), whereas the influential role of scientific collaborators was proved in many other domains (Glänzel & Schubert 2005; Liu et al. 2005; Acedo et al. 2006; Huesch 2011). This article is therefore a pioneering attempt at documenting influences from such social interactions on new drug diffusion.
Second, by investigating a wide range of potential additional determinants. To the authors’
knowledge, potential additional determinants of new drug uptake have not survived prior rigorous analysis: no other study has ever analyzed such a variety of variables, or indeed included so many new drugs from the same therapeutic class (for example, Coleman et al.
1966; Greving et al. 2006; Iyengar et al. 2011; Lin et al. 2011; Bourke & Roper 2012). This article considers the influences of five ‘classical’ categories of factors—physicians’ socio- demographies, scientific orientations, and prescribing patterns, as well as practice characteristics and patient-related factors. The total of 22 factors serves to identify determinants—variables consistently predicting new drug diffusion—for the 11 drugs recently introduced in one therapeutic class. Pharmaceutical companies and healthcare policy strategists alike could accelerate new drug diffusion by focusing on the most influential categories of factors—identified here through the rigorous evidence of prescription data rather than the survey and mail questionnaire approach of most prior research (Chauhan & Mason 2008; Mason 2008). Exempt from recall and social desirability biases, prescription data reflect prescribing realities—including the personal and behavioral traits of prescribing physicians as well as the influences associated with marketing activities, evidence bases, peer pressures, and regulatory environments.
Following this introduction, section 2 presents the key characteristics of the study drugs and the data sources used, discusses the statistical model, and specifies the independent variables.
Section 3 presents the results, which are then discussed in section 4, alongside policy implications. Section 5 analyzes several possible research limitations. Finally, section 6 summarizes the research findings.
2. Methods 2.1. Study drugs
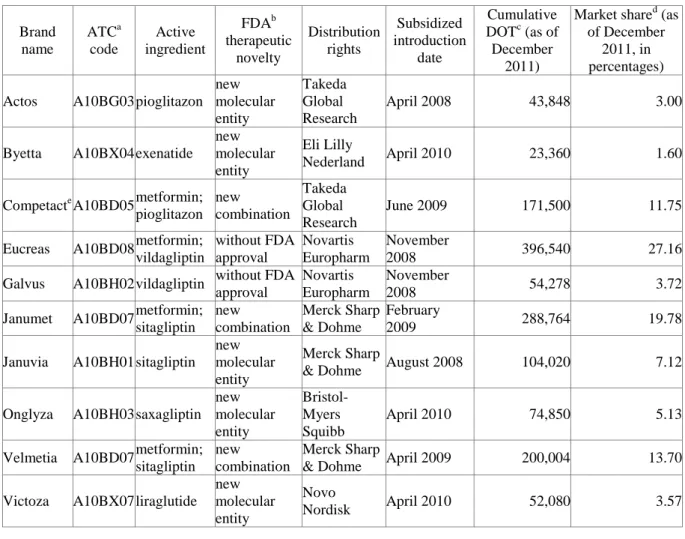
This article focuses on new anti-diabetic drugs (A10Bs2) for the treatment of type 2 diabetes mellitus (T2DM) in Hungary for four reasons. First, pharmaceutical companies are keen to develop such drugs, due to increasingly high potential market—347 million people worldwide suffer from diabetes (Danaei et al. 2011), projected to become the seventh cause of death in 2030 (WHO 2011). In Hungary alone, 11 brands were introduced in a subsidized form between April 2008 and April 2010, outperforming all other therapeutic classes—the Hungarian National Health Insurance Fund (NHIF) recognized both the urgent therapeutic need and the new drugs’ therapeutic efficacy (for main data, see Table 1; for supplementary data, see online Appendix). When added to metformin, the default treatment for T2DM, all 11 A10Bs reduce the HbAc1 level—with close to equal efficiencies, and despite distinct modes of action.
Table 1: New anti-diabetic drugs introduced in Hungary between April 2008 and April 2010:
main data
Brand name
ATCa code
Active ingredient
FDAb therapeutic
novelty
Distribution rights
Subsidized introduction
date
Cumulative DOTc (as of December
2011)
Market shared (as of December
2011, in percentages) Actos A10BG03 pioglitazon
new molecular entity
Takeda Global Research
April 2008 43,848 3.00
Byetta A10BX04 exenatide new molecular entity
Eli Lilly
Nederland April 2010 23,360 1.60
Competacte A10BD05 metformin;
pioglitazon new combination
Takeda Global Research
June 2009 171,500 11.75
Eucreas A10BD08 metformin;
vildagliptin
without FDA approval
Novartis Europharm
November
2008 396,540 27.16
Galvus A10BH02 vildagliptin without FDA approval
Novartis Europharm
November
2008 54,278 3.72
Janumet A10BD07 metformin;
sitagliptin new combination
Merck Sharp
& Dohme
February
2009 288,764 19.78
Januvia A10BH01 sitagliptin new molecular entity
Merck Sharp
& Dohme August 2008 104,020 7.12 Onglyza A10BH03 saxagliptin
new molecular entity
Bristol- Myers Squibb
April 2010 74,850 5.13
Velmetia A10BD07 metformin;
sitagliptin new combination
Merck Sharp
& Dohme April 2009 200,004 13.70 Victoza A10BX07 liraglutide
new molecular entity
Novo
Nordisk April 2010 52,080 3.57
2 The World Health Organization (WHO) Anatomical Therapeutic Chemical (ATC) classification for blood glucose (HbAc1) lowering drugs other than insulin, based on the organs/systems on which drugs act and/or the therapeutic and chemical characteristics of the drugs.
Xelevia A10BH01 sitagliptin new molecular entity
Merck Sharp
& Dohme April 2009 50,834 3.48
a Anatomical Therapeutic Chemical.
b Food and Drug Administration.
c Days of therapy.
d Relative to the other new A10Bs.
e Actoplus Met, in the US.
Second, all 11 study drugs are first-in-class, with new ATC codes and—with two exceptions—Food and Drug Administration approval, either as new molecular entities (the highest of ten levels of drug novelty) or as new combinations.
Third, prescribing A10Bs in a subsidized form involves considerable medical complexity and a well-defined group of SPs, mostly internists subspecialized in endocrinology—a fairly
‘closed’ community, suitable for the purpose of this article.
Fourth, the care of T2DM patients is shared between general practitioners (GPs) and SPs, allowing for the examination of routine—as opposed to just first-time—adoption of new A10Bs. Adoption becomes routine when SPs first ask referring GPs to prescribe new A10Bs, on grounds of efficacy and efficiency. Intuitively, any such drugs are already part of the SPs’
prescribing portfolios, following first-time adoption and follow-up tests.
2.2. Data sources
For covariates, this article uses two main and five additional databases (see the third columns in Tables 2 and 3).
One of the two main databases is managed by DoktorInfo Ltd and covers prescription information between April 2008 and December 2011. All GPs in Hungary are required by law to collect data for NHIF. Of these, 899 (22 per cent) also feed real-time prescription data into the DoktorInfo database voluntarily—they are representative of the entire Hungarian GP population in both age and location (defined by region and population size). This involves no additional work for GPs, who are compensated for providing information such as GP identification number; prescription date; prescribed drug characteristics (brand name, ATC code, and dosage); prescribed drug subsidy; patient characteristics (age and gender); and, since January 2009, for patients whose care is shared, identification number of the therapy- initiating SP. The latter enables monitoring the adoption behaviors and prescribing patterns of SPs who share care of T2DM patients.
The other is managed by the Office of Health Authorization and Administrative Procedures (OHAAP) and covers socio-demographic and practice-related variables as well as physician characteristics (see Table 3), which contribute to generating social embeddedness and scientific orientation metrics.
The five additional databases are GeoX, an integrated statistical database providing consolidated and structured spatial datasets for every NUTS3 level in Hungary; ComFit, a bibliographic database similar to PubMed and containing Hungarian medical articles; the
3 Nomenclature of Units for Territorial Statistics.
Hungarian Diabetes Association (HDA), with information on the scientific activities of qualified diabetologists (HDA board memberships, HDA award receiverships, editorships, and presentations at the HDA biennial congresses); the Hungarian Central Statistical Office (HCSO), with information on settlement sizes; and Google Maps, with information which allows the calculation of distances among SPs.
2.3. Statistical model
Similarly to many recent diffusion studies (for example, Korda et al. 2011, Lin et al. 2011), this article uses the Cox proportional hazards model (Cox 1972) to examine factors influencing the likelihoods of routine adoptions of A10Bs by SPs. The Cox model is the most appropriate choice for the purpose because of the way it handles right-censored data. That is, cases where SPs had not routinely adopted the A10Bs by the end of 2011 (time t), and where the hazard ratio/likelihood of routine adoption at time t for each SP is
h(t)=λ0exp(β1X1+β2X2+…+βkXk),
with λ0 the baseline hazard function, exp(βi) the ith hazard ratio, and Xi the ith independent variable (which can be time invariant or time varying during observation). For multiple highly correlated covariates (with coefficients higher than 0.65), only one variable from the set of intercorrelated variables is used.
The dependent variable is a dummy indicating each month whether the SP had routinely adopted the A10B.
2.4. Independent variables
This article considers social contagion and five categories of quantitatively measurable factors relevant to prescribing behavior. Tables 2 and 3 summarize the descriptive statistics for time- dependent covariates and respectively time-independent covariates—the 318 SPs in the sample share at least 20 patients with any of the 899 GPs in the DoktorInfo database. Lublóy (2014) documented the characteristics of early adopters and differentiated between variables consistently predicting new drug uptake and variables producing inconsistent results, providing guidance for the variables considered here and their expected signs.
Table 2: Contagion measures: definitions and descriptive statistics for 318 SPs
Social network Link Data source Number of
links
Network density (in percentages) former classmates graduating from the same medical
establishment in the same year OHAAP 330 0.65
scientific collaborators
coauthoring at least one article in 2009–13/co- preparing at least one HDA congress
presentation in 2006/2008
ComFit;
HDA 151 0.30
geographically close colleagues
practicing within 35 kilometers/22 miles of at least two other SPs
Google Maps;
OHAAP
4,856 9.63
Contagion measures assess whether the adoption decisions of colleagues significantly influence SPs’ likelihoods of routine adoption—they are time-dependent covariates, the percentage of adopting colleagues changing over time. To ensure causal relationships between explanatory and time-dependent covariates, the latter were lagged by one month.
Interactions—professional and social—appear to be a very important influencing factor, information relayed through direct, personal contacts proving particularly powerful.
Physicians’ adopting behaviors are affected by other physicians’ knowledge, attitudes, and behaviors, thus reducing safety and efficacy uncertainties. Interactions with opinion-leading physicians seem critical to fast, wide acceptance of medical innovations (Williamson 1975;
Peay & Peay 1994; McGettigan et al. 2001; Prosser & Walley 2006; Huesch 2011). While other sources of information provide the nurturing groundwork of necessary knowledge, behavioral change requires the legitimizing power of personal advice from informed and respected colleagues through reliable, easy-to-digest assessments of new drugs. Van den Bulte
& Lilien (2001) aside, studies found strong, convincing empirical evidence of social contagion in new drug adoption even after controlling for a wide variety of factors (Coleman et al. 1966; Manchanda et al. 2008; Iyengar et al. 2011; Lin et al. 2011; Liu & Gupta 2012)—
adding contagion measures to the model is inevitable and identifying proper social networks is crucial to constructing them. Four of the six studies asked SPs to list their collegial interactions (Coleman et al. 1966; Van den Bulte & Lilien 2001; Iyengar et al. 2011; Lin et al.
2011)—survey-based contagion measures capture interpersonal effects directly, but are time consuming and costly and suffer from bias, low response rate, and endogenous group formation (Liu & Gupta 2012). Well-established in the broader literature, geographic proximity is an alternative approach to defining social networks in pharmaceutical contexts (Manchanda et al. 2008; Liu & Gupta 2012), capturing interpersonal effects indirectly, but objectively and easily.
This article uses complementary data sources to construct three contagion measures which reflect distinct channels of interpersonal communication—with former classmates, with scientific collaborators, and with geographically close colleagues. Former classmates graduated from the same medical establishment in the same year (OHAAP), scientific collaborators either published an article (ComFit) or prepared a presentation (HDA) together, and geographically close colleagues had offices within a pre-specified radius (Google Maps).
Manchanda et al. (2008) argued that a radius of 20 miles is long enough to capture most of the interpersonal effects and short enough to allow social network differentiations. This article defines SPs’ spatial social networks through geographic circles with radiuses of 35 kilometers/22 miles centered on SPs’ practice locations, radius sensitivity double-checked by additional radiuses at ±20 per cent.
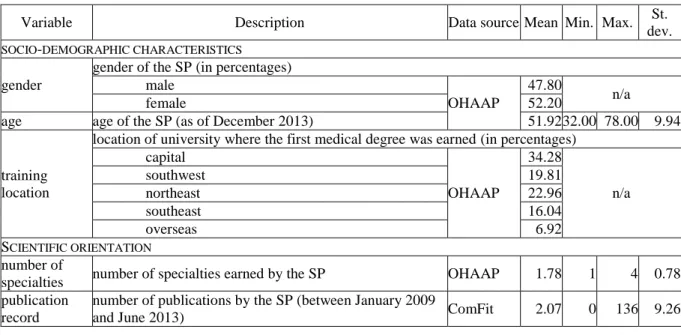
Table 3: Time-independent covariates: definitions and descriptive statistics for 318 SPs, with proportional and per patient values calculated over the two-year period 2010–11
Variable Description Data source Mean Min. Max. St.
dev.
SOCIO-DEMOGRAPHIC CHARACTERISTICS gender
gender of the SP (in percentages) male
OHAAP
47.80
female 52.20 n/a
age age of the SP (as of December 2013) 51.92 32.00 78.00 9.94
training location
location of university where the first medical degree was earned (in percentages) capital
OHAAP
34.28
n/a
southwest 19.81
northeast 22.96
southeast 16.04
overseas 6.92
SCIENTIFIC ORIENTATION number of
specialties number of specialties earned by the SP OHAAP 1.78 1 4 0.78 publication
record
number of publications by the SP (between January 2009
and June 2013) ComFit 2.07 0 136 9.26
position
position of the SP (in percentages)
high ((deputy) head of hospital department or outpatient centre)
OHAAP
22.30
medium (chief physician) 33.30 n/a
low (associate professor or physician) 44.30 scientific
commitment
dummy variable for HDA board membership, HDA award
receivership, or chief editorship HDA 0.04 0 1 n/a
PRESCRIBING CHARACTERISTICS prescribing
intensity mean number of prescription initiations per patient
DoktorInfo
12.71 4.63 30.93 3.72 portfolio width number of brands prescribed for patients in shared care 16.66 4 25 4.13 insulin ratio prescriptions initiating treatment with insulin (in
percentages) 79.10 0.00 100.00 20.84
old A10B ratio prescriptions initiating treatment with previously
introduced A10Bs (in percentages) 2.99 0.00 33.33 4.66
PATIENT CHARACTERISTICS
age age of patients on the SP’s patient panel
DoktorInfo 64.20 44.00 72.87 2.84 gender male patients on the SP’s patient panel (in percentages) 47.07 7.02 70.37 7.39
income
mean annual income of patients on the SP’s patient panel, proxied by either the mean street-level income (for large settlements, over 20 thousand inhabitants) or the zip code- level income (for small settlements, under 20 thousand inhabitants) (in EUR)
GeoX 3,103 1,267 5,040 597
health status patients with comorbidities on the SP’s patient panel (in
percentages) DoktorInfo 45.25 0.00 100.00 21.94
PRACTICE CHARACTERISTICS number of
patients
number of the SP’s T2DM patients whose care is shared with GPs
DoktorInfo
123.48 14 784 114.71 number of
referring GPs number of GPs with whom the SP share cares patients 21.56 1 84 15.95 number of
consultations
mean number of consultations per patient resulting in
confirmation or change of prescription by the SP 1.68 1.00 2.85 0.37 proportion of
loyal patients patients consulting the same SP (in percentages) 70.77 17.54 100.00 19.76
location
size of city where the SP works, proxied by number of inhabitants (in percentages) capital (over 1 million)
HCSO, OHAAP
21.7 large city (100 thousands–1 million) 28.6 n/a
medium-sized city (40–100 thousands) 14.8
small city (under 40 thousands) 34.9
type
institution where the SP’s practice is embedded (in percentages) clinic
OHAAP
10.7
university/teaching hospital 11.6 n/a
hospital 60.7
outpatient centre and others 17.0
number of
workplaces number of the SP’s current affiliations 1.46 0 5 0.69
Previous empirical research suggested that SPs’ socio-demographic characteristics—gender, age, and training location—are either significantly associated with new drug uptake or play a controversial role in the adoption process, both cases being worth analyzing (Lublóy 2014).
Gender played an influential role in the early adoption of new drugs in seven of 15 studies, male prescribers being more likely to adopt new drugs than female prescribers. Age was associated with new drug uptake in nine of 14 studies—in seven, early prescribers were younger than the majority. Four of five studies found training location influential.
SPs’ scientific orientation—measured by number of specialties, publication record, position, and scientific commitment—is a fairly under-researched area. Previously, only position was
included in only one of 35 studies deemed eligible for review (Lublóy 2014)—hospital doctors in managerial or honorary positions were found to adopt new drugs later than others, due to limited involvement in actual medical practice (Van den Bulte & Lilien 2001).
Empirical evidence showed that prescribing characteristics are crucial in new drug uptake (Lublóy 2014)—this article includes prescribing intensity, portfolio width, and the ratios of prescriptions for insulin and old A10Bs. Due to high correlation between number of patients and prescribing volume (0.95), prescribing intensity is captured by the ratio of prescriptions per patient. Increases in portfolio widths—that is, in the number of brands prescribed—may decrease times to adoption, its very high explanatory power demonstrated by Bourke & Roper (2012). Ten of 11 studies found that the higher the prescribing volume in the therapeutic class of a new drug, the higher the likelihood of early adoption of that new drug, due to enhanced adoption risk and likelihood of patients matching the recommended patient profile (Lublóy 2014). Differences in ratios of prescriptions for insulin and old A10Bs may be due to SPs’
individual attitudes towards available therapies, a matter of continuous debate in the medical literature (Krentz & Bailey 2005; Scheen 2005; Fonseca & Kulkarni 2008).
Prior research suggested that four patient characteristics may exert significant influence on new drug uptake—age, gender, socioeconomic status, and health status (Lublóy 2014). Five of nine studies reported that physicians are less likely to prescribe new drugs to elderly patients, more likely to experience side effects. While gender exerts little influence, the socioeconomic and health statuses are critical in new drug uptake. Three of four studies found that high-income patients receive new drugs earlier than others, not least because of their ability to pay for out-of-pocket treatments. Similarly, patients’ health statuses—self-reported health, poor response to existing therapies, previous use of certain medications, and presence of comorbidities—played an influential role in new drug uptake in three of four studies. Here, socioeconomic status is measured through income and health status through the presence of comorbidities.
Of the seven practice characteristics, size deserves obvious investigation—intuitively, the larger the size, the higher the probability of patients with T2DM. Here, size is measured by number of patients and number of referring GPs, as a proxy for the size of the catch area. The therapeutic activities—proxied by number of consultations per patient—were associated positively with early adoption of new drugs in all the eligible studies (Lublóy 2014). High volumes of diagnostic and therapeutic activities may be indicative of patient health severity, and of the need for early adoption of new drugs. Proportion of loyal patients has never been assessed in the literature before, although SPs may be more inclined to prescribe new drugs to patients whose medical histories they already know. Prior research suggested that location and type may also play a role in new drug diffusion (Lublóy 2014). With fewer opportunities for professional interactions and less frequent visits by pharmaceutical sales representatives, physicians in small cities might adopt new drugs later than colleagues in large cities—a view supported by three of the seven eligible studies, at least partly (Lublóy 2014). Two previous studies assessed type with contradictory results, worth clarifying (Lublóy 2014)—one study found no significant association between institutional accreditation and new drug uptake (Iyengar et al. 2011), whereas the other found evidence of association (Liu et al. 2011). Two studies looked into number of workplaces with ambiguous conclusions, also worth investigating—Garcia Lirola et al. (2000) found that doctors with more than one workplace adopted new drugs earlier than others, whereas Lin et al. (2011) found the number of workplaces irrelevant.
3. Results
The 318 physicians analyzed here accounted for roughly 80 per cent of the SPs who treated T2DM on a daily basis (see Tables 2 and 3 for basic statistics). They were 51.92 years old, on average, and 152 (47.8 per cent) were male—109 (34.28 per cent) had graduated from Semmelweis University in Budapest, the oldest medical school in Hungary. On average, they had furthered their medical education in 1.78 specialties and had published 2.07 articles.
Nearly half (157, 49.37 per cent) had published at least one article—43 (13.52 per cent) had published more than four. Approximately one fourth (71, 22.3 per cent) held a high-status position. Fourteen SPs displayed intense scientific commitment to diabetes, and could be considered opinion leaders in the area.
The combined 33,448 patients received 499,131 specialist medication prescriptions from their GPs. A typical SP suggested therapies for 123.48 patients and asked GPs to write 1,570 prescriptions—12.71 prescriptions per patient. (S)he prescribed almost 17 brands within the therapeutic class—the mean ratio of prescriptions was 79.1 per cent for insulin and 2.99 per cent for old A10Bs.
The mean age of patients was 64.2 years, and their average annual income was EUR 3,103.
On average, 45.25 per cent of the patients on the SPs’ panels had at least one comorbidity.
A typical SP received referrals from 21.56 GPs and saw patients 1.68 times. Over two thirds of patients (23,671, 70.77 per cent) were loyal to their SPs and did not consult other SPs in the sample. Approximately one fourth of SPs (69, 21.7 per cent) practiced in Budapest, whereas one third (111, 34.9 per cent) in small cities. The majority (193, 60.7 per cent) worked in a non-university/teaching hospital. On average, SPs were affiliated to 1.46 institutions.
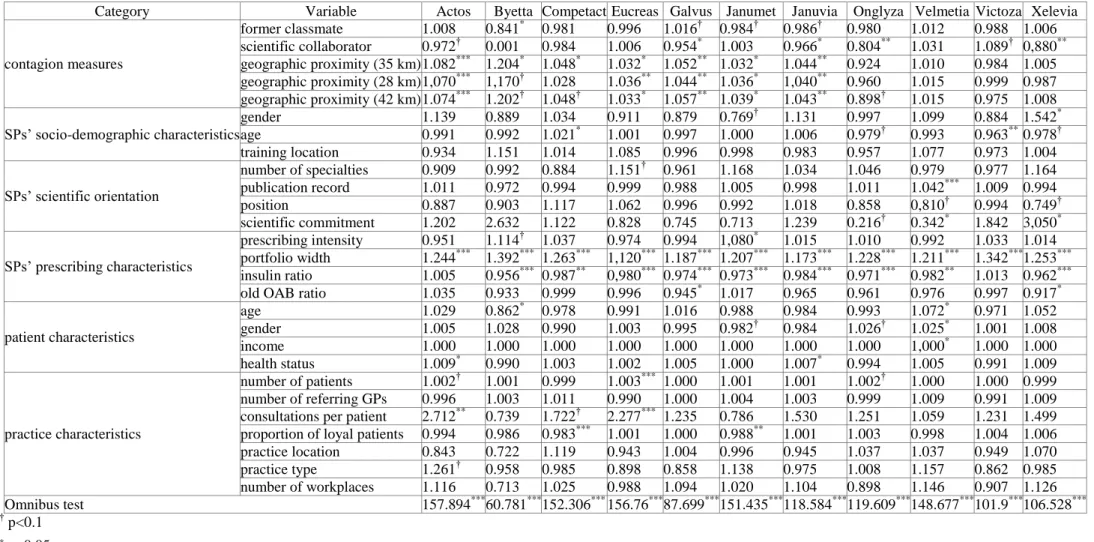
The regression results for the 11 study drugs (see Table 4) represent exp(β)s—hazard ratios between two SPs when the values of the respective variables differ by one unit, all other covariates being held constant. Variables with exp(β)s larger than one are associated with increased hazard—the higher the variable, the higher the hazard of the event.
The social influence from colleagues within a 35-kilometer radius is an important predictor of new drug uptake—the adoption ratio is positively associated with the likelihood of initial adoption for seven brands (Actos, Byetta, Competact, Eucreas, Galvus, Janumet, and Januvia). Counterintuitively, former classmates significantly delay the diffusion process for one brand (Byetta) and scientific collaborators for four brands (Galvus, Januvia, Onglyza, and Xelevia). In rest, exchanges within social networks do not influence significantly the likelihood of initial adoption.
The number of brands individual SPs prescribe is a very influential predictor of new drug uptake—the wider the prescribing portfolios, the earlier SPs initiate new therapies, for all 11 brands, whereas the ratio of prescriptions for insulin is significantly negatively associated for nine brands (Byetta, Competact, Eucreas, Galvus, Janumet, Januvia, Onglyza, Velmetia, and Xelevia).
At 95 per cent-confidence level, the majority of variables are significantly associated with the likelihood of initial adoption for only one or two brands—their number ranges from two (Victoza) to seven (Velmetia and Xelevia). In nine cases, the signs are as hypothesized based on previous empirical evidence (Lublóy 2014)—new drugs are adopted earlier by young SPs
(Victoza) and SPs with outstanding publication records (Velmetia), strong scientific commitments (Xelevia), large patient panels (Eucreas), high prescribing intensities (Janumet), high consultation intensities (Actos and Eucreas), younger patients (Byetta), more female patients (Velmetia), and high-income patients (Velemtia). In six other cases, the signs are counterintuitive, with higher likelihoods of initial adoption for female (Xelevia) and older SPs (Competact) and SPs with weak scientific commitments (Velmetia), less experience of old A10Bs (Galvus and Xelevia), older patients (Velmetia), and proportionally fewer loyal patients (Competact and Janumet). Seven variables have no explanatory power—training location, number of specialties, position, number of workplaces, number of referring GPs, practice location, and practice type.
Table 4: The Cox model regression results
Category Variable Actos Byetta Competact Eucreas Galvus Janumet Januvia Onglyza Velmetia Victoza Xelevia
contagion measures
former classmate 1.008 0.841* 0.981 0.996 1.016† 0.984† 0.986† 0.980 1.012 0.988 1.006 scientific collaborator 0.972† 0.001 0.984 1.006 0.954* 1.003 0.966* 0.804** 1.031 1.089† 0,880**
geographic proximity (35 km) 1.082*** 1.204* 1.048* 1.032* 1.052** 1.032* 1.044** 0.924 1.010 0.984 1.005 geographic proximity (28 km) 1,070*** 1,170† 1.028 1.036** 1.044** 1.036* 1,040** 0.960 1.015 0.999 0.987 geographic proximity (42 km) 1.074*** 1.202† 1.048† 1.033* 1.057** 1.039* 1.043** 0.898† 1.015 0.975 1.008 SPs’ socio-demographic characteristics
gender 1.139 0.889 1.034 0.911 0.879 0.769† 1.131 0.997 1.099 0.884 1.542* age 0.991 0.992 1.021* 1.001 0.997 1.000 1.006 0.979† 0.993 0.963** 0.978† training location 0.934 1.151 1.014 1.085 0.996 0.998 0.983 0.957 1.077 0.973 1.004 SPs’ scientific orientation
number of specialties 0.909 0.992 0.884 1.151† 0.961 1.168 1.034 1.046 0.979 0.977 1.164 publication record 1.011 0.972 0.994 0.999 0.988 1.005 0.998 1.011 1.042*** 1.009 0.994 position 0.887 0.903 1.117 1.062 0.996 0.992 1.018 0.858 0,810† 0.994 0.749† scientific commitment 1.202 2.632 1.122 0.828 0.745 0.713 1.239 0.216† 0.342* 1.842 3,050* SPs’ prescribing characteristics
prescribing intensity 0.951 1.114† 1.037 0.974 0.994 1,080* 1.015 1.010 0.992 1.033 1.014 portfolio width 1.244*** 1.392*** 1.263*** 1,120*** 1.187*** 1.207*** 1.173*** 1.228*** 1.211*** 1.342*** 1.253***
insulin ratio 1.005 0.956*** 0.987** 0,980*** 0.974*** 0.973*** 0.984*** 0.971*** 0.982** 1.013 0.962***
old OAB ratio 1.035 0.933 0.999 0.996 0.945* 1.017 0.965 0.961 0.976 0.997 0.917* patient characteristics
age 1.029 0.862* 0.978 0.991 1.016 0.988 0.984 0.993 1.072* 0.971 1.052
gender 1.005 1.028 0.990 1.003 0.995 0.982† 0.984 1.026† 1.025* 1.001 1.008
income 1.000 1.000 1.000 1.000 1.000 1.000 1.000 1.000 1,000* 1.000 1.000
health status 1.009* 0.990 1.003 1.002 1.005 1.000 1.007* 0.994 1.005 0.991 1.009
practice characteristics
number of patients 1.002† 1.001 0.999 1.003*** 1.000 1.001 1.001 1.002† 1.000 1.000 0.999 number of referring GPs 0.996 1.003 1.011 0.990 1.000 1.004 1.003 0.999 1.009 0.991 1.009 consultations per patient 2.712** 0.739 1.722† 2.277*** 1.235 0.786 1.530 1.251 1.059 1.231 1.499 proportion of loyal patients 0.994 0.986 0.983*** 1.001 1.000 0.988** 1.001 1.003 0.998 1.004 1.006 practice location 0.843 0.722 1.119 0.943 1.004 0.996 0.945 1.037 1.037 0.949 1.070 practice type 1.261† 0.958 0.985 0.898 0.858 1.138 0.975 1.008 1.157 0.862 0.985 number of workplaces 1.116 0.713 1.025 0.988 1.094 1.020 1.104 0.898 1.146 0.907 1.126 Omnibus test 157.894*** 60.781*** 152.306*** 156.76*** 87.699*** 151.435*** 118.584*** 119.609*** 148.677*** 101.9*** 106.528***
† p<0.1
* p<0.05
** p<0.001
*** p<0.0001
4. Discussion and policy implications
This article studied the influences of a wide range of variables on the SPs’ adoption of new drugs and identified three key determinants—contagion from geographically close colleagues, portfolio width, and insulin ratio.
The higher the adoption ratio of geographically close colleagues, the higher the likelihood of early adoption for seven of the 11 brands. Two earlier pharmaceutical studies reached identical conclusions—Manchanda et al. (2008) and Liu & Gupta (2012) both reported that the estimated effect of social contagion among physicians in geographic proximity is positive and significant even after controlling for time trends and marketing efforts. However, due to data constraints, this article could not control for detailing—some sales representatives may be more persuasive than others and may operate in geographies where physicians are more inclined to adopt new drugs, a propensity further enhanced by peer pressures from nearby adopters. At least initially, pharmaceutical companies and healthcare policy strategists wishing to influence new drug diffusion need to focus on geographies where practices are close—larger cities, with higher population densities and family incomes—and on monetary aspects and the sales representatives’ persuading powers.
However, this article found no empirical evidence for the hypothesized influential roles of former classmates and scientific collaborators—in a few cases, these had even delayed diffusion.
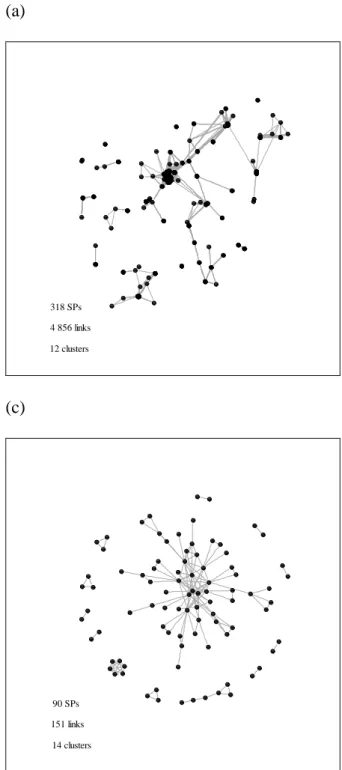
Geographically close colleagues form the densest social network, whereas scientific collaborators the sparsest (see Figure 1). More likely than not, former classmates discuss professional matters irregularly, whereas scientific collaborators exchange ideas regularly, at least in writing. However, their networks are small, sparse, and temporal—only roughly one third of the SPs in the sample had ever published an article with a colleague. To disentangle the eventual exception from the rule more research is required—it is easier to construct former classmate and scientific collaborator networks than it is to construct survey-based networks.
A recent study showed that collegial interactions within a medical establishment influence the likelihoods of initial prescriptions—both compeers and senior colleagues play crucial roles (Lin et al. 2011). However, to the authors’ knowledge, there are no rigorous analyses as to how collegial interactions outside the workplace—through continuing medical educations, national and international conferences, and professional memberships—affect new drug uptake.
Figure 1: Social networks of specialists: (a) geographically close colleagues; (b) former classmates at Semmelweis University; and (c) scientific collaborators
(a)
318 SPs 4 856 links 12 clusters
(c)
90 SPs 151 links
14 clusters
(b)
93 SPs 137 links
28 clusters
Portfolio width is the only consistent predictor across the 11 study drugs, in line with Bourke &
Roper (2012), who—out of over ten variables—found significant and consistently signed effects across six new drugs used in general practice. The wider the portfolios, the shorter the physicians’
adoption times.
Of note, portfolio width correlates highly with number of patients (0.65), which in turn correlates highly with prescribing volume in the therapeutic class of the new drug (0.95). When portfolio width is excluded from the Cox model, number of patients becomes the only consistent predictor of new drug uptake. When number of patients is excluded, prescribing volume in the therapeutic class
of the new drug becomes the only consistent predictor of early adoption, in line with Lublóy (2014), where physicians with high patient flows seemed particularly alert to new drugs—in six of nine studies, the higher the total number of patients (or total prescribing volume), the higher the likelihood of early adoption. Moreover, almost all eligible studies—ten out of 11—found that the higher the prescribing volume in the therapeutic class of a new drug, the higher the likelihood of early adoption of that new drug. However, the regression results here show that portfolio width is a better predictor of new drug uptake than either total number of patients (or total prescribing volume) or prescribing volume in the therapeutic class of the new drug. Previous studies might have drawn identical conclusions, had portfolio width been considered.
Another important determinant, ratio of prescriptions for insulin is significantly negatively associated with the rate of adoption for nine of the 11 study drugs, with four possible explanations for delays in the adoption of new A10Bs. First, the individual SPs’ convictions as to the most appropriate therapy (Krentz & Bailey 2005; Scheen 2005; Davis & Abraham 2011), which may be related to therapeutic conservatism or to knowledge of and clinical experience with the new A10Bs.
Second, patients with long disease histories, predating A10Bs, had already received insulin, thus excluding A10Bs as an alternative therapy (Korytkowski 2002; Krentz & Bailey 2005). Third, for patients at severe stages of the disease, A10Bs are insufficient for keeping blood glucose levels low.
Fourth, low-income patients cannot cover 30 per cent of the A10B price, whereas insulin is free of charge. However, the latter three explanations can be ruled out, at least partly. The mean patient age—presumably, a good proxy for the length of the disease history—was factored in and found significantly associated with the uptake of Velmetia, but not with the other ten A10Bs. Furthermore, prescribing Velmetia was associated with older rather than younger patients. Disease severity was measured through the presence of comorbidities, and no significant associations were found with new drug adoption. Finally, the mean annual patient income was also factored in and found significantly positively associated with the uptake of Velmetia, but not of the other ten A10Bs.
However, two estimation biases may affect validity. First, patient income was proxied by either the mean street-level income (for large settlements, over 20 thousand inhabitants) or the zip code-level income (for small settlements, under 20 thousand inhabitants). Second, the shadow economy is sizeable in Hungary and reported and actual incomes may differ significantly. However, further investigation of these biases is beyond the scope of this article. Furthermore, discussions with physicians support the idea that SPs favor insulin either due to therapeutic convictions or to having low-income patients—the impact of both factors was supported by evidence in the diffusion literature (Lublóy 2014).
The three determinants of new drug diffusion identified here belong to two categories of factors—
contagion measures and prescribing characteristics. This may be considered good news for pharmaceutical companies and healthcare policy strategists, who need to rely only on these two categories to influence new drug diffusion—all other categories seem irrelevant to prescribing behavior. To rollout new drugs successfully, practice location and prescription data may be sufficient to identify target SPs, distribute marketing efforts, and allocate healthcare budgets. Hard- to-obtain data such as SPs’ socio-demographic characteristics and scientific orientations and practice and patient characteristics are not necessary.
A number of variables do not influence the likelihood of routine adoption significantly. There is no evidence that physicians in high positions adopt later, as suggested by Van den Bulte & Lilien (2001)—as knowledge brokers with ambassadorial roles and high legitimacies (Waring et al. 2013), hospital department and outpatient center managers did not adopt significantly later any of the brands. Measured through HDA board membership, HDA award receivership, and senior editorship, opinion leaderships do not lead to significantly different likelihoods of routine adoption.
Presumably, other SPs prescribe new A10Bs earlier than opinion-leading SPs due to higher
involvement in medical practice. Reflected in number of specialties earned and number of scientific publications, physicians’ scientific orientations do not increase the likelihoods of routine adoption.
Furthermore, institutions with higher accreditation levels—such as clinics and university/teaching hospitals—do not play an opinion-leading role, new drugs diffusing equally fast to all institutions.
Also, in synchronicity with Lin et al. (2011), physicians with more than one affiliation do not adopt new drugs earlier—theoretically, more affiliations allow for more interactions with colleagues, but the physicians sampled here were engaged in private solo practices, with no direct stimulus from colleagues.
SPs’ age and gender played influential roles in the routine adoption of new drugs in approximately half of the earlier studies (Lublóy 2014). However, this article found no associations. Also, although almost all studies assessing the role of training location found it influential, this article found its impact marginal, which may be explained by the geographic proximity of training sites.
This article surpasses previous studies in number and variety of variables—with so many different variables likely to influence new drug uptake, it is not surprising that the majority of variables have only a moderate impact. Another possible explanation for the insignificance of variables in this article compared to earlier studies may lie in investigating routine rather than first-time adoption of new drugs.
5. Limitations
This article has several possible limitations. First and foremost, prescription data is incomplete.
SPs’ prescribing behaviors are monitored through the reported prescription data by GPs with whom SPs share patient care. All the sampled GPs included the name/identification number of the therapy- initiating SPs, but only around one fifth of practicing GPs were sampled—SPs’ routine adoptions of new drugs may therefore occur earlier. However, the sampled GPs are geographically representative and the size of this bias is expected to be constant across SPs and not undermine the validity of the results. Second, the marketing efforts of pharmaceutical companies targeted at physicians are not accounted for. Detailing, sampling, advertisements in medical journals, and pharmaceutical meetings and events all aim to boost profits by providing knowledge, increasing product awareness, and directing further information acquisition. In the pharmaceutical marketing literature, the size and efficiency of marketing efforts targeted at physicians are very powerful predictors of new drug uptake (Kremer et al. 2008; Manchanda et al. 2008; Iyengar et al. 2011; Liu & Gupta 2012). Studies almost unambiguously reported that pharmaceutical marketing—particularly, detailing—has a significant positive influence on prescribing (for example, Kremer et al. 2008). Third, the contagion measure based on geographic proximity captures interpersonal effects indirectly—one cannot validate whether geographically close physicians exchange ideas regularly, if at all (for a detailed discussion of the benefits and costs of using geographic proximity, see Conley & Udry 2005).
Fourth, conclusions based on only one therapeutic class cannot be generalized. By incorporating multiple therapeutic classes, future research may examine the determinants of new drug diffusion identified here for consistency and moderation by therapeutic class characteristics.
6. Conclusions
This article has explored the determinants that affect SPs’ routine prescribing of new A10Bs by focusing on the effects of six categories of factors—SPs’ social embeddedness, socio-demography, scientific orientation, and prescribing pattern, as well as practice and patient characteristics. A large-scale archival dataset of SPs’ actual prescribing behaviors has avoided several statistical biases usually related to retrospective surveys—for example, confounding bias, sample selection bias, and recall bias. This article has suggested practical ways in which pharmaceutical companies
and healthcare policy strategists may enhance new drug diffusion. Most importantly, echoing prior research, this article has found that knowledge regarding a new drug is—at least partly—socially constructed, and that previous prescribing patterns are decisive in new drug uptake. The former suggests that vicarious learning is as important as experimental learning, whereas the latter emphasizes the significance of SPs’ therapeutic convictions and clinical experiences.
References
Acedo, F.J., et al. (2006). Co-authorship in management and organizational studies: an empirical and network analysis. Journal of Management Studies, 43(5), 957–983.
Bajaj, Y. (2012). Can online physician networks improve patient care? http://healthradii.com/can- online-physician-networks-improve-patient-care (accessed 15.05.2014).
Berwick, D.M. (2003). Disseminating innovations in health care. Journal of the American Medical Association, 289(15), 1969–1975.
Bourke, J., & Roper, S. (2012). In with the new: the determinants of prescribing innovation by general practitioners in Ireland. The European Journal of Health Economics, 13(4), 393–407.
Van den Bulte, C., & Lilien, G.L. (2001). Medical innovation revisited: social contagion versus marketing effort. American Journal of Sociology, 106(5), 1409–1435.
Chauhan, D., & Mason, A. (2008). Factors affecting the uptake of new medicines in secondary care—a literature review. Journal of Clinical Pharmacy and Therapeutics, 33(4), 339–348.
Coleman, J.S., Katz, E., & Menzel, H. (1966). Medical innovation: a diffusion study. New York:
Bobbs-Merrill Company.
Conley, T.G., & Udry, C.R. (2005). Learning about a new technology: pineapple in Ghana (University of Chicago working paper). http://www.econ.yale.edu/~cru2/pdf/july2005a.pdf (accessed 15.05.2014).
Cox, D.R. (1972). Regression models and life tables. Journal of the Royal Statistical Society (Series B, Methodological), 34(2), 187–220.
Danaei, G., et al. (2011). National, regional, and global trends in fasting plasma glucose and diabetes prevalence since 1980: systematic analysis of health examination surveys and epidemiological studies with 370 country-years and 2.7 million participants. Lancet, 378(9785), 31–
40.
Davis, C., & Abraham, J. (2011). The socio-political roots of pharmaceutical uncertainty in the evaluation of “innovative” diabetes drugs in the European Union and the US. Social Science &
Medicine, 72(9), 1574–1581.
Fonseca, V.A., & Kulkarni, K.D. (2008). Management of type 2 diabetes: oral agents, insulin, and injectables. Journal of the American Dietetic Association, 108(4), S29–S33.
García Lirola, M.A., et al. (2000). Adopción de los nuevos medicamentos por los médicos prescriptores. El médico innovador [Adoption of new medications by prescribing physicians: the innovating physician]. Atención Primaria [Primary Care], 25(1), 22–28.
Glänzel, W., & Schubert, A. (2005). Analysing scientific networks through co-authorship. In H.F.
Moed, W. Glänzel, & U. Schmoch (Eds.), Handbook of quantitative science and technology research (pp. 257–276). Dordrecht: Springer Netherlands.
Glass, H.E., & Rosenthal, B. (2004). Demographics, practices, and prescribing characteristics of physicians who are early adopters of new drugs. Pharmacy and Therapeutics, 29(11), 2–8.
Greving, J.P., et al. (2006). Determinants for the adoption of angiotensin II receptor blockers by general practitioners. Social Science & Medicine, 63(11), 2890–2898.
Huesch, M.D. (2011). Is blood thicker than water? Peer effects in stent utilization among Floridian cardiologists. Social Science & Medicine, 73(12), 1756–1765.
Iyengar, R., Van den Bulte, C., & Valente, T.W. (2011). Opinion leadership and social contagion in new product diffusion. Marketing Science, 30(2), 195–212.
Korda, R.J., Clements, M.S., & Dixon, J. (2011). Socioeconomic inequalities in the diffusion of health technology: uptake of coronary procedures as an example. Social Science & Medicine, 72(2), 224–249.
Korytkowski, M. (2002). When oral agents fail: practical barriers to starting insulin. International Journal of Obesity and Related Metabolic Disorders, 26(Supplement 3), S18–S24.
Kremer, S.T.M., et al. (2008). Generalizations on the effectiveness of pharmaceutical promotional expenditures. International Journal of Research in Marketing, 25(4), 234–246.
Krentz, A.J., & Bailey, C.J. (2005). Oral antidiabetic agents: current role in type 2 diabetes mellitus.
Drugs, 65(3), 385–411.
Lin, S., Jan, K., & Kao, J. (2011). Colleague interactions and new drug prescribing behavior: the case of the initial prescription of antidepressants in Taiwanese medical centers. Social Science &
Medicine, 73(8), 1208–1213.
Liu, Q., & Gupta, S. (2012). A micro-level diffusion model for new drug adoption. Journal of Product Innovation Management, 29(3), 372–384.
Liu, X., et al. (2005). Co-authorship networks in the digital library research community.
Information Processing & Management, 41(6), 1462–1480.
Liu, Y.-M., Yang, Y.-H.K., & Hsieh, C.-R. (2011). The determinants of the adoption of pharmaceutical innovation: evidence from Taiwan. Social Science & Medicine, 72(6), 919–927.
Lublóy, Á. (2014). Factors affecting the uptake of new medicines: a systematic literature review.
Under review by BMC Health Services Research. http://www.uni- corvinus.hu/fileadmin/user_upload/hu/tanszekek/gazdalkodastudomanyi/tsz-
bvp/munkatarsak/lubloy_agnes/AXA/Lubloy_Review_diffusion_systematic.pdf (accessed 15.05.2014).
Manchanda, P., Xie, Y., & Youn, N. (2008). The role of targeted communication and contagion in product adoption. Marketing Science, 27(6), 961–976.