Social Network Influence on New Drug Diffusion: Can the Data-driven Approach Provide Practical Benefits?*
Ágnes Lublóy
Stockholm School of Economics in Riga
Judit Lilla Keresztúri
Institute of Finance and Accounting, Department of Finance, Corvinus University of Budapest, Email: lilla.kereszturi@uni-corvinus.hu (
Gábor Benedek
Thesys SEA Pte Ltd, Singapore
Department of Mathematical Economics and Economic Analyses, Corvinus University of Budapest
This article studies the determinants of pharmaceutical innovation diffusion among specialists. To this end, it investigates the influences of six categories of factors—social embeddedness, socio- demography, scientific orientation, prescribing patterns, practice characteristics, and patient panel composition—on the use of 11 new drugs for the treatment of type 2 diabetes mellitus in Hungary.
The Cox proportional hazards model identifies three determinants—social contagion (in the social embeddedness category) and prescribing portfolio and insulin prescribing ratio (in the prescribing pattern category). First, social contagion has a positive effect among geographically close colleagues—the higher the adoption ratio, the higher the likelihood of early adoption—but no influence among former classmates and scientific collaborators. Second, the wider the prescribing portfolio, the earlier the new drug uptake. Third, the lower the insulin prescribing ratio, the earlier the new drug uptake—physicians’ therapeutic convictions and patients’ socioeconomic statuses act as underlying influencers. However, this finding does not extend to opinion-leading physicians such as scientific leaders and hospital department and outpatient center managers. This article concludes by
* This research was supported by the Higher Education Institutional Excellence Program of the Hungarian Ministry of Human Capacities in the framework of the ‘Financial and Retail Services’ research project (1783-3/2018/FEKUTSTRAT) at Corvinus University of Budapest. Ágnes Lublóy’s work on the paper was also supported by the post-doctoral research grant from AXA Research Fund (grant number 2011-Post Doc - Corvinus University of Budapest - Lublóy Á.). The authors are grateful to DoktorInfo Ltd, for waiving the subscription charge in the interest of scientific research; Petra Baji, Edina Berlinger, and László Gulácsi, as well as two anonymous referees for valuable comments and suggestions on earlier drafts; participants at the Production and Operations Management Society’s 27th Annual Conference and at the 23rd Congress of the Hungarian Diabetes Association for helpful discussions; and Anamaria M. Cristescu-Martin, for editorial assistance.
arguing that healthcare policy strategists and pharmaceutical companies may rely exclusively on practice location and prescription data to perfect interventions and optimize budgets.
Keywords: pharmaceutical innovations, Cox proportional hazards model; diffusion; social contagion; pharmaceutical innovations
JEL-codes: C14, C34, I19
1. INTRODUCTION
The healthcare industry all over the world faces the challenge of providing high quality patient care in an environment of limited resources. Recent developments in analytics and information technology offer important data-driven opportunities for enhancing the delivery of healthcare. Healthcare institutions which analyse big data are performing better, with lower costs, higher quality of care, shorter waiting times, reductions in medical errors, higher reimbursement rates (Alemi 2005). New drug diffusion is an area where healthcare analytics might result in better outcomes both for pharmaceutical companies and healthcare politicians. For this purpose, millions of prescription data should be mined and combined with doctors’ characteristics, including their social network.
Innovation and the successful diffusion of new drugs are critical for the financial performance of pharmaceutical companies. Medicine and society benefit from pharmaceutical innovations as well (Greenhalgh 2005). Where new drugs expand therapeutics in areas of yet unmet clinical need, patients benefit from the early access to the latest therapeutic innovations. Improved health status might result in higher employment rates. Furthermore, newly marketed drugs, if cost efficient, have high potential to drive improvements in healthcare from the limited healthcare budget: a better health status is either achieved from the same budget, or the health status of patients is maintained at a lower cost.
New drug uptake might be either driven by external forces, such as regulation, characteristics of medicines, competition, marketing effort or by internal forces such as social contagion (Dunn et al.
2012). The diffusion of pharmaceutical innovation is mainly determined by the behaviour of patients and medical professionals, as well as the strategies of pharmaceutical companies and government policies (e. g. Greenhalgh 2005; Lublóy 2014; Coleman et al. 1966; Iyengar et al. 2011). Although doctors consider new drugs on individual merits, some may be more predisposed to adopt one than others. Several factors, such as participation in clinical trials, prescribing volume, either in total or
within the therapeutic class of the new drug, pharmaceutical companies’ marketing efforts and some patient characteristics are significantly associated with early adoption (Lublóy 2014). Furthermore, several studies found convincing empirical evidence of social contagion in new drug diffusion (e. g.
Coleman et al. 1966; Iyengar et al. 2011; Lin et al. 2011; Liu – Gupta 2012; Manchanda et al. 2008).
Social interactions among colleagues are indispensable to gaining knowledge and reducing uncertainty about the consequences of new drug adoption.
Previous literature on social contagion classified physicians according to the roles that they played in their social networks such as advisors, discussion partners, friends, physicians to whom patients are referred, and colleagues similar in terms of age and tenure (e.g. Lin et al. 2011; Liu – Gupta 2012;
Manchanda et al. 2008; Van den Bulte C – Lilien 2001). Prior research used surveys and mail questionnaires for identifying early adopters and for listing collegial interactions (Chauhan – Mason 2008; Mason 2008). A retrospective study based on self-reporting is not only costly, but runs the risks of recall and social desirability bias. This article uses prescription data which reflect prescribing realities, and thus are exempt from recall bias, and follows an alternative approach to defining social networks. Instead of asking specialists to list their collegial interactions, this article mines databases to construct the contagion measures. The contagion measures, being exempt from social desirability bias, reflect distinct channels of interpersonal communication: with former classmates, scientific collaborators, and geographically close colleagues.
This article contributes to the literature on social contagion in new drug diffusion in the age of analytics, as large-scale prescription data and contagion measures extracted from databases. We investigate whether social contagion measures extracted from databases rather than from survey and mail questioners support pharmaceutical companies and healthcare politicians in influencing the uptake of pharmaceutical innovations. We hypothesize that the higher the number of classmates, co- authors and geographically close colleagues who have already adopted the new drug, the higher the likelihood of adoption by a specific physician.
The influences of former classmates and scientific collaborators on new drug diffusion have never been analysed in the pharmaceutical literature before. However, empirical evidence shows that former classmates are important channels of knowledge diffusion in various areas of life (Dahl – Pedersen 2004; Østergaard 2009). Furthermore, anecdotal evidence shows that physicians regularly exchange ideas with former classmates even after graduation, especially if they practice medicine in the same specialty (Bajaj 2015; Wong 2015). Similarly, the influential role of scientific collaborators was
proved in many other domains (Acedo et al. 2006; Glänzel – Schubert 2005). Although distance- based contagion measures were used in two recent studies (Liu – Gupta 2012; Manchanda et al. 2008), the pharmaceutical literature calls for further research on this measure.
If contagion measures extracted from databases are found to be important predictors of new drug uptake, then pharmaceutical companies and health politicians might rely upon these contagion measures to influence new drug diffusion, and target their interventions at doctors whose adoption is the most contagious. For pharmaceutical companies, personal selling through sales representatives, is the primary promotional instrument (Manchanda – Honka 2005), and thus knowing the key-opinion leaders in the overlapping social networks is of major importance (Greenhalgh 2005). Governments are major influencers of new drug uptake through regulatory and approval agencies and budgetary allocations. However, healthcare politicians might encourage the adoption of the most efficient/least expensive new drugs through continuing medical education—targeting relevant, tailored information at specialist subgroups whose behaviour is contagious.
Following this introduction, section 2 presents the key characteristics of the study drugs and the data sources used, discusses the statistical model, and specifies the covariates. Section 3 presents the results, which are then discussed in section 4, alongside policy implications and several possible research limitations. Finally, section 5 summarizes the research findings.
2. METHODS 2.1. Study Drugs
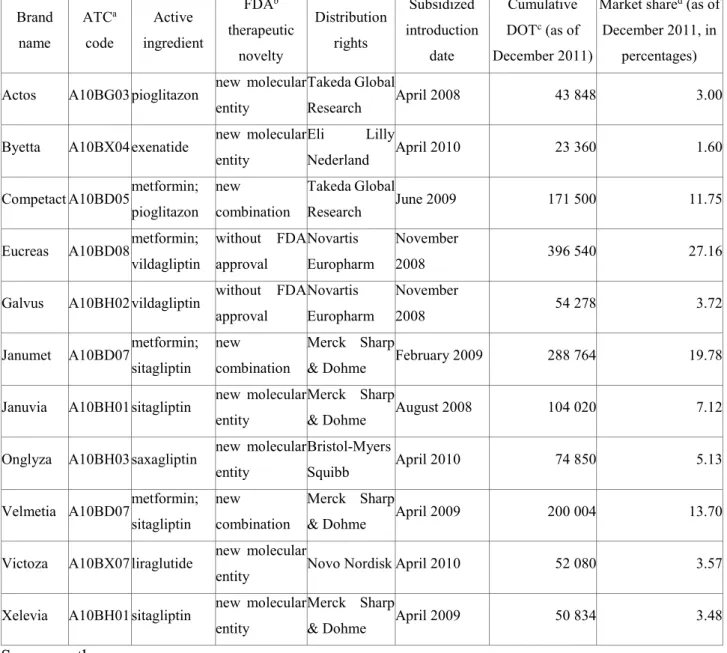
This article focuses on new anti-diabetic drugs (A10Bs) for the treatment of type 2 diabetes mellitus (T2DM) in Hungary. A10Bs are blood glucose (HbAc1) lowering drugs other than insulin, classified by the World Health Organization (WHO) Anatomical Therapeutic Chemical (ATC) classification system which is based on the organs/systems on which drugs act and/or the therapeutic and chemical characteristics of the drugs. In Hungary, 11 brands were introduced in a subsidized form between April 2008 and April 2010, outperforming all other therapeutic classes. Details of the 11 new brands are shown in Table 1. When added to metformin, the default treatment for T2DM, each drug reduces the HbAc1 level, with close to equal efficiencies, and despite distinct modes of action (EMA 2015).
The study drugs are prescribed by internists subspecialized in endocrinology—a fairly closed
community, suitable for the purpose of this article. In Hungary, specialists share the care of T2DM patients with general practitioners, allowing for the examination of routine—as opposed to just first- time—adoption of new A10Bs. Adoption becomes routine when specialists first ask referring general practitioners to prescribe new A10Bs, on grounds of efficacy and efficiency. Intuitively, any such drugs are already part of the specialists’ prescribing portfolios, following first-time adoption and follow-up tests.
Table 1. New anti-diabetic drugs introduced in Hungary between April 2008 and April 2010: main data
Brand name
ATCa code
Active ingredient
FDAb therapeutic
novelty
Distribution rights
Subsidized introduction
date
Cumulative DOTc (as of December 2011)
Market shared (as of December 2011, in
percentages) Actos A10BG03 pioglitazon new molecular
entity
Takeda Global
Research April 2008 43 848 3.00
Byetta A10BX04 exenatide new molecular entity
Eli Lilly
Nederland April 2010 23 360 1.60
Competact A10BD05 metformin;
pioglitazon new combination
Takeda Global
Research June 2009 171 500 11.75
Eucreas A10BD08 metformin;
vildagliptin
without FDA approval
Novartis Europharm
November
2008 396 540 27.16
Galvus A10BH02 vildagliptin without FDA approval
Novartis Europharm
November
2008 54 278 3.72
Janumet A10BD07 metformin;
sitagliptin new combination
Merck Sharp
& Dohme February 2009 288 764 19.78
Januvia A10BH01 sitagliptin new molecular entity
Merck Sharp
& Dohme August 2008 104 020 7.12
Onglyza A10BH03 saxagliptin new molecular entity
Bristol-Myers
Squibb April 2010 74 850 5.13
Velmetia A10BD07 metformin;
sitagliptin new combination
Merck Sharp
& Dohme April 2009 200 004 13.70
Victoza A10BX07 liraglutide new molecular
entity Novo Nordisk April 2010 52 080 3.57
Xelevia A10BH01 sitagliptin new molecular entity
Merck Sharp
& Dohme April 2009 50 834 3.48
Source: authors.
a Anatomical Therapeutic Chemical.
b Food and Drug Administration.
c Days of therapy.
d Relative to the other new A10Bs.
2.2. Data Sources
Adoption behaviour is extracted from a prescription database managed by DoktorInfo Ltd and covers prescription information between April 2008 and December 2011. Around one fifth of the Hungarian general practitioner population feeds real-time prescription data into the DoktorInfo database voluntarily—they are representative of the entire Hungarian general practitioner population in both age and location (defined by region and population size). General practitioners are compensated for providing information such as general practitioner identification number; prescription date;
prescribed drug characteristics (brand name, ATC code, and dosage); prescribed drug subsidy; patient characteristics (age and gender); and, since January 2009, for patients whose care is shared, identification number of the therapy-initiating specialist. The latter enables monitoring the adoption behaviours and prescribing patterns of specialists who share care of T2DM patients.
The database managed by the Office of Health Authorization and Administrative Procedures (OHAAP) covers socio-demographic and practice-related variables. This database contributes to the generation of two contagion measures: network of former classmates and geographically close colleagues.
The database of ComFit, a bibliographic database similar to PubMed and containing Hungarian medical articles, and the database of the Hungarian Diabetes Association (HDA), with information on the scientific activities of qualified diabetologists (presentations at the HDA biennial congresses) contribute to constructing the scientific collaboration network.
2.3. Statistical Model
Similarly to many recent studies of the fields (Iyengar et al. 2011; Lin et al. 2011; Wen et al. 2011), this article uses the Cox proportional hazards model (Cox 1972) to examine factors influencing the likelihoods of routine adoptions of A10Bs by specialists. The Cox model is the most appropriate choice for the purpose because of the way it handles right-censored data—cases where specialists had not routinely adopted the A10Bs by the end of 2011 (time t). The model specified in Equation 1 h(t ∣ Z, x(t))relates the time that passes before initial adoption to covariates that may be associated with that quantity of time. Separate models were run for each social contagion measure. The time period was divided into K equal parts by determining (K-1) points in time (0 < 𝜏1 = 30 < 𝜏2 =
60 < ⋯ < 𝜏𝐾−1).
The hazard ratio/likelihood of routine adoption at time t for each specialist is specified in Equation 1 as follows:
ℎ(𝑡 ∣ 𝑥(𝑡), 𝒁) = 𝜆0exp( 𝛾𝑥(𝑡) + 𝜷𝒁), where (1)
𝑥(𝑡) = ∑𝐾𝑖=1𝑥𝑖−1𝐼[𝑡 𝜖[𝜏𝑖−1, 𝜏𝑖]] (2)
and
𝑥𝑖 = 100% ∗ 𝐾𝑖/𝑁𝑖 (3)
in which λ0 is the baseline hazard function, exp(γ) is the hazard ratio of the respective contagion measure, x is the contagion measure, exp(β) is the vector of the hazard ratio, Z is the vector of the control variables, Ki is the number of adopting colleagues in period i, and Ni is the number of all colleagues in period i. By definition, λ0, the baseline hazard function describes the risk of adaption for specialists with the particular contagion measure being zero and thus serving as a point of reference.
For multiple highly correlated covariates (with coefficients higher than 0.85), only one variable from the set of intercorrelated variables is used (Garson 2013). All independent variables were introduced in one step into the regression. Coefficients exp(γ) and the exp(β) were estimated with the IBM SPSS Statistic v22.0 programme. The coefficients of the independent variables and the control variables are calculated and interpreted in Section 3 (Results).
Omnibus tests of model coefficients were conducted for assessing the validity of the model. The omnibus test is a likelihood-ratio chi-square test of the full model versus the null model (all the coefficients are zero).
The dependent variable is a dummy indicating each month whether the specialist had routinely adopted the A10B.
2.4. Independent Variables
In the literature, interactions—professional and social—appear to be a very important influencing factor, information relayed through direct, personal contacts proving particularly powerful.
Physicians’ adopting behaviours are affected by other physicians’ knowledge, attitudes, and
behaviours, thus reducing safety and efficacy uncertainties (Lublóy 2014, Coleman et al. 1966;
Iyengar et al. 2011; Lin et al. 2011; Liu – Gupta 2012; Manchanda et al. 2008; McGettigan et al.
2001; Prosser – Walley 2006). While other sources of information provide the nurturing groundwork of necessary knowledge, behavioural change requires the legitimizing power of personal advice from informed and respected colleagues through reliable, easy-to-digest assessments of new drugs.
In this article, contagion measures assess whether the adoption decisions of colleagues significantly influence specialists’ likelihoods of adoption. Most prior research used surveys and mail questionnaires for constructing contagion measures (studies found convincing empirical evidence of social contagion in new drug diffusion (e. g. Coleman et al. 1966; Iyengar et al. 2011; Lin et al. 2011).
Survey-based contagion measures capture interpersonal effects directly, but are time consuming and costly. Furthermore, a retrospective study based on self-report is at risk of recall and social desirability biases—rather than what actually occurs in practice, surveys and interviews may simply capture normative responses and expressed attitudes. In addition, social networks are not easy to construct if the response rate is low, and endogenous group formation might arise if physicians identify other physicians with similar preferences as members of their social network. The result of the effect of common preferences on individual adoption decisions incorrectly manifests as a social contagion effect (Liu – Gupta 2012).
Instead of asking specialists to list their collegial interactions, this article uses complementary data sources to construct the contagion measures. The contagion measures selected for separate analysis capture social interactions with former classmates, with scientific collaborators and with geographically close colleagues. Contagion measures are time-dependent covariates, the percentage of adopting colleagues changing over time. To ensure causal relationships between explanatory and time-dependent covariates, the latter were lagged by one month.
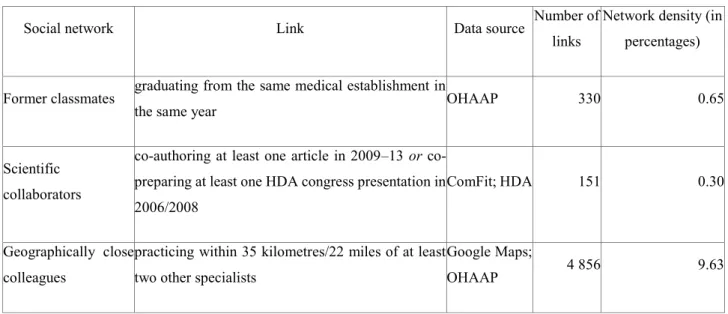
Table 2 summarizes the descriptive statistics for the three contagion measures. Former classmates graduated from the same medical establishment in the same year, scientific collaborators either published an article or prepared a presentation together, and geographically close colleagues had offices within a pre-specified radius. As argued in the literature, a radius of 20 miles is long enough to capture most of the interpersonal effects and short enough to allow social network differentiations (Manchanda et al. 2008). This article defines specialists’ spatial social networks through geographic circles with radiuses of 35 kilometres/22 miles centred on the specialists’ practice locations, radius sensitivity double-checked by additional radiuses at ±20 per cent.
Table 2. Contagion measures: definitions and descriptive statistics for 318 specialists
Social network Link Data source Number of
links
Network density (in percentages)
Former classmates graduating from the same medical establishment in
the same year OHAAP 330 0.65
Scientific collaborators
co-authoring at least one article in 2009–13 or co- preparing at least one HDA congress presentation in 2006/2008
ComFit; HDA 151 0.30
Geographically close colleagues
practicing within 35 kilometres/22 miles of at least two other specialists
Google Maps;
OHAAP 4 856 9.63
Source: authors.
2.5. Control Variables
Without controlling for factors relevant to prescribing behaviour, empirical evidence is at risk of presenting confounding effects. This article controls for five categories of factors—physicians’ socio- demographics, scientific orientations, prescribing patterns, as well as practice characteristics and patient-related factors. A systematic review on the determinants of new drug diffusion provides guidance for the control variables considered here and their expected signs (Lublóy 2014). Control variables were considered only if either prior research or industry experts suggested that they may be associated with early adoption. Table 3 provides an overview of the 17 control variables.
Table 3. Time-independent covariates: definitions and descriptive statistics for 318 specialists (SP), with proportional and per patient values calculated over the two-year period 2010–11
Variable Description Data
source Mean Min. Max. St.
dev.
Socio-demographic characteristics gender
gender of the SP (in percentages) male
OHAAP
47.80
female 52.20 n/a
age age of the SP (as of December 2013) 51.92 32.00 78.00 9.94
training location location of university where the first medical degree was earned (in percentages)
capital
OHAAP
34.28
n/a
southwest 19.81
northeast 22.96
southeast 16.04
overseas 6.92
Scientific orientation number of
specialties number of specialties earned by the SP OHAAP 1.78 1 4 0.78 publication record number of publications by the SP (between January 2009
and June 2013) ComFit 2.07 0 136 9.26
position
position of the SP (in percentages)
high ((deputy) head of hospital department or outpatient centre)
OHAAP
22.30
medium (chief physician) 33.30 n/a
low (associate professor or physician) 44.30 scientific
commitment
dummy variable for HDA board membership, HDA award
receivership, or chief editorship HDA 0.04 0 1 n/a
Prescribing characteristics prescribing
intensity mean number of prescription initiations per patient
DoktorInfo
12.71 4.63 30.93 3.72 portfolio width number of brands prescribed for patients in shared care 16.66 4 25 4.13 insulin ratio prescriptions initiating treatment with insulin (in
percentages) 79.10 0.00 100.00 20.84
old A10B ratio prescriptions initiating treatment with A10Bs introduced
before April 2008 (in percentages) 2.99 0.00 33.33 4.66
Patient characteristics
age age of patients on the SP’s patient panel
DoktorInfo
64.20 44.00 72.87 2.84 health status patients with comorbidities on the SP’s patient panel (in
percentages) 45.25 0.00 100.00 21.94
Practice characteristics
number of patients number of the SP’s T2DM patients whose care is shared with GPs
DoktorInfo
123.48 14 784 114.71 number of referring
GPs number of GPs with whom the SP share cares patients 21.56 1 84 15.95 number of
consultations
mean number of consultations per patient resulting in
confirmation or change of prescription by the SP 1.68 1.00 2.85 0.37 proportion of loyal
patients patients consulting the same SP (in percentages) 70.77 17.54 100.00 19.76
Source: authors.
3. RESULTS
The 318 physicians analysed here accounted for roughly 80 per cent of the specialists who treated T2DM on a daily basis. They were 52 years old, on average, and 48 per cent were male (see Table 3 for basic statistics). The 33,448 patients in the sample received 499,131 specialist medication prescriptions from their general practitioners. A typical specialist suggested therapies for 123.48 patients and asked general practitioners to write 1,570 prescriptions—12.71 prescriptions per patient.
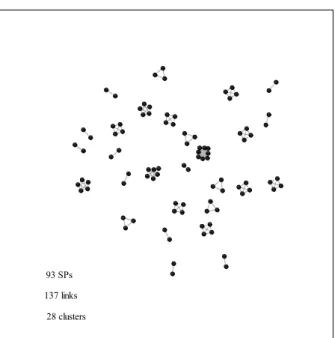
The three social networks serving as channels of interpersonal communication, and thus allowing for social contagion, are displayed in Figure 1. Geographically close colleagues form the densest social network with social interactions among colleagues being hypothesized. One part of these relationships is undeniable and intense—colleagues working in the same medical centre surely exchange ideas regularly. Although the network of classmates and scientific collaborators are sparser and have more cliques, the interactions within these social networks are direct.
Figure 1. Social networks of specialists: (a) geographically close colleagues – 35 kms; (b) former classmates at Semmelweis University; and (c) scientific collaborators
(a) (c)
318 SPs 4 856 links 12 clusters
90 SPs 151 links
14 clusters
(b)
The regression results for the independent variables for the 11 study drugs are shown in Table 4. In the table exp(γ)s are shown—hazard ratios between two specialists when the values of the respective variables differ by one unit, all other covariates being held constant. Variables with exp(γ)s larger than one are associated with increased hazard—the higher the variable, the higher the hazard of the event. The regression results for the control variables for the 11 study drugs are shown in Table 5. In the table exp(β)s are shown.
Table 4. The Cox model regression results for the independent variables
Former classmates
Scientific collaborators
Geographically close colleagues
35 km 28 km 42 km
Actos 0.999 0.969† 1.091*** 1.077*** 1.085***
Byetta 0.869† 0.782 1.170† 1.148† 1.162 Competact 0.985 1.002 1.047* 1.029 1.047† Eucreas 1.000 1.010 1.033* 1.034** 1.035*
Galvus 1.026* 0.968 1.051** 1.045** 1.057**
Janumet 0.988 1.002 1.033* 1.037* 1.039*
Januvia 0.987† 0.971* 1.042** 1.039** 1.040**
Onglyza 0.979 0.882* 0.936 0.967 0.912
Velmetia 1.005 1.041* 1.011 1.013 1.013
Victoza 0.997 1.045 0.984 1.000 0.980
Xelevia 1.012 0.957 1.014 0.998 1.017
Source: authors.
93 SPs 137 links
28 clusters
† p<0.1; * p<0.05; ** p<0.001; *** p<0.0001
The table shows the values for exp(γ), the ratio of hazards. If exp(γ) is larger than one, then the probability of a specialist adopting the new antidiabetic drug increases if the value of the respective social contagion measure increases
by one unit, all other covariates being held constant.
The social influence from colleagues within a 35-kilometer radius is a partially important predictor of new drug uptake— at the 95 per cent-confidence level the adoption ratio is positively associated with the likelihood of initial adoption for six brands. Counterintuitively, former classmates significantly delay the diffusion process for one brand and scientific collaborators for three brands.
Among the rest, exchanges within social networks do not influence significantly the likelihood of initial adoption.
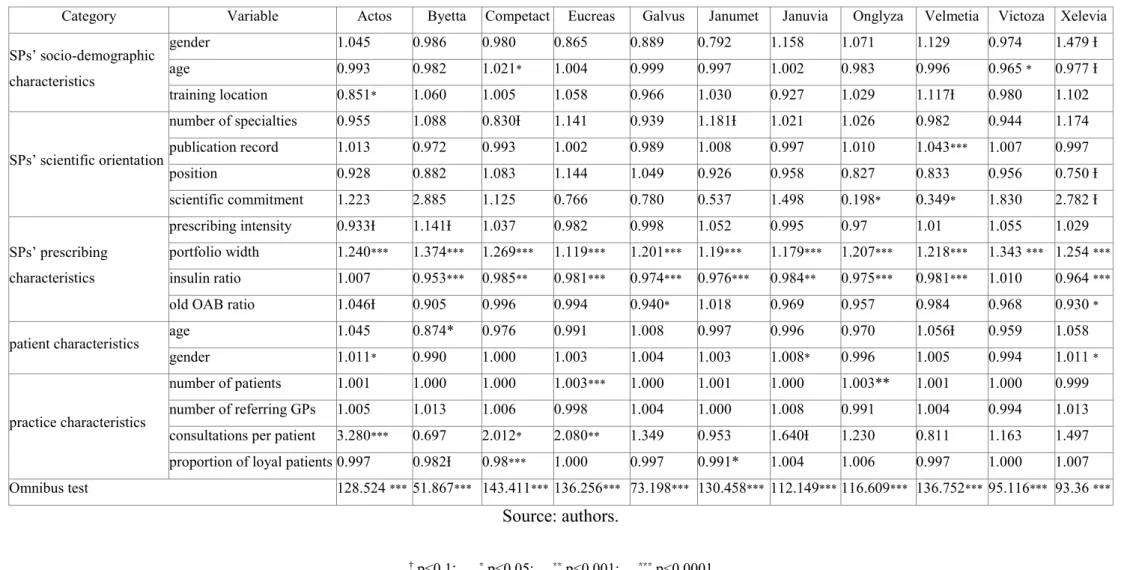
At the 95 per cent-confidence level, two control variables produce consistent predictions of early adoption (Table 5). The number of brands individual specialists prescribe is a very influential predictor of new drug uptake. The wider the prescribing portfolios, the earlier specialists initiate new therapies, for all 11 brands, whereas the ratio of prescriptions for insulin is significantly negatively associated for nine brands. The rest of the control variables do not produce consistent prediction of new drug uptake: they are never associated with the likelihood of initial adoption for more than three brands.
Table 5. The Cox model regression results for the control variables (results without contagion measures)
Category Variable Actos Byetta Competact Eucreas Galvus Janumet Januvia Onglyza Velmetia Victoza Xelevia SPs’ socio-demographic
characteristics
gender 1.045 0.986 0.980 0.865 0.889 0.792 1.158 1.071 1.129 0.974 1.479 Ɨ
age 0.993 0.982 1.021* 1.004 0.999 0.997 1.002 0.983 0.996 0.965 * 0.977 Ɨ
training location 0.851* 1.060 1.005 1.058 0.966 1.030 0.927 1.029 1.117Ɨ 0.980 1.102
SPs’ scientific orientation
number of specialties 0.955 1.088 0.830Ɨ 1.141 0.939 1.181Ɨ 1.021 1.026 0.982 0.944 1.174 publication record 1.013 0.972 0.993 1.002 0.989 1.008 0.997 1.010 1.043*** 1.007 0.997
position 0.928 0.882 1.083 1.144 1.049 0.926 0.958 0.827 0.833 0.956 0.750 Ɨ
scientific commitment 1.223 2.885 1.125 0.766 0.780 0.537 1.498 0.198* 0.349* 1.830 2.782 Ɨ
SPs’ prescribing characteristics
prescribing intensity 0.933Ɨ 1.141Ɨ 1.037 0.982 0.998 1.052 0.995 0.97 1.01 1.055 1.029 portfolio width 1.240*** 1.374*** 1.269*** 1.119*** 1.201*** 1.19*** 1.179*** 1.207*** 1.218*** 1.343 *** 1.254 ***
insulin ratio 1.007 0.953*** 0.985** 0.981*** 0.974*** 0.976*** 0.984** 0.975*** 0.981*** 1.010 0.964 ***
old OAB ratio 1.046Ɨ 0.905 0.996 0.994 0.940* 1.018 0.969 0.957 0.984 0.968 0.930 * patient characteristics age 1.045 0.874* 0.976 0.991 1.008 0.997 0.996 0.970 1.056Ɨ 0.959 1.058
gender 1.011* 0.990 1.000 1.003 1.004 1.003 1.008* 0.996 1.005 0.994 1.011 *
practice characteristics
number of patients 1.001 1.000 1.000 1.003*** 1.000 1.001 1.000 1.003** 1.001 1.000 0.999 number of referring GPs 1.005 1.013 1.006 0.998 1.004 1.000 1.008 0.991 1.004 0.994 1.013 consultations per patient 3.280*** 0.697 2.012* 2.080** 1.349 0.953 1.640Ɨ 1.230 0.811 1.163 1.497 proportion of loyal patients 0.997 0.982Ɨ 0.98*** 1.000 0.997 0.991* 1.004 1.006 0.997 1.000 1.007 Omnibus test 128.524 *** 51.867*** 143.411*** 136.256*** 73.198*** 130.458*** 112.149*** 116.609*** 136.752*** 95.116*** 93.36 ***
Source: authors.
† p<0.1; * p<0.05; ** p<0.001; *** p<0.0001
The table shows the values for exp(β), the ratio of hazards. If exp(β) is larger than one, then the probability of a specialist adopting the new antidiabetic drug increases if the value of the covariate increases by one unit, all other covariates being held constant.
4. DISCUSSION AND POLICY IMPLICATIONS
The findings reveal that social contagion among geographically close colleagues is ambiguous—
geographically close colleagues do not exert a significant influence on the initial adoption in around half of the cases, whereas they might do so in the other half. This finding contradicts prior research reporting that the estimated effect of social contagion among general practitioners in geographic proximity is positive and significant even after controlling for time trends and marketing efforts (Liu – Gupta 2012; Manchanda et al. 2008). However, prior research assessed only one innovative study drug which became widely accepted shortly after its introduction among highly penetrated general practitioners in a smaller and more closed geographic region. Most probably the efficiency of drug sales representatives, the novelty and overall acceptance of the new drug, the penetration of doctors, and the characteristics of the geographic region all play a role in whether contagion among geographically close colleagues is indeed in force.
Furthermore, this article finds no empirical evidence for the hypothesized influential roles of former classmates and scientific collaborators. In a few cases, these had even delayed diffusion. Although former classmates know each other personally, they tend to discuss professional matters irregularly and might not be tied equally strong. A few classmates might be very influential, whereas the majority of them are not. Even if scientific collaborators exchange ideas regularly, their networks are small, sparse, and temporal which evidently hinders the diffusion process. Moreover, scientific collaborators with distinct affiliations most likely exchange ideas via e-mail—written communication offers less opportunity for sharing experience about a newly introduced drug than oral communication.
In new drug diffusion data-driven social network analysis provides only limited practical benefits for pharmaceutical companies and healthcare politicians. Although it is easier and cheaper to construct the three social networks studied here than it is to construct survey-based networks, the added value is low—they do not help accelerating the diffusion process. Regardless how time consuming and costly survey-based contagion measures are, their construction is inevitable in exploiting the social influence among doctors in new drug diffusion. The role of data-driven analysis in new drug diffusion, however should not be underrated. Data-driven analysis plays a pivotal role in mining large-scale prescription claims databases. Vast empirical evidence shows that the higher the prescribing volume in total or in the therapeutic class of a new drug, the higher the likelihood of early adoption of that new drug (Lublóy 2014). Thus, identifying doctors prescribing the most and having the largest potential of exerting influence on new drug uptake through peer pressure is of major
importance which requires data-driven approaches.
This article has several possible limitations. First and foremost, prescription data is incomplete.
specialists’ prescribing behaviours are monitored through the reported prescription data by general practitioners with whom specialists share patient care. Second, the marketing efforts of pharmaceutical companies targeted at physicians are not accounted for. Had we controlled for marketing efforts, we might have found social contagion among physicians in geographic proximity even less influential. Third, the contagion measure based on geographic proximity captures interpersonal effects indirectly—one cannot validate whether geographically close physicians exchange ideas regularly, if at all. Fourth, conclusions based on only one therapeutic class cannot be generalized—future research may incorporate multiple therapeutic classes.
5. CONCLUSIONS
This article investigated whether data-driven social network analysis might support pharmaceutical companies and healthcare politicians in influencing the uptake of innovations. Several hundred thousands of prescription data was combined with social network data extracted from administrative databases. The large-scale archival dataset of specialists’ actual prescribing behaviours and the three contagion measures avoided several statistical biases usually related to retrospective surveys—for example, confounding bias, sample selection bias, and recall bias.
First, this article showed that social contagion among geographically close colleagues is ambiguous—
geographically close colleagues do not exert significant influence on the initial adoption in around half of the cases, whereas they might do so in the other half. This finding contradicts prior research reporting that the adoption ratio of geographically close colleagues is significantly associated with the likelihood of initial adoption. Future research may examine which factors determine whether contagion among geographically close colleagues is indeed in force. Second, this article found no empirical evidence for social contagion among former classmates and scientific collaborators.
In sum, data-driven social network analysis is of limited use—contagion measures extracted from administrative and bibliographic databases do not support pharmaceutical companies and healthcare politicians in exerting influence on new drug uptake. In new drug diffusion, data-driven analysis should focus on mining large-scale prescription claim databases and identify doctors prescribing the most in the therapeutic class of the new drug. Doctors with higher prescribing volumes shall than be
targeted by drug sales representatives once their social network is appropriately mapped.
References
Acedo, F.J. – Barroso, C. – Casanueva, C. – Galán, J.L. (2006): Co-Authorship in Management and Organizational Studies: An Empirical and Network Analysis. Journal of Management Studies 43(5): 957–983.
Alemi F. (2015): Foreword to special issue on health analytics. Health Care Management Science 18(1): 1-2.
Bajaj, Y. (2012): Can Online Physician networks improve patient care? http://healthradii.com/can- online-physician-networks-improve-patient-care/, accessed 8 May 2014.
Van Den Bulte, C. – Lilien, G. L. (2001): Medical innovation revisited: Social contagion versus marketing effort. American Journal of Sociology 106(5): 1409–1435.
Chauhan, D. – Mason, A. (2008): Factors affecting the uptake of new medicines in secondary care-a literature review. Journal of Clinical Pharmacy and Therapeutics 33(4): 339–348.
Coleman, J. S. – Katz, E. – Menzel, H. (1966): Medical innovation: A diffusion study. New York:
Bobbs-Merrill Company.
Cox, D. R. (1972): Regression models and life tables. Journal of the Royal Statistical Society B. 34(2):
187–220.
Dahl, M. S. – Pedersen, C. Ø. (2004): Knowledge flows through informal contacts in industrial clusters: myth or reality? Research policy 33(10): 1673-1686.
Dunn A. G. – Braithwaite J. – Gallego, B. – Day, R. O. – Runciman, W. – Coiera, E. (2012): Nation- scale adoption of new medicines by doctors: an application of the Bass diffusion model. BMC Health Services Research 2012(12): 248.
EMA (2014): European Medicines Agency, Human Medicines.
http://www.ema.europa.eu/ema/index.jsp?curl=pages/medicines/landing/epar_search.jsp&m id=WC0b01ac058001d124, accessed 10 June 2014.
Garson, G. D. (2013): Cox Regression: 2013 Edition (Statistical Associates Blue Book Series).
Asheboro: Statistical Associates Publishers.
Glänzel, W. – Schubert, A. (2005): Analysing scientific networks through co-authorship. In: Moed, H. F. – Glänzel, W. – Schmoch, U. (eds): Handbook of quantitative science and technology research. Dordrecht: Springer Netherlands, pp. 257–276.
Greenhalgh, T – Robert, G. – Bate, P. – Macfarlane, F. – Kyriakidou, O. (2005): Diffusion of Innovations in Health Service Organisations: a Systematic literature review. Oxford:
Blackwell Publishing Ltd.
Iyengar, R. – Van Den Bulte, C. – Valente, T. W. (2011): Opinion Leadership and Social Contagion in New Product Diffusion. Marketing Science 30(2): 195–212.
Lin, S. – Jan, K. – Kao, J. (2011): Colleague interactions and new drug prescribing behavior : The case of the initial prescription of antidepressants in Taiwanese medical centers. Social Science
& Medicine 73(8): 1208–1213.
Liu, Q. – Gupta, S. (2012): A micro-level diffusion model for new drug adoption. Journal of Product Innovation Management 29(3): 372–384.
Lublóy, Á. (2015): Factors affecting the uptake of new medicines: a systematic literature review.
BMC Health Services Research 14: 469.
Manchanda, P. – Honka, E. (2005): Effects and role of direct-to-physician marketing in the pharmaceutical industry: an integrative review. Yale Journal of Health Policy, Law, And Ethics 5(2): 785–822.
Manchanda, P. – Xie, Y. – Youn, N. (2008): The role of targeted communication and contagion in product adoption. Marketing Science 27(6): 961–976.
Mason, A. (2008): New medicines in primary care: a review of influences on general practitioner prescribing. Journal of Clinical Pharmacy and Therapeutics 33(1): 1–10.
McGettigan, P. – Golden, J. – Fryer, J. – Chan, R. – Feely, J. (2001): Prescribers prefer people: The sources of information used by doctors for prescribing suggest that the medium is more important than the message. British Journal of Clinical Pharmacology 51(2): 184–189.
Østergaard, C. R. (2009): Knowledge flows through social networks in a cluster: Comparing university and industry links. Structural Change and Economic Dynamics 20(3): 196-210.
Prosser, H. – Walley, T. (2006): New drug prescribing by hospital doctors: the nature and meaning of knowledge. Social Science & Medicine 62(7): 1565–1578.
Wen, Y. W. – Huang, W.F. – Lee, Y. C. – Kuo, K. N. – Tsai, C. R. – Tsai, Y. W. (2011): Diffusion patterns of new anti-diabetic drugs into hospitals in Taiwan: the case of Thiazolidinediones for diabetes. BMC Health Services Research 2011(11): 21.
Wong, K. (2014): From classmate to colleague.
http://www.chiroeco.com/chiropractic/news/9266/1028/from-classmate-to-colleague/, accessed 8 April 2014.