Recent Advances in Solar-Driven Carbon Dioxide Conversion: Expectations versus Reality
Jie He and Csaba Janáky*
Cite This:ACS Energy Lett.2020, 5, 1996−2014 Read Online
ACCESS
Metrics & More Article Recommendations*
sı Supporting InformationABSTRACT: Solar-driven carbon dioxide (CO2) conversion to fuels and high-value chemicals can contribute to the better utilization of renewable energy sources. Photosynthetic (PS), photocatalytic (PC), photoelectro- chemical (PEC), and photovoltaic plus electrochemical (PV+EC) approaches are intensively studied strategies. We aimed to compare the performance of these approaches using unified metrics and to highlight representative studies with outstanding performance in a given aspect. Most importantly, a statistical analysis was carried out to compare the differences in activity, selectivity, and durability of the various approaches, and the underlying causes are discussed in detail. Several interesting trends were found: (i) Only the minority of the studies present comprehensive metrics.
(ii) The CO2reduction products and their relative amount vary across the different approaches. (iii) Only the PV+EC approach is likely to lead to
industrial technologies in the midterm future. Last, a brief perspective on new directions is given to stimulate discussion and future research activity.
C
arbon dioxide (CO2) is one of the main greenhouse gases contributing to global climate change.1Accord- ing to the National Oceanic and Atmospheric Administration (United States), the global mean CO2 level reached 410 ppm in 2019.2 To cope with climate challenge, more than 170 nations signed the Paris agreement in 2016, committing tofight climate change by cutting CO2emissions.3 Such a political ambition requires a paradigm shift, supported by technological breakthroughs. One such change is to consider CO2 as an abundant carbon source, instead of a pollutant. The turn-waste-into-wealth strategy will certainly play a key role in the green transformation of the chemical industry.4−6 There are numerous routes to convert CO2 to fuels and other chemicals. From the overall energy payback perspective, however, the most promising methods are those employing renewable energy. In this Focus Review, we focus on solar energy, which is regarded as a clean, abundant, and free renewable energy source. About 10% of the solar energy received on 0.3% of the Earth’s surface would be enough to fulfill the expected energy needs in 2050.7 Therefore, the combination of solar energy utilization and CO2resources can be expected to produce fuels as well as value-added chemicals.Moreover, beyond their cost-effectiveness, such processes are environmentally friendly and carbon-neutral.8
The conversion of CO2 can lead to several different chemical/fuel products depending on the materials and/or methods employed, including carbon monoxide (CO), formic acid (HCOOH), methane (CH4), methanol (CH3OH), ethylene (C2H4), ethane (C2H6), propane (C3H8), ethanol (CH3CH2OH), acetic acid (CH3COOH), acetone, n-prop- anol, acetaldehyde, allyl alcohol, dimethyl ether, glycolalde- hyde, hydroxyacetone, ethylene glycol, propionaldehyde, and glycerol.9 Although the carbon content of these products, at the current production level, accounts for only a fraction of the emitted CO2,10 the concept of solar-driven CO2 can be extended to fuel production in the future (especially for aviation where high energy density is inevitable), which accounts for a much larger carbon footprint.5
Since the discovery of photoinduced reduction of CO2 on semiconductors,11 enormous research efforts have been devoted to the solar-driven conversion of CO2, and thefield has witnessed a renaissance in the past few years.7,8,12−30We
Received: March 23, 2020 Accepted: May 15, 2020 Published: May 15, 2020
Focus Review
http://pubs.acs.org/journal/aelccp
License, which permits unrestricted use, distribution and reproduction in any medium, provided the author and source are cited.
Downloaded via UNIV OF SZEGED on September 7, 2020 at 13:25:54 (UTC). See https://pubs.acs.org/sharingguidelines for options on how to legitimately share published articles.
collected the number of papers published between 2014 and 2019 from the Web of Science database. There is a 3-fold increase in the number of published papers since 2014 (Figure 1), indicating the continuously growing research interest.
In fact, this trend also follows the policy orientation of national governments and international funding agencies. Energy-X5 and Sunrise31 started as independent projects, supported by the European Union’s Horizon 2020 research and innovation program, focusing on the science and technology enabling efficient conversion of solar energy into chemicals. They are now merged into the “SUN-ERGY” program, to join forces under the umbrella of Horizon Europe, also in line with the Solar-Driven Chemistry Initiative of the European Chemical Society (EuChemS).32In the United States, the Joint Center for Artificial Photosynthesis (JCAP) was established in 2010, aiming tofind new and effective ways to produce fuels using only sunlight, water, and CO2. It is the largest research program in the United States dedicated to the advancement of solar-fuels generation science and technology.33Other national programs are being implemented around the world, focusing on both fundamental science and technology development.
Considering the current momentum of the field and the expectations of the funders (ultimately the society), there is a need to scrutinize the recent scientific and technological
achievements. This exercise can shed light on what is competitive (and what remains in the land of promise) and also help to identify the most promising directions for newcomers to the field. There are a lot of books, book chapters, and review articles focusing on solar-driven CO2 reduction topics, and the aim of this Focus Review is not to repeat such information. In contrast, our approach is to compare precedent results, based on metrics that can be employed as overarching benchmarks through the various solar-driven CO2 conversion technologies. In addition, we highlight a few studies in which outstanding performances were achieved for a given metric.
Dif ferent Solar-Driven CO2 Conversion Approaches. Solar- driven CO2 conversion methods can be categorized into biophotosynthetic, photothermal, microbial-photoelectro- chemical, photosynthetic (PS), photocatalytic (PC), photo- electrochemical (PEC), photovoltaic plus electrochemical (PV +EC), etc. The classification and definitions of solar-driven CO2conversion approaches involved in this review article are summarized inTable 1. The schematic illustrations of these systems together with the operational principles are also shown inFigure 2. Biophotosynthetic CO2conversion mimics natural photosynthesis and therefore usually involves redox enzyme molecules as photocatalysts or artificial microbes for photo- synthesis.34−40 The photothermal CO2 conversion approach uses high-temperature solar reactors, typically concentrated solar radiation, to split CO2, potentially offering high product formation rate.41−50Microbial PEC CO2conversion combines the advantages of semiconductor nanodevices and the high- selectivity biocatalysts, directly converting CO2 into fuels or chemicals.51−53 Among the above-mentioned pathways, PS, PC, PEC, and PV+EC approaches are more commonly studied, because they are mostly carried out under relatively mild conditions, such as low temperature and ambient pressure. These strategies will be discussed in detail later;
here, only a brief overview is provided.
Figure 1. Number of papers published in the years of 2014−2019.
Data collected from Web of Science Core Collection on 2020-03- 06; topic: (photo* or solar) and (CO2 or carbon dioxide) and (conversion or reduction).
Table 1. Classifications and Definitions of Solar-Driven CO2Conversion Approaches
category definition
Biophotosynthetic An approach that mimics natural photosynthesis, which usually involves redox enzyme molecules as photocatalysts or artificial microbes for photosynthesis
Photothermal An approach that uses high-temperature solar reactors, typically employing concentrated solar radiation, to split CO2, potentially utilizing the entire solar spectrum and offering high product formation rate
Microbial-
photoelectrochemical
Combines the advantages of semiconductor photoelectrodes and the high-selectivity microbe-based biocatalysts, directly converting CO2into fuels or chemicals
Photosynthetic and photocatalytic (PS/
PC)
Two sister approaches using particulate or molecular photocatalysts, either in solution or immobilized on a surface. This category includes both PC (ΔG< 0) and PS (ΔG> 0) processes, depending on the oxidation half reaction. Because of many similarities, they are discussed together herein, but in the light-to-fuel efficiency comparison (Figure 9b), only PS processes were selected to ensure fair comparison.
Photoelectrochemical (PEC)
Either one or both electrodes of the electrochemical cell is/are semiconductor photoelectrode(s). Photogenerated charge carriers drive either one or both half reactions. We included studies using the“buried junction”concept here, where a solar cell is covered by one or more catalyst(s) (and possibly a protecting layer) and this whole assembly acts as a photoelectrode.
Photovoltaic plus electrochemical (PV +EC)
The combination of PV cells with CO2electrolysis in one device. This approach decouples the light-harvesting and the electrochemical conversion steps.
Our approach was to compare prece- dent results, based on metrics which can be employed as overarching
benchmarks through the various solar-
driven CO
2conversion technologies.
There are many studies using sunlight to convert CO2over molecular or semiconductor photocatalysts, the so-called photosynthetic (PS) and photocatalytic (PC) processes.
Notably, relevant chemical literature often does not differ- entiate between these two, although these reactions differ in their thermodynamics. PC processes are thermodynamically downhill (ΔG< 0) and are purely accelerated by the catalyst, whereas PS processes are thermodynamically unfavorable (ΔG
> 0) and require photochemical energy input to occur. When CO2reduction is paired with the oxygen evolution reaction, it is an uphill reaction (ΔG> 0); thus, it should be defined as a PS process.54,55 In contrast, if it is coupled with an anode process where a hole-scavenger is present, it can indeed be a PC process. This distinction is important, because there are different descriptors defining the performance in the two scenarios.54 While similar solar light harvesting, charge separation, and transportation processes occur, the surface reactions and recombination are very different in the two cases.19,55,56 Because of the many similarities, they are discussed together herein, except for the light-to-fuel conversion efficiency comparison.
Although hundreds of photocatalysts are reported yearly to demonstrate their effectiveness, many of these studies suffer from fundamental problems. Most of these studies focus only on the reduction part of the process such as the transformation of CO2to CO, CH4, and HCOOH, but the coupled oxidation process (the other half of the story) is seldom discussed in
detail. It has been a common practice to include sacrificial electron donors such as triethanolamine in a PC reaction to overcome both thermodynamic and kinetic limitations of the oxidation process. This practice, however, requires careful attention: (1) the process should be defined as PC rather than PS (see above); (2) the reported light-to-fuel conversion efficiencies might be inaccurate; (3) the oxidation of sacrificial donors may contribute to the products that are being considered as CO2-reduction products. There are at least two possible ways how a sacrificial donor can“contribute” to assumed CO2-reduction products: either the oxidation of the sacrificial electron donors directly produces C1products, or the radical intermediates produced in the oxidation process have reductive abilities, which help to convert CO2. Therefore, if applied, it is very important to evaluate the fate of these sacrificial donors and their contributions to the overall yield of the products in the PC CO2reduction reactions.57,58
Compared with the particle suspension-based PS and PC process, the photoelectrode-based PEC reduction of CO2can integrate the advantages of photosynthesis and electro- catalysis.59Based on which electrode acts as the light absorber, three different PEC configurations can be envisioned:
photocathode−dark anode (shown in Figure 2e as an example), photoanode−dark cathode, and photocathode− photoanode. The fact that each photoelectrode can consist of multiple absorber layers to better cover the solar spectrum complicates the picture further. A sophisticated variant is the Figure 2. Schematic illustration of (a) biophotosynthetic, (b) photothermal, (c) microbial-photoelectrochemical, (d) photosynthetic and photocatalytic (PS/PC), (e) photoelectrochemical (PEC), and (f) photovoltaic plus electrochemical (PV+EC) approaches for CO2
conversion.
“buried junction”concept, where a solar cell is covered by one or more catalyst(s) (and possibly a protecting layer) and this whole assembly acts as a photoelectrode.60−63
Development in photovoltaic (PV) technologies over the past 5−10 years is eye-catching, with the record of light-to- electrical power conversion efficiency (PCE, which is the ratio between the incident solar photon energy and the electrical energy output) being continuously renewed.64 For example, the silicon-based single-junction PV cell could achieve the PCE of 26.7%; the III−V single-junction cells, such as GaAs, reached the PCE of as high as 29.1%, while the burgeoning perovskite-based cells could also achieve 21.6%. The multi- junction cells, such as AlGaInP/AlGaAs/GaAs/GaInAs further increased the PCE to 47.1%.65,66What is equally important, with the rapid growth of the PV industry, the price of the Si- based PV cells has declined sharply.67 Therefore, these low- cost and reliable silicon-based PV modules are widely available.
PV cells can be combined with an electrolyzer, thus decoupling the light-harvesting (current generation) and the electro- chemical conversion steps (PV+EC system). For the PV+EC systems discussed in this Focus Review, we excluded those studies where a solar cell covered by a catalyst acts as a photoelectrode for one half reaction (those are discussed in the PECfield). Only those scenarios are considered where the PV panel is the sole supplier of the electrochemical bias, and the CO2conversion takes place on an electrode wired to the PV cell.63The separation of the optical and electrical components allows a greater selection of materials and eliminates concerns of processing compatibilities and solution stability of the light- active components. Furthermore, in principle, it allows the use of high-quality (and expensive) electrocatalysts, because of the much higher operational current densities. This strategy has
been successfully applied for water splitting to produce hydrogen. The price of renewable hydrogen has dropped to about €3.23 kg−1 considering the parameters relevant to Germany, which is already competitive with small and medium-size operations of conventional, fossil fuel-based processes. Considering the trend in the cost, €2.50 kg−1 seems realistic within a decade, which will be competitive with petrochemical approaches.63 We envision similar opportunities for PV+EC CO2 conversion, once mature electrolyzer technologies will be available.
Performance Metrics for PS/PC, PEC, and PV+EC Approaches.
As data-mining becomes a major component of every research project, it is now more important than ever to report experimental data (and the drawn conclusions) in a manner that comparisons among laboratories can be easily made.68 While analyzing the papers from the past 5 years, we collected a broad set of performance metrics (Table 2), to see which ones allow the most meaningful comparisons for PS/PC, PEC, and PV+EC studies.
Activity, selectivity, and durability are usually the main three aspects to evaluate the performance of different solar-driven CO2 conversion approaches. In PS/PC studies, product formation rate is the most commonly reported metric for evaluating the activity. In most cases, the formation rate is normalized over the weight of the catalyst or the geometrical area if it is immobilized on a substrate. Products, however, may vary in different catalytic systems. It is a worthwhile exercise to normalize the formation rate with the reaction stoichiometry (i.e., numbers of electrons transferred in the reaction); thus, comparisons can be reasonably made among different products (such analysis will be shown later). Quantum efficiency (QE) is another important component of the light-to-fuel efficiency, Table 2. Summarized Performance Metrics for PS/PC, PEC, and PV+EC Systems
PS/PC PEC PV+EC
Performance metrics Formation rate Formation rate (current density) Formation rate (current density) Conversion
Potential/voltage Potential/voltage
Turnover number (TON)
Selectivity Selectivity (Faradic efficiency, FE) Selectivity (Faradic efficiency, FE) Quantum efficiency (QE) Solar-to-fuel conversion efficiency (SFE) Solar-to-fuel conversion efficiency (SFE) Durability Incident photon-to-current conversion efficiency (IPCE) Durability
Absorbed photon-to-current conversion efficiency (APCE) Durability
Table 3. Selected Studies on PS/PC CO2Conversion
PS catalyst illumination conditions
reactant/
solution products QE (%)
selectivity (%)
formation rate normalized (mmol e−gcat−1h−1)
maximum test time (h) ref.
Surface S and Br modified CoO/Co3O4
300 W Xe lamp, IR waterfilter, 500 mW cm−2
H2O CH4 2.3 at 405 nm
98 ∼80 9 99
CuIn5S8single-unit-cell layers
AM 1.5Gfilter,λ≥400 nm,∼50 mW cm−2
H2O CH4 0.79 100 0.0696 120 100
(Ag@Cr)/Ga2O3 400 W high-pressure mercury
lamp with a quartzfilter H2O CO 85.2 2.1 5 101
PC catalyst illumination
conditions reactant/solution products QE (%) selectivity
(%) formation rate normalized
(mmol e- gcat−1h−1) or TON maximum test time (h) ref.
Co−Co2P@
NPC
200 W white LED lamp
TEOA/H2O/MeCN, [Ru(bpy)3]Cl2·6H2O
CO 79.1 ∼70 18 102
RuP/C3N4 400 W Hg lamp,λ
> 400 nm
DMA/TEOA HCOOH 5.7 at
400 nm
TON > 1000 103
Iridium(III) complexes
Blue LED light, 0.43 mW cm−2
TEOA/MeCN CO 10 TON > 265 10 days 104
but it is not provided in all reports. For the PEC approach, the Faradaic efficiency (FE) is the most reported metric, often misleadingly interpreted as an activity descriptor. In addition, the onset potential of the reduction process (the potential/
voltage at which the product detection measurement was carried out) and the corresponding normalized current density are also important metrics to be reported. Solar-to-fuel conversion efficiency (SFE) is a key metric, which is less reported in PEC systems. Strictly speaking, SFE is applicable only if no external bias is employed. Incident photon-to- current conversion efficiency (IPCE) and absorbed photon-to- current conversion efficiency (APCE) can also reflect the efficiency from different aspects.69In PV+EC related systems, the performance metrics are similar to those of the PEC. The
operation points (including voltage and current density) are usually provided, and SFE is more commonly reported.
Recent Development in PS/PC CO2Conversion. In the past 5 years, numerous research articles have been published focusing on further improving the activity, selectivity, and durability for PS/PC CO2 reduction. There are also a lot of reviews and perspectives, such as a summary of photocatalyst develop- ment,7,8,16,20−22,24,27,28,70−91 design strategies for reac- tors,18,92,93 and the possibilities and challenges of solar fuel production.8,14,17,19,27,28,94−98 Here, we highlighted three studies on PS and PC CO2 conversion with outstanding performance in some regard (see bold values inTable 3).
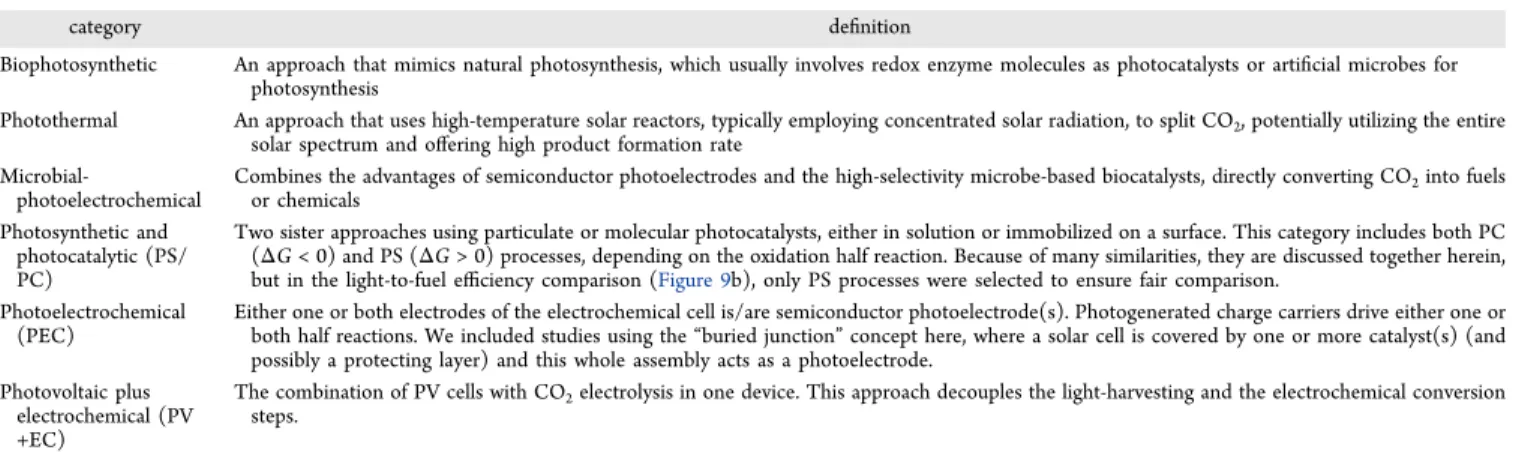
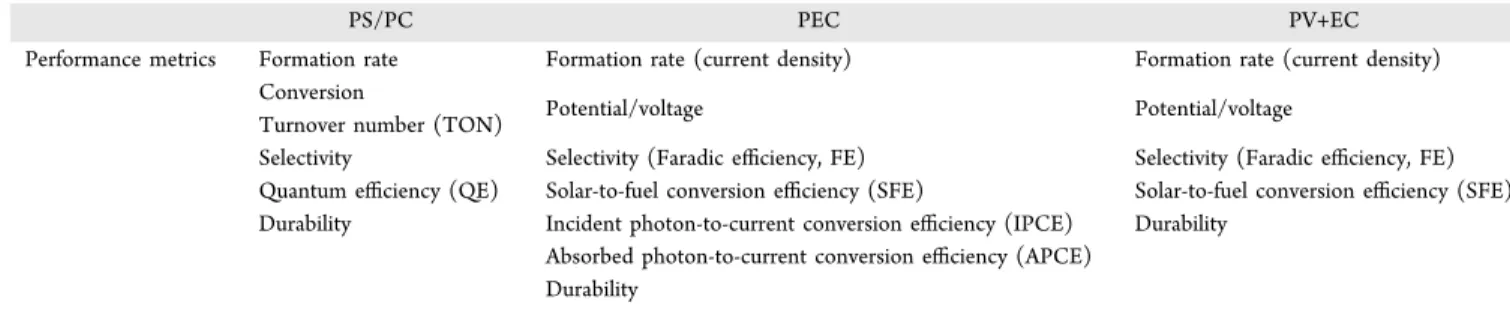
CO2 reduction to CH4 with high formation rate and selectivity was reported, when surface activated cobalt oxide nanoparticles were used as catalyst.99As shown inFigure 3a, Figure 3. (a) Schematic illustration of N-bromosuccinimide treated cobalt oxide nanoparticles and (b) CH4formation rate over catalysts with different surface treatments. Reprinted with permission from ref99. Copyright 2019 Royal Society of Chemistry. (c) Comparison of CO2reduction performances of different catalysts. Reprinted with permission from ref102. Copyright 2019 Wiley-VCH. (d) Schematic illustration of CO2reduction using a Ru complex/C3N4hybrid photocatalyst and (e) the turnover number of HCOOH production as a function of irradiation time using different photocatalysts and solvents. Reprinted with permission from ref103. Copyright 2019 Wiley- VCH. (f) The turnover number of CO evolution as a function of irradiation time over modified iridium(III) photocatalyst. Reprinted from ref104. Copyright 2017 American Chemical Society.
Figure 4. Statistical analysis of PS/PC CO2conversion studies: (a) product distribution, (b) normalized formation rate distribution, and (c) normalized formation rate distribution of different products.
treatment with N-bromosuccinimide resulted in the formation of Co3O4 with coordinated Br on the surface, therefore enhancing the catalytic efficiency. The formation rate of CH4
was further enhanced by surface modification with sulfur, reaching 10 mmol g−1 h−1 (normalized formation rate of 80 mmol e− g−1 h−1) with a QE of 2.3% at 405 nm and a selectivity of 98% (Figure 3b). In another study, a heterogeneous hybrid catalyst of Co and Co2P nanoparticles was embedded in carbon nanolayers codoped with N and P (activities shown in Figure 3c) which was combined with a homogeneous Ru-based complex photosensitizer, allowing high CO formation rate.102 In atomically thin layers of sulfur-deficient CuIn5S8 (containing charge-enriched Cu−In dual sites), the formation of a stable Cu−C−O−In intermediate at the Cu−In dual sites was the key feature
determining selectivity.100As a result, the CuIn5S8single-unit- cell layers achieved nearly 100% selectivity for visible-light- driven CO2 reduction to CH4, with a formation rate of 8.7 μmol g−1 h−1. A hybrid system of a ruthenium complex and carbon nitride (C3N4) was shown to selectively convert CO2to HCOOH (Figure 3d,e).103 As for molecular systems, terpyridine modifications of an iridium(III) photocatalysts with a combined 2-phenylpyridine (ppy) and 2,2′:6′,2″- terpyridine (tpy) ligand have been investigated and yielded a turnover number (TON) of up to 265 with a QE of 0.10 (Figure 3f).104 It is worth pointing out that this catalytic system showed high durability (over 10 day operation without obvious decay of activity).
To get a statistically validated picture of PS/PC CO2 conversion studies, 138 cases were analyzed among those Table 4. Selected Studies on PEC CO2Conversion
Photocathode−Dark Anode
cathode anode
illumination
conditions electrolyte
potential and
current density products FE (%) SFE (%)
maximum test time
(h) ref
Bi Nanosheets Graphite 1 Sun NaHCO3 −1.1 V vs RHE,18
mA cm−2
HCOOH ∼100 1.5 12 105
In0.4Bi0.6/MAPbI3 Pt 1 Sun KHCO3 −0.6 V vs RHE,
∼5.5 mA cm−2 HCOOH ∼100 1.5 106 TiO2-protected Cu2O−
Re(tBu-bipy)(CO)3Cl
Pt Xe lamp with KG 3 and AM 1.5 Gfilters
Re(tBu-bipy) (CO)3Cl and MeOH
−1.73 V vs Fc+/Fc,
∼1.5 mA cm−2
CO ∼100 5.5 107
Li-doped CuFeO2 Graphite 1 Sun pyridine acetate
buffer −0.63 V vs SCE,
∼0.6 mA cm−2 CH3OH 96.7 1.5 108
CuFeO2/CuO Pt 1 Sun KHCO3 0.15 V vs RHE,
∼1.5 mA cm−2
HCOOH >90 1−1.2 7 days 109
Photoanode−Dark Cathode
cathode anode
illumination
condition electrolyte potential and current density products FE (%)
SFE (%)
maximum test time (h) ref Pd/C-coated
Ti mesh
GaAs/InGaP/
TiO2/NiOx
1 Sun Anolyte: KOH;
catholyte: KHCO3
Cathode:∼−0.8 V vs Ag/
AgCl, 8.5 mA cm−2
HCOOH >94 ∼10 3 9
Figure 5. (a) SEM image of reduced mesoporous Bi nanosheets. Reprinted with permission from ref105. Copyright 2018 Wiley-VCH. (b) Full cell configuration containing In0.4Bi0.6-coated perovskite photocathode. Reprinted from ref106. Copyright 2019 American Chemical Society. (c) Schematic of the PEC CO2 reduction process involving protected Cu2O photocathodes and a Re-based molecular catalyst.
Reprinted with permission from ref107. Copyright 2015 Royal Society of Chemistry. (d) Changes inEcelland HCOOH production with a wired CuFeO2/CuO and Pt couple under illumination without external bias. Reprinted with permission from ref109. Copyright 2015 Royal Society of Chemistry. (e) The scheme of photoanode-dark anode configuration for CO2conversion. Reprinted from ref9. Copyright 2016 American Chemical Society.
papers published since 2014. The selection criterion was the availability of two or more of the important performance indicators in the study. The majority of these studies (>100) employed various sacrificial agents; therefore, they belong to the PC category. The results are shown in Figure 4. For the product distribution, only the major products (selectivity >
30%) of each study were counted. The most common products formed are CO and CH4, which together account for over 75%
of the major products. In addition, HCOOH and CH3OH also represent 9.4% and 8.7%, respectively. Other products, such as CH3COOH, C2H6, CH3CH2OH, and C3H8, were seldom reported as major products, which is consistent with the results in the selected studies we have highlighted. To transparently compare the activity of the catalysts in these studies, the reported formation rates have been normalized with the electron-transfer number of the given product, enabling comparisons among different products. Among the above 138 cases, 121 demonstrated unambiguous formation rate data, which were selected for the subsequent analysis. As shown in Figure 4b, the formation rates concentrated within a lower range of 0−0.5 mmol e−g−1h−1, accounting for about 50% of the studies. There are 4 cases reported formation rates ranging from 20 to 80 mmol e− g−1 h−1. We further analyzed the normalized formation rate distribution of different products (Figure 4c and Table S1). Only CO and CH4 have been produced with a formation rate greater than 20 mmol e−g−1 h−1. Interestingly, although almost 10% of the cases had HCOOH as the major product, most of them reported the formation rate lower than 5 mmol e− g−1 h−1. This pattern suggests that there is a greater chance of reoxidation of HCOOH to CO2 (back reaction on the very same catalyst, driven by the photogenerated holes), compared to that for the gas-phase products, which rapidly move away from the catalyst surface.
Recent Development in PEC CO2Conversion. The number of studies employing PEC CO2 conversion approach has also grown rapidly in the past 5 years. Some outstanding examples are highlighted inTable 4.
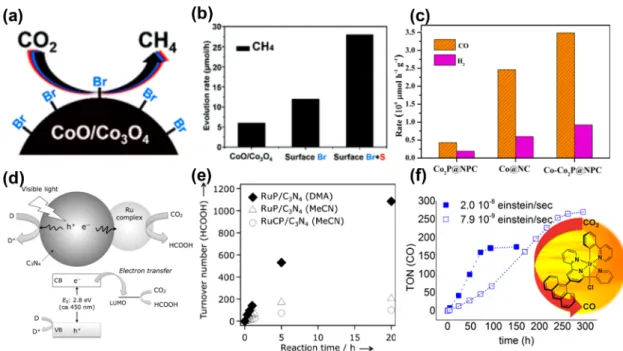
Mesoporous bismuth nanosheets have been prepared by the cathodic transformation of atomic-thick bismuth oxycarbonate nanosheets, which showed selective CO2reduction to HCOO− with high current density (−1.1 V vs RHE,∼18 mA cm−2, FE
≈100%) and operation stability (12 h). Moreover, Bi nanosheets were integrated with Ir/C dark anode in full cells and achieved a solar-to-formate conversion efficiency of 1.5%.
The CO2 reduction performance was rationalized by the 2D mesoporous nanosheet morphology with an enlarged surface, abundant under-coordinated Bi sites, and structural robustness (Figure 5a).105
The application of hybrid organic−inorganic and fully inorganic perovskites in PEC processes has also been a hot topic. For example, a novel photocathode was prepared by coating an In0.4Bi0.6 alloy layer on a MAPbI3 PV cell (as illustrated inFigure 5b), which achieved a current density of 5.5 mA cm−2at−0.6 V vs RHE, producing HCOOH at nearly 100% FE for 1.5 h.106A TiO2-protected Cu2O photocathode
was paired with a molecular rhenium bipyridyl catalyst. At
−1.73 V vs Fc+/Fc, the system showed a current density of
∼1.5 mA cm−2and FECOof nearly 100% (Figure 5c).107This kind of configuration is not a standard PEC system as we discussed above because the light absorber and active sites are
The selectivity toward a given product is a ff ected more by the electrode material and the PEC condition, rather than the product itself.
Figure 6. Statistical analysis of PEC CO2conversion studies: (a) product distribution, (b) FE distribution, (c) current density (under 1 Sun) distribution, and (d) FE distribution of different products.
separated, and the buried junction together with the external electric power provides the bias.
There are also reports on PEC CO2reduction to alcohols, for example, CH3OH was synthesized at a Li-doped CuFeO2 thin-film photocathode with a FECH3OHof 96.7% at−0.63 V vs SCE.108 Durability is another objective of the studies: a PEC cell, containing CuFeO2/CuO photocathode and Pt anode couples, could produce HCOOH for over 1 week at a solar-to- formate energy conversion efficiency of ∼1% (FE > 90%) without any external bias (Figure 5d).109CuFeO2/CuO bulk heterojunctionfilms were also capable of converting CO2into C1−C6 aliphatic acid anions under simulated sunlight in the absence of any sacrificial chemicals or electrical bias, which shows that larger molecules can also be formed via PEC C−C
coupling.110The photoanode−dark cathode configuration has also been heavily investigated. For example, a solar-driven CO2 reduction cell was constructed encompassing a tandem GaAs/
InGaP/TiO2/Ni photoanode, a Pd/C nanoparticle-coated Ti mesh cathode,9 and a bipolar membrane to allow for steady- state operation with a separate catholyte and anolyte. At the operational current density of 8.5 mA cm−2 without external bias, the cathode exhibited <100 mV overpotential and >94%
FE for the reduction of CO2to formate with SFE as high as 10%.
What is common in most of the highlighted studies is the very high selectivity. Note that almost 100% FE was reported for three different products (CO, HCOOH, and CH3OH). To further elaborate on this matter, statistical analysis of the PEC CO2conversion studies has also been conducted (Figure 6).
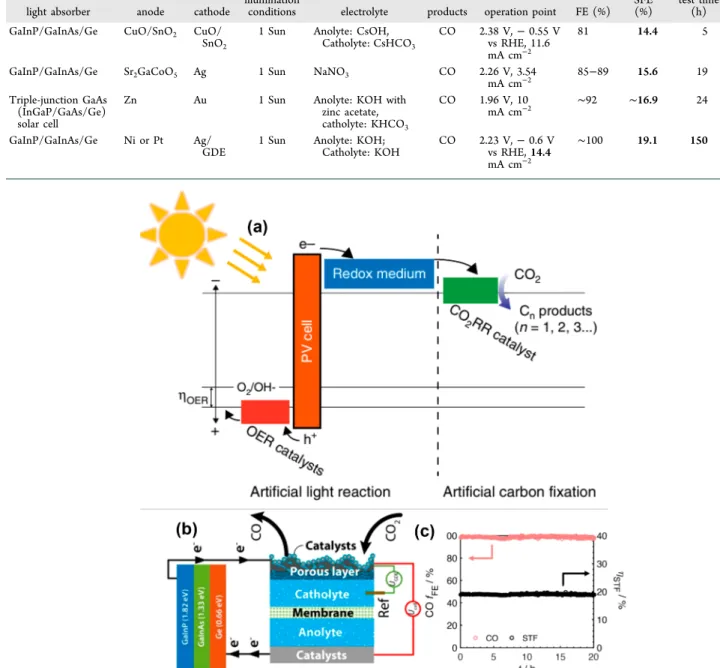
Table 5. Representative Studies on PV+EC CO2Conversion
light absorber anode cathode
illumination
conditions electrolyte products operation point FE (%) SFE (%)
maximum test time
(h) ref
GaInP/GaInAs/Ge CuO/SnO2 CuO/
SnO2
1 Sun Anolyte: CsOH, Catholyte: CsHCO3
CO 2.38 V,−0.55 V vs RHE, 11.6 mA cm−2
81 14.4 5 111
GaInP/GaInAs/Ge Sr2GaCoO5 Ag 1 Sun NaNO3 CO 2.26 V, 3.54
mA cm−2
85−89 15.6 19 112
Triple-junction GaAs (InGaP/GaAs/Ge) solar cell
Zn Au 1 Sun Anolyte: KOH with
zinc acetate, catholyte: KHCO3
CO 1.96 V, 10
mA cm−2 ∼92 ∼16.9 24 113
GaInP/GaInAs/Ge Ni or Pt Ag/
GDE
1 Sun Anolyte: KOH;
Catholyte: KOH
CO 2.23 V,−0.6 V vs RHE,14.4 mA cm−2
∼100 19.1 150 114
Figure 7. (a) Energy diagram of each part in a redox-medium-assisted system. Reprinted with permission from ref113. Copyright 2018 Springer Nature. (b) Illustration of a wire connection between the triple-junction cell and GDE cell and (c) CO Faradaic efficiency and solar-to-fuel efficiency over 20 h duration. Reprinted from ref114. Copyright 2020 American Chemical Society.
Sixty cases were collected that provided clear FE data for corresponding CO2conversion products, which is employed as the key metric for comparing the PEC behavior herein.
For product distribution, HCOOH and CO are the most common major products reported, together accounting for 75% of the studies, followed by CH3OH (11.7%), CH4(5%), CH3CH2OH (5%), and CH3COOH (3.33%), which is consistent with the results of the highlighted studies. For the FE of the product formed in the largest amount, most of the studies reported FE higher than 60%, in which there are 32%
with FE higher than 80%. There are still 20% of the studies reported, with FEs lower than 20%. To compare the activity, we also analyzed the current density distribution. More than 45% of the studies reported current density lower than 2 mA cm−2, while only 11% reported higher than 10 mA cm−2. For the FE distribution for different products, we do not see any cluster formation, which means that none of the products tends to form more selectively than others. In fact, there is a rather even distribution of the FE values for all products, which suggests that the selectivity of a given product is affected more by the electrode material and the PEC condition, rather than the product itself. It is easy to understand that different electrode materials greatly affect the product because the reducing power of the electrons in the PEC system is defined by the conduction band energy of the photocathode. The PEC condition, such as the electrolyte, also affect the surface chemistry and the intermediate species. Note that similarly high FE values were found for the highly reduced products (e.g., CH3OH, C2H5OH, CH4, etc.) to those obtained for CO and HCOOH. The detailed product distribution of PEC CO2 conversion studies within different FE ranges is shown inTable S2.
Recent Development in PV+EC CO2Conversion. Based on the successful H2 evolution studies employing PV+EC systems, this configuration has attracted much attention also for CO2 reduction, especially in the past two years. Here we must make a distinction between (i) integrated systems, where the two functions are incorporated in the same unit, and those (ii) coupled ones, where regular PV panels are DC−DC connected to regular electrochemical cells. In our analysis, only the integrated systems were considered to ensure a fair comparison with the PS/PC and PEC approaches. InTable 5, we highlight some representative studies with high SFE and/or durability.
Atomic layer deposition of SnO2 was performed on CuO nanowires for narrowing the product distribution of CO2
reduction, thus yielding predominantly CO. The prepared catalyst was employed as both the cathode and anode for complete CO2 electrolysis. In the resulting device, the electrodes were separated by a bipolar membrane, and a GaInP/GaInAs/Ge photovoltaic cell was used to drive the solar-driven splitting of CO2into CO and oxygen with a solar- to-CO efficiency of 13.4% and overall SFE of 14.4%. The operating current density, selectivity toward CO, and solar-to- CO efficiency remained almost stable during 5 h of electrolysis.111 In another study, a CO2reduction system was integrated, achieving an average solar-to-CO efficiency of 13.9% and SFE of 15.6% with no appreciable performance degradation in 19 h of operation.112
In another example, a two-step, redox-medium-assisted solar-driven CO2 electroreduction system was developed by incorporating a Zn/Zn(II) redox mediator that acts as the electron carrier during the photosynthesis. In the light reaction, the solar-driven oxygen evolution and Zn(II) reduction store electrons in the Zn/Zn(II) medium. The carbon fixation releases the stored electrons and leads to an unassisted electrochemical reduction of CO2. The energy diagram of each reaction part is shown in Figure 7a.113 This redox-medium- assisted system enables a solar-to-CO conversion efficiency of 15.6% under 1 Sun illumination. In addition, in a very recent study, solar-driven CO2 reduction to CO with 19% solar-to- CO efficiency under 1 Sun illumination in a gas diffusion electrode (GDE)flow cell has been reported.114The use of a reverse assembled GDE (Figure 7b) prevented transition from a wetted to aflooded catalyst bed and allowed the device to operate stably for >150 h with no loss in efficiency. The FECO and SFE over a 20 h duration are shown inFigure 7c.
As also highlighted by one of the Reviewers, the relative surface areas of PV and EC components are often significantly different, but this is often not clearly explained in the papers. In a practical device, the PV cells with a much larger area will be required compared to the area of the EC component, because of the relatively low energy density of solar irradiation.
Importantly, an EC component can be cost-effective when it is smaller and runs at higher current densities (such as those with GDE cells). This mismatch, however, can bring confusion to the readers if the reported values are not concise. There have been some bad practices in reporting current density and SFE in the PV+EC systems. PV cells with a much larger area were integrated with electrodes with a smaller area, while the current density was improperly normalized with the area of the Figure 8. Statistical analysis of PV+EC CO2conversion studies: (a) product distribution, (b) SFE distribution, and (c) SFE distribution of different products.
electrodes, resulting in misleadingly large current densities or SFEs. On the other hand, it is also possible to use electrodes with an area larger than that of the PV cells, especially when using expensive PV cells and relatively cheap electrode materials. In these cases, the overpotential can be very small, because of operating at low current density. Finally, in some cases the SFE was obtained under irradiance significantly lower than 1 Sun, resulting in higher SFE values, which is unlikely to scale with the light intensity.
The above highlighted studies all reported CO as the main product with high SFEs. As for the statistics, 26 cases were collected, in which 19 cases demonstrated clear SFEs (Figure 8). For the product distribution, CO is the most common product, accounting for 65.4% alone. It is followed by HCOOH with 19.2%. Most of the studies reported SFE greater than 5%, accounting for 42.1%. Only 21.1% of the cases reported SFE less than 1%. For those reporting SFEs greater than 10%, all the main products are CO, which are highlighted in the above discussion. The statistical data is shown inTable S3.
Comparisons of the Key Performance Metrics between PS/PC, PEC, and PV+EC Approaches for Solar-Driven CO2Conversion.
We have not found any literature precedence that compared the performance metrics among different approaches for solar- driven CO2 reduction. These subdisciplines, however, cannot be considered as isolated fields, and their comparison is of great importance to analyze intrinsic differences and similarities. As demonstrated in the above sections, there are different performance metrics for PS/PC, PEC, and PV+EC systems, among which, product distribution, light-to-fuel conversion efficiency, and maximum test time were selected as the indicators of selectivity, activity, and durability, respectively.
Inclusion and exclusion criteria:
(i) Product Distribution. The inclusion criterion follows that of the above statistical studies: only the major products (selectivity > 30%) of a given study were counted.
(ii) Light-to-fuel Efficiency. In principle, the cases included in the product distribution analysis were included here except those that did not provide clear light-to-fuel conversion efficiency data. In many PS/PC studies, measurements were performed under monochromatic illumination making the efficiency metrics higher than that measured under simulated sunlight or full-arc
illumination. These issues, however, had only a negligible effect on the comparison, as shown in the following discussion. Those studies using sacrificial agents in the performance evaluation were excluded in the comparison of light-to-fuel efficiency, to ensure that water oxidation is the other half reaction. For PEC studies, only studies without external bias were taken into account in the light-to-fuel conversion efficiency comparison. For PV+EC studies, SFE (or light-to-fuel- efficiency in some cases) data were already obtained in the above sections.
(iii) Maximum Reported Test Time. All cases were included here except those that did not provide clear maximum test time data.
The comparison of product distribution is shown inFigure 9a. Overall, the products of PS/PC and PEC studies are more broadly distributed than those in PV+EC studies with a distinctly higher frequency of CO. The reason for this is that most of the PV+EC studies are proof of concept focusing on device fabrication or system validation, using commercial electrocatalysts, such as Ag115 and Au116 on which selective CO2 reduction to CO has been widely reported. The gas products (mainly CO and CH4) together account for nearly 80% in PS/PC studies, while they account for only about 40%
in PEC studies, which might be associated with the factor that in PS/PC systems, both reduction and oxidation happen on the same particle, while in PEC systems they are spatially separated. The unfavored generation of liquid products in the PS/PC system may be plausibly further consumed by the photogenerated holes involving oxidation reaction conducted at the same particle surface. In addition, the frequency of HCOOH in PS/PC studies is lower than those of PEC and PV +EC plausibly because HCOOH, as one of the thermodynami- cally prior products, might be oxidized by the photogenerated holes or derived oxidizing intermediates, whereas this process is avoided to a great extent in PEC and PV+EC systems.
The activities of the three approaches are compared by light- to-fuel efficiencies, as shown inFigure 9b. The differences are striking! Most of the light-to-fuel efficiencies in PS studies (PC were not included in this analysis) are located in low-value ranges, with 29.0% located between 0 and 0.15% and 19.4%
located between 0.15 to 0.4%, accounting for 48.4% together.
For the PEC studies, the majority is less than 2%, accounting for 61.6%. While for that of PV+EC, the light-to-fuel efficiencies are more concentrated in the high-value range Figure 9. Comparisons of (a) product distribution, (b) light-to-fuel conversion efficiency, and (c) longest measurements in PS/PC, PEC, and PV+EC systems.
(≥4.5%). There is an obvious trend that PS studies frequently reported relatively lower light-to-fuel efficiencies while those of PEC are somewhat higher, and those of PV+EC are further improved.
For the comparison of durability (shown inFigure 9c), most of the PEC and PV+EC studies reported the longest measurement with the maximum test time less than 10 h, accounting for more than 50%. Although fewer cases reported more than 50 h of durability, some of those still have good stability. Moreover, we found that PS/PC studies reported a higher frequency of more than 20 h durability. Generally, the instability in PS/PC systems is caused by photocorrosion resulting from the reduction/oxidation of the photoactive material by photogenerated electrons and holes. For that of PEC systems, not only photocorrosion but also electro- corrosion and electrolyte degradation are considerable challenges for long-term durability. The lack of many long- duration PV+EC studies is somewhat surprising, because PV cells have a very long lifetime, while over 100−1000 h stability was also demonstrated for EC systems. We speculate that more work has to be done on the integration to realize achievable durability for the combined system.
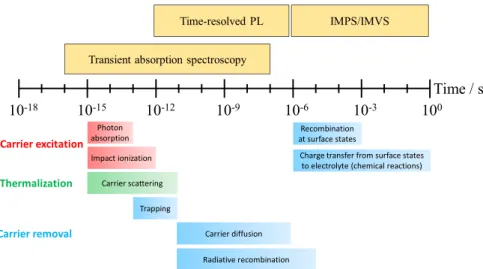
For the sake of simplicity, we compare the most important descriptors behind these trends inTable 6. As seen, the reasons are complex and convoluted; therefore, at this point, we discuss only one overarching aspect of all these areas, namely, the timescale of the different elementary processes. InFigure 10, we present the typical timescale of photoinduced processes occurring in semiconductors and at semiconductor interfaces.
Most importantly, the timescale of the chemical reactions (especially the CO2 reduction reactions involving multi- electron and multiproton transfer) is in the microsecond-to- second regime. This means that a substantially long (photo)- electron lifetime is necessary for this process. Unfortunately, charge carrier recombination occurs at a much faster timescale (depending on the mechanism from subpicosecond to microsecond). This mismatch already indicates that high light-to-fuel conversion efficiencies cannot be realistically expected from PS and PEC systems, unless cocatalysts can be found, which can properly “store” electrons. There is precedence in the literature, where complex PS/PC assemblies allowed charge carrier lifetime on the order of micro- seconds.117 This lifetime enabled different redox reactions, although not those involving the transfer of multiple electrons and protons. Specifically, in a recent study on CsPbBr3
perovskite, nanocubes facilitated photodriven C−C coupling, where both charge carriers were rapidly (∼50 ps) extracted from the photoexcited perovskite NCs to reactant molecules.
The separated charge carriers lived for more than 0.8 μs, enabling a radical mechanism to form the C−C bonds.118At the same time, corrosion processes are also induced in the semiconductors via charge carrier trapping, posing a great threat for PS and PEC methods.119 Such corrosive processes inside the semiconductors are typically faster than the CO2 reduction reaction, where charge transfer is required from the electrode surface to the substrate. This is not the case for the PV+EC method, where charge carriers are rapidly extracted from the PV cell (on the nanosecond−picosecond) timescale.
Finally, we also found that often different products formed via the different approaches even with similar catalysts. Taking CuxO-based catalysts as an example, several studies are listed in Table 7. There is a variety of products including CO, CH4,
C2H4, C2H6, HCOOH, CH3COOH, and CH3OH. In PS and Table6.SummaryoftheDifferencesamongPS/PC,PEC,andPV+ECSystemsfromSixAspects PS/PCsystemsPECsystemsPV+ECsystems Lightab-Oneormorelightabsorbersareneeded(seeEitherone(photocathodeorphotoanode)ortwophotoactiveelectrodes.Tailoredphotovoltaiccellscanbedesigned(fromsingle-tomultijunctioncells),toprovide sorptiontandemandz-schemeconfigurations).Theindividualphotoelectrodescanalsobemulticomponent.thenecessarycellvoltage. Chargecar- riercol- lection Noneedforcarriercollection,butphotogenerated holesandelectronsneedtoreachtherespective surfacesites.
Chargecarriertrappingatdefectsitesattheelectrode/electrolyteinterface hinderschargecarriercollection.RapidchargecarriercollectionisachievedinthePVcell. Charge transfer (reaction)
Bothreactionsproceedonthesameparticles. Preferablydifferentsitesforthetwohalf reactions.Backreactionsarepossible.Therates ofthetwohalfreactionshavetomatch.
Slowchargecarriertransfertothesubstrateormediatorfromtheelectrode surface,comparedtothetimescaleofchargecarrierrecombination.Aseparateelectrochemicalinterfaceisresponsibleforthechemicalreaction.Well-known stableandactiveelectrocatalystscanbeemployed. Nanoas- pectsAhighsurfaceareaisnecessarytoprovideenough activesitesforthereaction.Highprobabilityof surfacerecombination.
Ahighsurfaceareaisnecessarytoprovideenoughactivesitesforthe reaction.Highprobabilityofsurfacerecombination.Nanostructuredelectrocatalystscanbeused,withoutthedetrimentalsurfacerecombination inthelightabsorber. StabilityIntermediatestability,becauseofthepresenceof thesolid/liquidinterface.Verydifficulttoachievereasonablestability,becauseofthepresenceof currentflowandtheelectrode/electrolyteinterface.Differentprotective coatingsseemtoensurecertainimprovements.
Thestabilityisdictatedonlybythestabilityoftheelectrolyzer,asPVpanelsarestablefor ages.Examplesontheorderofhundredsofhoursareavailable. CostCheapexperimentalsetupordevice,butexpensive multifunctionalcatalystmaterialsareneeded.Moreexpensiveandsophisticatedcelldesignsarenecessary,especiallyin thecaseofcontinuousflowprocesses.Ifacocatalystisemployed,large amountsareneededbecauseoftheidenticalsurfaceareaofthelight absorberandtheelectrochemicalinterface.
Relativelyexpensivesystemcost.Muchsmallerelectrochemicallyactiveareaisneeded (comparedtothesizeofthePV)andthuslesselectrocatalysts,membranes,etc.havetobe used.Itisalsopossibletoselecthigh-performancePVcellswithasmallerarea(under concentratedlight)andelectrodeswithalargerarea.
PEC systems, the conduction band energy of the photocathode defines the energy of the photoelectrons, while in the PV+EC systems, it is dictated by the electrode potential. This important difference also means that while in electrocatalysis the reaction rate (i.e., current density) and the reducing power of the electrons (i.e., the electrode potential) are inherently coupled (see the Butler−Volmer equation), this is not the case for PEC.120This simple fact can be a major contributor to the observed differences in the product distributions and a major opportunity for PEC-based methods in the future.
The same catalyst may play different roles in different scenarios. Taking Au-based catalysts as an example, three studies are shown inTable 8. In a PS study, Au nanoparticles (NPs) were used as a catalyst for the conversion of CO2and H2O into C1−C3 hydrocarbons under visible light irradi- ation.127 The Au NPs possess a strong localized surface plasmon resonance (LSPR) band centered around 520 nm, which enables the generation of energetic electron−hole carriers under green light for the reduction of CO2 and oxidation of H2O, resulting in the main products of hydrocarbons. In two PEC studies, Au cocatalyst can lead to
main products CO and CH3CH2OH in different studies.60,128 In such cases, beyond facilitating charge transfer, the cocatalyst also affects the energetics of the electrode/electrolyte interface.
In the highlighted PV+EC study, the main product is CO, where Au acted as an electrocatalyst.113
Summary. Over the past years, the fundamental under- standing of the solar-driven CO2 conversion reaction has improved substantially,129−136 and deactivation mechanisms have also been studied.137,138 Integration and validation of reactors and systems are also ongoing.111,114,125,139−146 With this Focus Review, our aim was to provide an overview of the state-of-the-art solar-driven CO2 conversion approaches. We Figure 10. Typical timescale of different photoinduced processes in semiconductors, together with the methods that are employed to monitor them. PL, photoluminescence; IMPS/IMVS, intensity-modulated photocurrent/photovoltage spectroscopy.
Table 7. Representative Studies on Solar-Driven CO2Conversion Using CuxO-Based Catalysts
system catalyst main product(s) formation rate (mmol e−gcat−1h−1) FE (%) SFE (%) ref
PS carbon quantum dots/Cu2O CH3OH 0.336 121
cathode
PEC Cu2O−Cu HCOOH 14 122
CH3COOH 76
Cu CH4 47 123
Cu/Cu2O CH3OH 53.6 124
PV+EC CuO C2H4 34 125
C2H6 6.5
CuxO wire arrays CO 2.5 126
HCOOH 0.25
Table 8. Representative Studies on Solar-Driven CO2Conversion Using Au-Based Catalysts
system catalyst main product(s) selectivity (%) FE (%) SFE (%) ref
PS (Plasmonic catalysis) Au C1−C3hydrocarbons 50% (C2+hydrocarbons) 127
PEC Cathode
Au/Si CO 91 60
Au/B doped g-C3N4 CH3CH2OH 47 128
PV+EC Au CO ∼92 15.6 113