Biomarkers
Outcomes Associated With Microalbuminuria
Effect Modification by Chronic Kidney Disease
Csaba P. Kovesdy, MD,*† Evan H. Lott,‡ Jun Ling Lu, MD,† Sandra M. Malakauskas, PHD, MD,§储 Jennie Z. Ma, PHD,储 Miklos Z. Molnar, MD, PHD,¶# Kamyar Kalantar-Zadeh, MD, PHD**††
Memphis, Tennessee; Salt Lake City, Utah; Salem and Charlottesville, Virginia; Toronto, Ontario, Canada;
Budapest, Hungary; and Orange and Los Angeles, California
Objectives This study sought to compare the association of microalbuminuria with outcomes in patients with different comorbidities.
Background The risk of adverse outcomes associated with lower levels proteinuria has been found to be linearly decreasing with even low-normal levels of microalbuminuria. It is unclear whether comorbid conditions change these associations.
Methods We examined the association of urine microalbumin-creatinine ratio (UACR) with mortality and the slopes of es- timated glomerular filtration rate (eGFR) in a nationally representative cohort of 298,875 U.S. veterans. Associa- tions of UACR with all-cause mortality overall and in subgroups of patients with and without diabetes mellitus, hypertension, cardiovascular disease, congestive heart failure, and advanced chronic kidney disease (CKD) were examined in Cox models, and with the slopes of eGFR in linear and logistic regression models.
Results Very low levels of UACR were linearly associated with decreased mortality and less progression of CKD overall:
adjusted mortality hazard ratio and estimated glomerular filtration rate slope (95% confidence interval [CI]) as- sociated with UACRⱖ200g/mg, compared to⬍5g/mg were 1.53 (95% CI: 1.38 to 1.69, p⬍0.001) and
⫺1.59 (95% CI:⫺1.83 to⫺1.35, p⬍0.001). Similar linearity was present in all examined subgroups, except in patients with CKD in whom a U-shaped association was present and in whom a UACR of 10 to 19 was associated with the best outcomes.
Conclusions The association of UACR with mortality and with progressive CKD is modified in patients with CKD, who experi- ence higher mortality and worse progression of CKD with the lowest levels of UACR. Proteinuria-lowering inter- ventions in patients with advanced CKD should be implemented cautiously, considering the potential for adverse outcomes. (J Am Coll Cardiol 2013;61:1626–33) © 2013 by the American College of Cardiology Foundation
The high burden of cardiovascular disease in the general population (1) has prompted enhanced efforts to identify early disease markers and therapeutic targets. Microalbu- minuria has shown associations with morbidity and mortal- ity in the general population (2–7), and in patients with various comorbid conditions such as those at risk for or with established chronic kidney disease (CKD) (8–13). An impor- tant question about microalbuminuria is the level that should be applied as a cutoff both toward identifying increased
risk and, ultimately, to use as a therapeutic target. The most commonly used classification for the levels of urine microalbumin-creatinine ratio (UACR [the test most readily available in clinical practice]) defines a level of 10g/mg as the
See page 1634
upper limit of normal (⬍15g/mg for females, to account for the higher urine creatinine of males) (14). Neverthe-
From the *Division of Nephrology, Memphis Veterans Affairs Medical Center, Memphis, Tennessee; †Division of Nephrology, University of Tennessee Health Science Center, Memphis, Tennessee; ‡Veterans Affairs Informatics and Com- puting Infrastructure, Salt Lake City, Utah; §Division of Nephrology, Salem Veterans Affairs Medical Center, Salem, Virginia;储Division of Nephrology, University of Virginia, Charlottesville, Virginia; ¶Department of Medicine, Division of Nephrology, University Health Network, University of Toronto, Toronto, Ontario, Canada; #Institute of Pathophysiology, Semmelweis Uni- versity, Budapest, Hungary; **Harold Simmons Center for Chronic Disease Research and Epidemiology, Division of Nephrology and Hypertension, University of California Irvine Medical Center, Orange, California; and the
††Department of Epidemiology, UCLA Fielding School of Public Health,
Los Angeles, California. This study was supported by National Institute of Diabetes and Digestive and Kidney Diseases Grant 1R01DK078106-01 to Drs.
Kovesdy and Kalantar-Zadeh, and by resources from the Department of Veterans Affairs. Dr. Kovesdy, Mr. Lott, and Dr. Malakauskas are employees of the Department of Veterans Affairs. Opinions expressed in this paper are those of the authors and do not necessarily represent the opinion of the Department of Veterans Affairs. Dr. Kovesdy received a research grant without salary support from Abbott. Dr. Kalantar-Zadeh received honoraria and research grants from Abbott. All other authors have reported they have no relationships relevant to the contents of this paper to disclose.
Manuscript received August 15, 2012; revised manuscript received October 31, 2012, accepted November 12, 2012.
less, studies in the general population have suggested that even UACR levels ⬍10 g/mg are associated with a linear decrement in event risks (3,6,15) questioning the idea of an “ideal” or “normal” range for this marker, and implying that a “the lower, the better” approach is warranted for risk stratification, and potentially for therapeutic interventions.
It is unclear to what extent these findings, and hence this concept, can be applied to patients with a high burden of comorbidities, whose risk of adverse outcomes such as mortality, cardiovascular events, and progressive kidney disease is substantially higher. Studies that examined pa- tients with established CKD have, in general, found that lower UACR was associated with decreased incidence of mortality and end-stage renal disease (8 –13), but neither the individual studies nor the meta-analyses pooling their results (8,10) performed a detailed analysis of UACR cutoffs below what is currently considered “normal” in this patient population. We examined the association of UACR with mortality and with progressive CKD in a large cohort of U.S. veterans. We studied UACR ranges that included even those below the currently accepted normal level of 10
g/mg, and explored whether the associations differed in patients with and without diabetes mellitus, cardiovascular disease (CVD), congestive heart failure (CHF), CKD, and in those with higher and lower levels of blood pressure.
Methods
Cohort definition. The establishment of our cohort was described previously (16). Briefly, we extracted all the available measurements of UACR and stable estimated glomerular filtration rate (eGFR) from the period between October 1, 2004, and September 30, 2006, from the Veterans Adminis- tration (VA) Decision Support System National Data Extracts Laboratory Results file (a VA-wide database containing select laboratory results obtained in the clinical setting) (17). The GFR was estimated from serum creatinine measurements and demographic characteristics by the Chronic Kidney Disease Epidemiology Collaboration equation (18). Of a total of 4,381,049 patients with any serum creatinine and 438,503 patients with any UACR measured between October 1, 2004 and September 30, 2006, we identified 298,875 patients with both stable kidney function and available UACR.
Sociodemographic characteristics and comorbidities.
Data on patient age, sex, race, geographic location (Veteran Integrated Service Network number), blood pressure, and administration of angiotensin-converting enzyme inhibitor (ACEI) or angiotensin-receptor blocker (ARB) was ob- tained through the VA Corporate Data Warehouse. Infor- mation on race was complemented with data obtained from Medicare through the VA-Medicare data merge project (19). All blood pressure values available from October 1, 2004, to September 30, 2006, were recorded and grouped by calendar quarters, and their quarterly averaged values were used for analyses. Administration of ACEI or ARB was
defined as the outpatient dispen- sation by a VA pharmacy of any agent belonging to these medica- tion classes, and was assessed longitudinally in each calendar quarter for the October 1, 2004 to September 30, 2009 period. Data on comorbidities were collected from the VA Inpatient and Out- patient Medical SAS Datasets (20,21) using International Classi- fication of Diseases-Ninth Revi- sion diagnostic and procedure codes and Current Procedural Terminology codes recorded dur- ing the October 1, 2004, to Sep- tember 30, 2006 period. Prevalent cardiovascular disease was defined as the presence of diagnostic codes for coronary artery disease, angina, or myocardial infarction, or proce- dure codes for percutaneous coro- nary interventions or coronary
artery bypass grafting. We calculated the Charlson comorbidity index using the Deyo modification for administrative datasets (22).
Laboratory characteristics. Data on laboratory variables were collected from the October 1, 2004, to September 30, 2009 period by using the National Data Extracts Laboratory Results file (17). To minimize random vari- ability, all available laboratory values were grouped by calendar quarters, and their quarterly averaged values were used in analyses, except for eGFR values used to examine progression of CKD, which were examined with their actual recorded date.
Statistical analyses. Data were characterized using means, medians, and proportions as appropriate. Skewed variables were natural log-transformed. Data points were missing for race (4.5%), blood pressure (5.9%), serum albumin (17.4%), hemoglobin (11.9%), white blood cell count (12.5%), and alkaline phosphatase (10.3%). A total of 225,238 patients (75% of the total study population) had complete data available for the fully adjusted multivariable analyses. Miss- ing values were not imputed in the primary analyses but were substituted by using multiple imputation procedures (23,24) in sensitivity analyses.
The start of the follow-up period was the date of the stable eGFR used to establish CKD. Patients were followed up until death or until the date of the last health-care or administrative encounter, as documented in the VA Vital Status Files. The VA Vital Status Files are a registry containing dates of death or last medical/administrative encounter from all available sources in the VA system. The sensitivity and specificity of the Vital Status Files using the National Death Index as gold standard were shown to be 98.3% and 99.8%, respectively (25). The association of
Abbreviations and Acronyms
ACEIⴝangiotensin- converting enzyme inhibitor
ARBⴝangiotensin- receptor blocker
CHFⴝcongestive heart failure
CIⴝconfidence interval
CKDⴝchronic kidney disease
CVDⴝcardiovascular disease
ESRDⴝend-stage renal disease
eGFRⴝestimated glomerular filtration rate
UACRⴝurine microalbumin-creatinine ratio
VAⴝVeterans Administration
UACR with all-cause mortality was examined in time- dependent Cox models, with adjustment for potential con- founders and clustered by geographic region. The associa- tion between UACR and progression of CKD was examined in linear and logistic regression analyses using the slopes of eGFR versus time as the dependent variable. The slopes of eGFR were calculated in 277,244 patients who had at least 3 eGFR values (median 8, Q1 to Q3: 5 to 13) and a baseline eGFR ⬎15 ml/min/1.73 m2 by ordinary least squares regression of eGFR versus time in each individual patient. Progressive CKD was defined as a slope of⬍⫺4 ml/min/1.73 m2per year for logistic regression analyses.
Variables were included in multivariable models if they could be considered confounders (26) on the basis of theoretical considerations and after examination of baseline associations with UACR. Associations were examined se- quentially in models with incremental multivariable adjust- ments: unadjusted (model 1); age, sex, and race adjusted (model 2); model 2 plus diabetes, CVD, CHF, and Charl- son comorbidity index adjusted (model 3); and model 3 plus blood pressure, administration of ACEI or ARB, eGFR (except for analyses of slopes), serum albumin, alkaline phosphatase, hemoglobin, and white blood cell count ad- justed (model 4). Variables that were measured repeatedly during follow-up (blood pressure, ACEI/ARB use, and
laboratory covariates) were handled as time-dependent variables in Cox models and as time-averaged values in regression analyses. Nonlinear associations were examined by categorizing UACR according to established cutoff points for male patients (⬍10, 10 to 19, 20 to 199, and ⱖ200 g/mg) (14), and by subdividing the ⬍10 g/mg category into 2 groups (⬍5 and 5 to 9g/mg) to examine whether UACR levels below the currently accepted upper limit of normal (10 g/mg) (14) are still associated with clinical outcomes, as suggested by some studies (3,6,15).
Analyses were also performed separately in patients catego- rized according to diabetic status, baseline systolic blood pressure level (⬍120 mm Hg vs. ⱖ120 mm Hg), CVD, CHF, and eGFR level at baseline (⬍30 ml/min/1.73 m2vs.
ⱖ30 ml/min/1.73 m2). To better delineate the role of kidney function, we also categorized eGFR according to pre-specified cutoffs of 15 to 29, 30 to 44, 45 to 59, 60 to 89, and ⱖ90 ml/min/1.73 m2(27).
Sensitivity analyses were performed by using imputed values of independent variables. Statistical analyses were performed using STATA MP Version 11 (Stata Corp., College Station, Texas). The study protocol was approved by the institutional review boards at the Salem VAMC and the Memphis VAMC.
Baseline Characteristics of Patients Stratified by Level of Baseline Urine Microalbumin-Creatinine RatioTable 1 Baseline Characteristics of Patients Stratified by Level of Baseline Urine Microalbumin-Creatinine Ratio
Characteristics
Urine Microalbumin/Creatinine,g/mg
<5 (nⴝ72,448)
5 to 9 (nⴝ64,053)
10 to 19 (nⴝ55,664)
20 to 199 (nⴝ90,828)
>200
(nⴝ15,882)
Age, yrs 62.4⫾11.8 64.6⫾11.1 66.2⫾11.2 67.6⫾11.2 67.4⫾10.9
Race
White 52,635 (77) 49,988 (82) 44,410 (83) 72,383 (83) 12,339 (80)
Black 12,983 (19) 8,586 (14) 6,833 (13) 11,437 (13) 2,266 (15)
Hispanic 1,041 (1.5) 871 (1.4) 827 (1.6) 1,638 (1.9) 320 (2.1)
Other 1,658 (2.4) 1,345 (2.2) 1,136 (2.1) 1,990 (2.3) 511 (3.3)
Male 69,836 (96) 61,792 (96) 53,906 (97) 88,691 (98) 15,723 (98)
DM 51,363 (71) 50,810 (79) 46,673 (84) 79,811 (88) 14,593 (91)
ASCVD 19,283 (27) 19,728 (31) 19,441 (35) 35,925 (40) 6,888 (43)
CHF 4,405 (6) 4,188 (7) 4,964 (9) 11,940 (14) 3,288 (21)
Comorbidity index 2 (1–3) 2 (1–3) 2 (1–4) 3 (1–4) 4 (2–5)
SBP, mm Hg 132⫾16 133⫾16 134⫾17 137⫾18 141⫾19
DBP, mm Hg 75⫾10 74⫾11 74⫾11 73⫾11 74⫾12
ACEI/ARB use 19,283 (27) 18,962 (30) 17,911 (32) 32,189 (35) 6,230 (39)
eGFR, ml/min/1.73 m2 78.3⫾20.3 77.2⫾19.7 74.9⫾20.9 70.6⫾20.4 61.5⫾24.8
Serum albumin, g/dl 4.1⫾0.4 4.1⫾0.4 4.1⫾0.4 4.0⫾0.4 3.8⫾0.5
Total cholesterol, mg/dl 175⫾40 172⫾40 171⫾41 170⫾42 172⫾46
Serum calcium, mg/dl 9.3⫾0.4 9.3⫾0.4 9.3⫾0.4 9.3⫾0.5 9.2⫾0.5
Serum ALP, U/l 75⫾31 76⫾30 77⫾32 79⫾35 86⫾44
Serum bicarbonate, mEq/l 27.7⫾2.7 27.6⫾2.7 27.6⫾2.8 27.3⫾3.0 26.9⫾3.2
Blood Hgb, g/dl 14.5⫾1.5 14.4⫾1.5 14.3⫾1.6 14.1⫾1.7 13.7⫾1.9
Blood WBC, 1,000/mm3 7.1⫾3.2 7.3⫾3.3 7.4⫾2.9 7.6⫾3.5 7.8⫾3.8
UACR,g/mg 3.0 (2.7–4.0) 7.2 (6.0–8.5) 14.0 (11.9–16.7) 44.0 (28.7–78.0) 388.4 (266.3–716.8)
Values are mean⫾SD, n (% of total), or median (interquartile range). To convert glomerular filtration rate (GFR) in ml/min/1.73 m2to ml/s/1.73 m2, multiply by 0.01667; serum albumin in g/dl to g/l, multiply by 10; serum total cholesterol in mg/dl to mmol/l, multiply by 0.02586; serum calcium in mg/dl to mmol/l, multiply by 0.2495; and hemoglobin in g/dl to g/l, multiply by 10.
ALP⫽alkaline phosphatase; ACEI⫽angiotensin-converting enzyme inhibitor; ARB⫽angiotensin-receptor blocker; ASCVD⫽atherosclerotic cardiovascular disease; CHF⫽congestive heart failure;
DBP⫽diastolic blood pressure; DM⫽diabetes mellitus; eGFR⫽estimated glomerular filtration rate; Hgb⫽hemoglobin; SBP⫽systolic blood pressure; UACR⫽urine microalbumin-creatinine ratio;
WBC⫽white blood cell count.
Results
Baseline characteristics in patients categorized by their UACR level are shown in Table 1. Patients with higher UACR were older, and more likely to be diabetic, to use ACEI/ARB and to have CVD and CHF, and had a higher comorbidity index, systolic blood pressure, serum alkaline phosphatase, and white blood cell count, and lower eGFR, serum albumin, and hemoglobin.
Mortality. A total of 49,586 patients died (mortality rate 35.3/1,000 patient-years, 95% confidence interval [CI]: 35.0 to 35.7) during a median follow-up of 5 years. Patients with higher UACR experienced significantly higher mortality rates in a linearly incremental fashion above a UACR of 10g/mg in all models (Fig. 1). When analyzed as a continuous variable, a 1 natural log-unit higher UACR was associated with hazard ratios 1.31 (95% CI: 1.28 to 1.34) and 1.11 (95% CI: 1.09 to 1.13) in unadjusted and in fully adjusted models, respectively (p⬍0.001 for both).
The association of UACR with mortality was similarly linear (albeit quantitatively different) in patients with and without diabetes, CVD, and CHF and in patients with higher or lower blood pressure levels, but was qualitatively different in patients with advanced CKD (Fig. 2). UACR levels of 5 to 9, 10 to 19, 20 to 199, and ⱖ200 g/mg (compared to⬍5g/mg) were associated with mortality hazard ratios 1.05 (95% CI: 0.98 to 1.13), 1.20 (95% CI: 1.12 to 1.29), 1.43 (95% CI: 1.33 to 1.54), and 1.57 (95% CI: 1.41 to
1.54) in patients with eGFRⱖ30 ml/min/1.73 m2; and 0.94 (95% CI: 0.80 to 1.10), 0.81 (95% CI: 0.67 to 0.98), 0.96 (95% CI: 0.83 to 1.11), and 1.05 (95% CI: 0.88 to 1.25) in patients with eGFR⬍30 ml/min/1.73 m2(Fig. 2). A more granular assessment of eGFR categories indicated that UACR developed a U-shaped association with mortality below an eGFR of 45 ml/min/1.73 m2: the adjusted mortality hazard ratios associated with UACR 10 to 19 compared to⬍5
g/mg in patients with eGFR levelsⱖ90, 60 to 89, 45 to 59, 30 to 44, and 15 to 29 ml/min/1.73 m2were 1.19 (95% CI:
1.08 to 1.31), 1.32 (95% CI: 1.21 to 1.45), 1.11 (95% CI: 1.01 to 1.22), 1.00 (95% CI: 0.86 to 1.15), and 0.81 (95% CI: 0.67 to 0.98) (Online Fig. 1). Furthermore, the magnitude with which UACR was associated with mortality was highest in patients with eGFR 60 to 89 ml/min/1.73 m2, and gradually diminished in patients with eGFR levels⬍60 ml/min/1.73 m2 (Online Fig. 1). Results of analyses using imputed values for missing variables yielded similar results (data not shown).
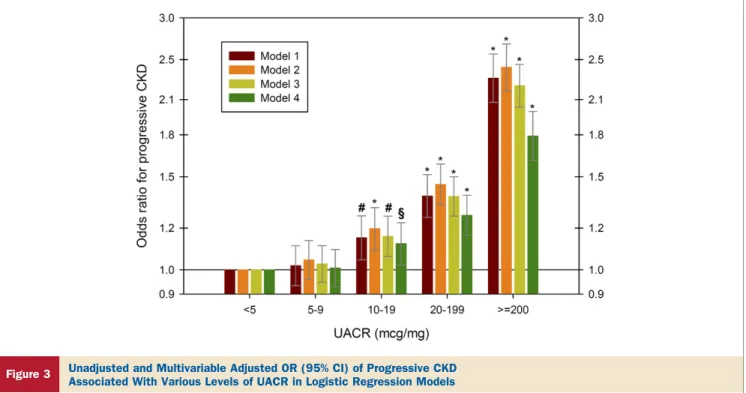
Progression of CKD. In the overall patient population, a 1 natural log-unit higher UACR was associated with ⫺0.38 ml/min/1.73 m2per year (95% CI:⫺0.37 to⫺0.39, p⬍0.001) and⫺0.27 ml/min/1.73 m2per year (95% CI:⫺0.35 to
⫺0.19, p⬍0.001) steeper slopes, and with odds ratios (95%
CI) of progressive CKD of 1.18 (95% CI: 1.15 to 1.21, p⬍ 0.001) and 1.12 (95% CI: 1.09 to 1.15, p ⬍ 0.001) in unadjusted and in fully adjusted linear and logistic
Figure 1 Unadjusted and Multivariable Adjusted HR (95% CI) of All-Cause Mortality Associated With Various Levels of UACR in 298,875 Patients
In time-dependent Cox models, the groups with urine microalbumin-creatinine ratio (UACR)⬍5g/mg served as referent. Models represent unadjusted association (model 1[dark red bars]); associations after adjustment for age, sex, and race (model 2[orange bars]); model 2 variables plus diabetes mellitus, cardiovascular dis- ease, congestive heart failure, and Charlson comorbidity index (model 3[yellow-green bars]); and model 3 variables plus systolic blood pressure, angiotensin-converting enzyme inhibitor/angiotensin-receptor blocker use, estimated glomerular filtration rate, serum albumin, blood hemoglobin, white blood cell count, and serum alkaline phosphatase (model 4[green bars]). *p⬍0.001; §p⬍0.05. CI⫽confidence interval; HR⫽hazard ratio.
regression models, respectively. This association ap- peared to be linearly incremental at UACR levels ⱖ10
g/mg (Fig. 3).
Similar to associations with mortality, the associations of UACR with progressive CKD were also linearly incremen- tal in all examined subgroups except in patients with advanced CKD, in whom there was a U-shaped association (Fig. 4). The U-shaped association between UACR and progressive CKD also became apparent in patients with eGFR ⬍45 ml/min/1.73 m2: the adjusted odds ratios of progressive CKD associated with UACR 10 to 19 com- pared to⬍5g/mg in patients with eGFR levelsⱖ90, 60 to 89, 45 to 59, 30 to 44, and 15 to 29 ml/min/1.73 m2 were 1.09 (95% CI: 0.98 to 1.22), 1.19 (95% CI: 1.09 to 1.21), 1.07 (95% CI: 0.98 to 1.16), 0.77 (95% CI: 0.63 to 0.93), and 0.38 (95% CI: 0.26 to 0.56) (Online Fig. 2). Results of analyses using imputed values for missing variables yielded similar results (data not shown).
Discussion
We describe associations of UACR with all-cause mortality and with the slopes of eGFR in a large cohort of U.S.
veterans. Higher UACR showed incremental associations with both of these outcomes, which were consistent in patients with and without diabetes, CVD, and CHF and in patients with lower and higher blood pressure levels. A markedly different pattern of association was observed in patients with moderate and advanced CKD. Whereas in patients with eGFR 60 to 89 ml/min/1.73 m2, UACR levels of ⬍5 g/mg were associated with the most favorable outcomes, these associations were U-shaped in patients with eGFR ⬍45, and especially in those with levels ⬍30 ml/
min/1.73 m2(CKD stages 3B and 4); in the latter groups, UACR levels ⬍10 to 19 g/mg were associated with a significant increase in adverse outcomes compared to pa- tients with UACR 10 to 19g/mg.
Elevated UACR is considered a robust predictor of adverse clinical outcomes both in the general population (2–7) and in patients with CKD (8 –13). It is less clear, however, what cutoff should be used to denote a “normal”
UACR. The most commonly used classification considers UACR⬍10g/mg (⬍15g/mg for females) normal, and classifies patients with higher levels as having high-normal level, microalbuminuria and macroalbuminuria (14). Desig- nating an upper limit of normal implies that UACR levels
⬍10 to 15 g/mg are physiologic and are unrelated to outcomes. This idea has been challenged by studies in the general population showing a decremental association of UACR levels below this “normal” cutoff with clinical outcomes (3,6,15), suggesting that any elevation in, and indeed, the mere presence of a measurable UACR can in fact be considered pathologic. The determination of a normal UACR is important from a public health perspec- tive, because it could not only define the number of persons indentified as being at risk for outcomes or having a disease such as CKD, but it would also lead to different therapeutic targets.
To the best of our knowledge, our study is the first to describe in detail the association of low and very low UACR with clinical outcomes in patients with different comorbid conditions. Of these comorbidities, CKD appeared to represent an effect-modifier in the association of UACR with mortality and with progressive CKD. Explaining the different associations seen in advanced CKD necessitates the understanding of what the meaning of a high or a low UACR is. The most commonly accepted theory is that UACR represents both a cause and a consequence of vascular damage (28). Whichever may be the case, it is difficult to imagine why patients with CKD who have the lowest UACR levels (and would thus either be at the lowest risk or have the lowest severity of vascular disease) would have higher mortality and more rapid progression of CKD.
A more likely explanation of our findings in CKD is that UACR is also a marker of intraglomerular pressure, and the
Figure 2
Mortality HR (95% CI) Associated with UACR Categories of 5 to 9, 10 to 19, 20 to 199, and
>200g/mg, Compared to<5g/mg in Different Subgroups of Patients
Results were obtained from Cox models adjusted for age, sex, race, diabetes mellitus (DM), cardiovascular disease (CVD), congestive heart failure (CHF), Charlson comorbidity index, systolic blood pressure (BP), angiotensin-convert- ing enzyme inhibitor/angiotensin-receptor blocker use, estimated glomerular filtration rate (eGFR), serum albumin, blood hemoglobin, white blood cell count, and serum alkaline phosphatase. The p values represent significance levels for interaction terms. ACR⫽albumin-creatinine ratio; CI⫽confidence interval;
HR⫽hazard ratio; UACR⫽urine microalbumin-creatinine ratio.
different association patterns seen in some subgroups may represent their decreased ability to adapt to lower renal perfusion pressures. Patients with CKD have an inability to autoregulate end-organ perfusion pressure in the face of lower blood pressure (29) due to a combination of small vessel changes (30 –32) incurred with the older age and many of the comorbid conditions present in this group (33).
That could lead to adverse outcomes under conditions of end-organ ischemia, as has been suggested by numerous earlier observational studies in end-stage renal disease (33–37) and in non– dialysis-dependent CKD patients (38,39) showing a U-shaped association between systolic blood pressure and mortality. Therefore, it is possible that a low UACR identifies patients at high risk for ischemic end- organ damage among those with advanced CKD.
Our findings suggest that when used as a tool for risk stratification, UACR levels in the lowest range appear to point toward increased, not decreased, risk of mortality and progressive CKD in patients with moderate and advanced CKD. For patients with various other comorbid conditions and for patients with eGFR levels in the normal range and those with mild CKD, we confirm findings from studies involving the general population in that very low UACR levels can be used to identify patients at the lowest risk for adverse outcomes. It is less clear how our findings should be applied toward identifying therapeutic targets, as we cannot determine from our data what the clinical outcomes would be if UACR was decreased therapeutically to extremely low
levels. On the basis of our observational data, it is possible that in most patients, lowering proteinuria to very low or undetectable levels could be beneficial. However, in patients with moderate and advanced CKD, we would consider it prudent to regard the UACR levels associated with the lowest risks in observational studies (e.g., 10 to 19g/mg) as the optimal therapeutic target worth exploring in clinical trials.
Our study is notable for its large sample size, which allowed us to include substantial numbers of patients with various comorbidities and with UACR levels spanning a wide range, and for it being representative of veterans from the entire geographic United States.
Study limitations. We examined mostly male patients;
hence, it is unclear whether the same results can be extrapolated to female patients. We used data obtained during the course of clinical practice; hence, selection bias is likely. Our patients’ UACR would have been measured based on clinical indications, as suggested by the high proportion of diabetic patients in our cohort, but the concordance of our findings in patients with normal eGFR with those of studies examining the general population support the validity and generalizability of our results.
Conclusions
Higher UACR, especially in the macroalbuminemic range, is associated with increased mortality and worse
Figure 3 Unadjusted and Multivariable Adjusted OR (95% CI) of Progressive CKD Associated With Various Levels of UACR in Logistic Regression Models
The groups with urine microalbumin-creatinine ratio (UACR)⬍5g/mg served as referent. Models represent unadjusted association (model 1[dark red bars]); associations after adjustment for age, sex, and race (model 2[orange bars]); model 2 variables plus diabetes mellitus, cardiovascular disease, congestive heart failure, and Charlson comor- bidity index (model 3[yellow-green bars]); and model 3 variables plus systolic blood pressure, angiotensin-converting enzyme inhibitor/angiotensin-receptor blocker use, serum albumin, blood hemoglobin, white blood cell count, and serum alkaline phosphatase (model 4[green bars]). *p⬍0.001; #p⬍0.01; §p⬍0.05. CI⫽confidence interval;
CKD⫽chronic kidney disease; OR⫽odds ratio.
progression of CKD in patients irrespective of the pres- ence of diabetes mellitus, CVD, CHF, and blood pres- sure level. In patients with normal kidney function and in patients with mild decreases in eGFR, the lowest UACR is also associated with the best outcomes, with the lowest event rates seen among those with UACR⬍10 g/mg, and in some cases, even ⬍5 g/mg. In patients with moderate and advanced CKD, UACR levels below what is currently considered normal are associated with worse clinical outcomes. Clinical trials will be needed to test the validity of the optimal UACR cutoffs established in our study as therapeutic targets.
Reprint requests and correspondence: Dr. Csaba P. Kovesdy, Division of Nephrology, Memphis VA Medical Center, 1030 Jefferson Avenue, Memphis, Tennessee 38104. E-mail: csaba.
kovesdy@va.gov.
REFERENCES
1. Lloyd-Jones D, Adams RJ, Brown TM, et al. Heart disease and stroke statistics—2010 update: a report from the American Heart Associa- tion. Circulation 2010;121:e46 –215.
2. Hillege HL, Fidler V, Diercks GF, et al. Urinary albumin excretion predicts cardiovascular and noncardiovascular mortality in general population. Circulation 2002;106:1777– 82.
3. Klausen K, Borch-Johnsen K, Feldt-Rasmussen B, et al. Very low levels of microalbuminuria are associated with increased risk of coronary heart disease and death independently of renal function, hypertension, and diabetes. Circulation 2004;110:32–5.
4. Romundstad S, Holmen J, Kvenild K, Hallan H, Ellekjaer H.
Microalbuminuria and all-cause mortality in 2,089 apparently healthy individuals: a 4.4-year follow-up study. The Nord-Trondelag Health Study (HUNT), Norway. Am J Kidney Dis 2003;42:466 –73.
5. Yuyun MF, Khaw KT, Luben R, et al. Microalbuminuria indepen- dently predicts all-cause and cardiovascular mortality in a British population: the European Prospective Investigation into Cancer in Norfolk (EPIC-Norfolk) population study. Int J Epidemiol 2004;33:
189 –98.
6. Gerstein HC, Mann JF, Yi Q, et al. Albuminuria and risk of cardiovascular events, death, and heart failure in diabetic and nondi- abetic individuals. JAMA 2001;286:421– 6.
7. Matsushita K, van der Velde M, Astor BC, et al. Association of estimated glomerular filtration rate and albuminuria with all-cause and cardiovascular mortality in general population cohorts: a collaborative meta-analysis. Lancet 2010;375:2073– 81.
8. Astor BC, Matsushita K, Gansevoort RT, et al. Lower estimated glomerular filtration rate and higher albuminuria are associated with mortality and end-stage renal disease. A collaborative meta-analysis of kidney disease population cohorts. Kidney Int 2011;79:1331– 40.
9. Bello AK, Hemmelgarn B, Lloyd A, et al. Associations among estimated glomerular filtration rate, proteinuria, and adverse cardio- vascular outcomes. Clin J Am Soc Nephrol 2011;6:1418 –26.
10. Gansevoort RT, Matsushita K, van der Veldt M, et al. Lower estimated GFR and higher albuminuria are associated with adverse kidney outcomes. A collaborative meta-analysis of general and high- risk population cohorts. Kidney Int 2011;80:93–104.
11. Hemmelgarn BR, Manns BJ, Lloyd A, et al. Relation between kidney function, proteinuria, and adverse outcomes. JAMA 2010;303:423–9.
12. O’Hare AM, Hailpern SM, Pavkov ME, et al. Prognostic implications of the urinary albumin to creatinine ratio in veterans of different ages with diabetes. Arch Intern Med 2010;170:930 – 6.
13. Warnock DG, Muntner P, McCullough PA, et al. Kidney function, albuminuria, and all-cause mortality in the REGARDS (Reasons for Geographic and Racial Differences in Stroke) study. Am J Kidney Dis 2010;56:861–71.
14. de Jong PE, Curhan GC. Screening, monitoring, and treatment of albuminuria: public health perspectives. J Am Soc Nephrol 2006;17:
2120 – 6.
15. Arnlov J, Evans JC, Meigs JB, et al. Low-grade albuminuria and incidence of cardiovascular disease events in nonhypertensive and nondiabetic individuals: the Framingham Heart Study. Circulation 2005;112:969 –75.
16. Kovesdy CP, Lott EH, Lu JL, et al. Hyponatremia, hypernatremia, and mortality in patients with chronic kidney disease with and without congestive heart failure. Circulation 2012;125:677– 84.
17. VIReC Research User Guide. Veterans Health Administration Deci- sion Support System Clinical National Data Extracts. 2nd edition.
Hines, IL: U.S. Department of Veterans Affairs, Health Services Research and Development Service, VA Information Resource Center, 2009.
18. Levey AS, Stevens LA, Schmid CH, et al. A new equation to estimate glomerular filtration rate. Ann Intern Med 2009;150:604 –12.
19. US Department of Veterans Affairs, VA Information Resource Center Data Quality Update: Race. 2009.
20. VIReC Research User Guide. VHA Medical SAS Inpatient Datasets FY2006. Hines, IL: U.S. Department of Veterans Affairs, VA Infor- mation Resource Center, 2007.
21. VIReC Research User Guide. VHA Medical SAS Outpatient Data- sets FY2006. Hines, IL: U.S. Department of Veterans Affairs, VA Information Resource Center, 2007.
Figure 4
Odds Ratios (95% CI) of Progressive CKD Associ- ated With UACR Categories of 5 to 9, 10 to 19, 20 to 199, and>200g/mg, Compared to
<5g/mg in Different Subgroups of Patients
Results were obtained from logistic regression models adjusted for age, sex, race, DM, CVD, CHF, Charlson comorbidity index, systolic BP, angiotensin-converting enzyme inhibitor/angiotensin-receptor blocker use, serum albumin, blood hemoglobin, white blood cell count, and serum alkaline phosphatase. The p values represent significance levels for interaction terms.
CKD⫽chronic kidney disease; other abbreviations as inFigure 2.
22. Deyo RA, Cherkin DC, Ciol MA. Adapting a clinical comorbidity index for use with ICD-9-CM administrative databases. J Clin Epidemiol 1992;45:613–9.
23. Li KH. Imputation using Markov chains. J Stat Comput Simul 1988;30:57–79.
24. Tanner MA, Wong WH. The calculation of posterior distributions by data augmentation. J Am Stat Assoc 1987;82:528 –50.
25. Arnold N, Sohn M, Maynard C, Hynes DM. VIReC Technical Report 2. VA-NDI Mortality Data Merge Project. Edward Hines Jr.
VA Hospital. Hines, IL: VA Information Resource Center, 2006.
26. Thadhani R, Tonelli M. Cohort studies: marching forward. Clin J Am Soc Nephrol 2006;1:1117–23.
27. K/DOQI clinical practice guidelines for chronic kidney disease:
evaluation, classification, and stratification. Am J Kidney Dis 2002;39 Suppl:1–266.
28. Deckert T, Feldt-Rasmussen B, Borch-Johnsen K, Jensen T, Kofoed- Enevoldsen A. Albuminuria reflects widespread vascular damage. The Steno hypothesis. Diabetologia 1989;32:219 –26.
29. Palmer BF. Renal dysfunction complicating the treatment of hyper- tension. N Engl J Med 2002;347:1256 – 61.
30. Ditscherlein G. Renal histopathology in hypertensive diabetic patients.
Hypertension 1985;7:II29 –32.
31. Pelayo JC, Westcott JY. Impaired autoregulation of glomerular capil- lary hydrostatic pressure in the rat remnant nephron. J Clin Invest 1991;88:101–5.
32. Bidani AK, Griffin KA, Williamson G, Wang X, Loutzenhiser R.
Protective importance of the myogenic response in the renal circula- tion. Hypertension 2009;54:393– 8.
33. Abuelo JG. Normotensive ischemic acute renal failure. N Engl J Med 2007;357:797– 805.
34. Kalantar-Zadeh K, Kilpatrick RD, McAllister CJ, Greenland S, Kopple JD. Reverse epidemiology of hypertension and cardiovascular death in the hemodialysis population: the 58th annual fall conference and scientific sessions. Hypertension 2005;45:811–7.
35. Duranti E, Imperiali P, Sasdelli M. Is hypertension a mortality risk factor in dialysis? Kidney Int 1996;55 Suppl:173– 4.
36. Port FK, Hulbert-Shearon TE, Wolfe RA, et al. Predialysis blood pressure and mortality risk in a national sample of maintenance hemodialysis patients. Am J Kidney Dis 1999;33:507–17.
37. Zager PG, Nikolic J, Brown RH, et al. “U” curve association of blood pressure and mortality in hemodialysis patients. Medical Directors of Dialysis Clinic, Inc. Kidney Int 1998;54:561–9.
38. Kovesdy CP, Trivedi BK, Kalantar-Zadeh K, Anderson JE. Associa- tion of low blood pressure with increased mortality in patients with moderate to severe chronic kidney disease. Nephrol Dial Transplant 2006;21:1257– 62.
39. Agarwal R. Blood pressure components and the risk for end-stage renal disease and death in chronic kidney disease. Clin J Am Soc Nephrol 2009;4:830 –7.
Key Words:chronic kidney diseaseymicroalbuminuriaymortality.
APPENDIX
For supplementary figures, please see the online version of this article.