DOCTORAL (PhD) THESIS
GÁBOR HÁMORI
Kaposvár University
2014
KAPOSVÁR UNIVERSITY
Doctoral School of Management and Organizational Sciences
Leader of Doctoral School:
PROF. DR. SÁNDOR KEREKES Doctor of Hungarian Academy of Sciences
Supervisor:
PROF. DR. JÁNOS SZÁZ
PRACTICAL ISSUES OF PREDICTIVE CLASSIFICATION MODELS
Author:
Gábor Hámori
KAPOSVÁR 2014
DOI: 10.17166/KE.2015.007
Table of contents
Research history, Goals ... 4
Material and Methods ... 5
Results, Conclusions ... 5
Testing Hypotheses 1 ... 5
Testing Hypotheses 2 ... 6
Testing Hypotheses 3 ... 8
New Research Results ... 12
Publications ... 12
Hungarian-language Publications ... 12
Foreign-language Publications ... 13
Other ... 13
Research history, Goals
The technical details of the predictive regression modeling are very well discussed. Focused on each problem many relevant studies were published in the last decades. Generally the authors analyse different problems with sophisticated mathematical tools, but separately taken out of the modelling process. However, the rapidly spread industrial application of statistical modeling and data mining solutions eventuated a demand for a new approach, which analyse the problems alongside the complete modeling process. This dissertation focuses on this new approach in the area of predictive binary classifications, logistic regression model is placed in the focus of the analysis. The study shows a comprehensive picture of the entire modeling process, and the typical decision points and best practices at each steps. For those who want to get deeper knowledge of specific issues, the references provide assistance. The dissertation thus can be claimed of the interest of both practitioners and academics as well.
For practical application of predictive classification models however a significant role is in the finished model fit, the classifying power. Therefore the dissertation examines three hypotheses, to help the logistic regression model fit can be significantly improved:
Hypotheses 1: The adequate handling of extreme values (outliers) in the modeling database improve the model fit.
Hypotheses 2: Continuous variables categorization can increase the predictive power of the model even if the target variables and the original continuous variable are monotonically related.
Hypotheses 3: It is known that in the case of continuous variables, the number and the choice of location of categorization boundaries influence the predictive power of the model. A special procedure as part of the CHAID algorithm, described in the dissertation, is suitable for fitting to maximize optimal class boundaries.
Material and Methods
To verificate the hyptheses a bank and hospital database was used. Due to privacy reasons, the exact origin of the database are not shown. For the analysis, the SPSS.20 statistical software was used.
Results, Conclusions
Below we present the testing of hypotheses and conclusions derived from it:
Testing Hypotheses 1
As extreme values (outliers) of continuous variables usually worsen the fit of the model used, so special care must be taken to identify and correct treatment of extreme outliers in the modeling. This is particularly important in the case of linear models with continuous variables used in the calculation, because the covariance matrix means change significantly as a result of the extreme values, large impact on this by some elements of the matrix itself. Testing the hypothesis, "AGE" continuous variable is used to predict the occurence of complications after a certain surgery. For the prediction a dichotomous logistic regression model was used. 350 patients were included in a hospital database, of which 98 cases occurred as complication in the 2008-2011 monitoring period. The youngest patient was 15 and the oldest was 87 years old. The the distribution is similar to the gaussian distribution with mean 54,86 and median 56 years of age. Only the „age” independent variable is included int the logistic regression model. Parameter estimation is shown in the following table.
1. Table. Parameter estimation.
Variables in the Equation
B S.E. Wald df Sig. Exp(B)
Step 1 Age ,032 ,009 13,120 1 ,000 1,032
Constant -2,735 ,521 27,558 1 ,000 ,065
As it can be seen, the „age” is a significant explanatory variable (P=0,000) in the model. The next step we „changed” a 77 years old patient without any complication to 577 years old and a 84 years old patient with complications to 384 years old of age. In this way, we have created
two outlier observation artificially. The regression was run again and gave the following results:
2. Table. Parameter estimation. Outlier
Variables in the Equation
B S.E. Wald df Sig. Exp(B)
Step 1 Age ,002 ,003 ,524 1 ,469 1,002
Constant -1,072 ,213 25,335 1 ,000 ,342
It can be seen that not only the parameter estimation was changed, but the significance level of explanatory variables was changed (P=0,469) as well. The variable „Age” is insignificant at every regular level in the model. The analyses showed that without the proper handling of extreme values, the explanatory power of the model could be decreased significantly.
Testing Hypotheses 2
It is known that in both the linear and logistic regression model, in the case of continuous independent variables the the proper fit is expected if the reletaionship with the target variable is monotone.. Therefore, in case of non-monotonic relationship, the continuous indicator variables should be transformed into categorized variables in order to increase the predictive power of the model. Less obvious is that sometimes despite the monotonic relationship between continuous predictor and target variable, the significance may also be insufficient, while the categorized pair of the continuous variable shows a relevant explanatory power in our model. Testing the hypotheses we used the same hospital database, where the „Age” and „BMI” (Body Mass Index) are the continuous predictors to predict the occurrence of complications after surgeries. The table below shows the results of the enter regression model.
3. Table. Parameter estimation (Age, BMI)
Variables in the Equation
B S.E. Wald df Sig. Exp(B)
Step 1
BMI ,010 ,009 1,187 1 ,276 1,010
Age ,032 ,009 13,088 1 ,000 1,032
Constant -3,024 ,585 26,709 1 ,000 ,049
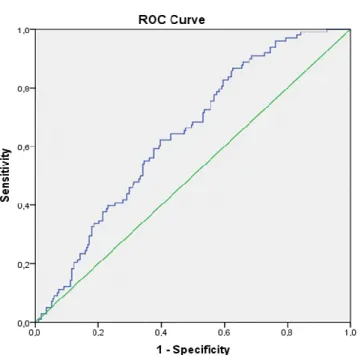
As it can be seen only the „Age” variable is significant. Accordingly, the model fit is very poor (GINI = 28%) as reflected in the following the ROC- curve
1. figure. ROC curve (Age, BMI)
Let's see what happens if instead of using the BMI continuous variable we use the categorized mate based on expert judgement. The category boundaries of the new variable (BMIKAT2) and the rate of complications in each category (proportion of complicated cases in this category to the category of all cases) and WOE values are shown in the table below.
4. Table. BMI categorization
BMI 0-28 28-34 34-
BMIKAT2 1 2 3
COMPLICATION RATE 12,70% 31,40% 44,60%
WOE 1,927748 0,781485 0,216846
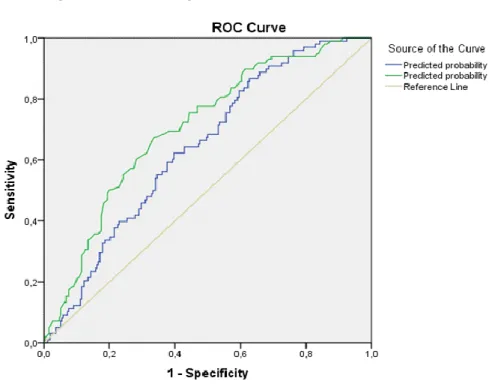
It can be seen that the categories along the WOE value decreases monotonically, so the continuous variable BMI has a monotonic relationship with the target variables, the higher BMI values attract higher complication rates. The variable was not found to be significant in our original model. The re-run the regression with the continuous age and body mass index categorized variables obtains the following results.
5. Table. Parameter estimation(Age, BMIKAT2)
Variables in the Equation
B S.E. Wald df Sig. Exp(B)
Step 1 Age ,034 ,009 13,767 1 ,000 1,035
BMIKAT2 ,879 ,189 21,561 1 ,000 2,409
Constant -4,615 ,711 42,113 1 ,000 ,010
The body mass index is already significant here, and accordingly the fitness of the model is now much better (GINI = 40%) than for the original model. In the following figure ROC curves are related to both models can be studied simultaneously.
2. figure. ROC curve (Age, BMIKAT2)
Testing Hypotheses 3
In the case of third hypotheses the fundamental question is how many categories have to be created for the new variable by categorizing the original continuous variable, and where are the boundaries of the these categories.. As the number of categories and location of these impacts the explanatory power of the final variables in the model. So no matter how the allocation is carried out in a continuous scale. The feature of an algorithm for the optimal allocation is, that within the emerging categories the homogeneity, while among the
categories the heterogeneity should be the greatest comparing with the target variable. Such alghoritm is the sub-algorithm of the recursive decision tree procedure called CHAID (Chi- squared Automatic Interaction Detector). The algorithm is designed to provide to merge those categories of the variable with K different categories1, which differs at the least2. To do this, the algorithm selects two of the Xi categorized continuous variable categories in all possible ways. If the examined explanatory variables has K different categories, the selection could be achived in K* (K-1) / 2 different ways. Than for K*(K-1)/2 different, (2 x m) size, contingency table the Pearson khi-square tests are calculated. In the next step the table is selected with the highest „p” value. The method than compares this „p” value with a predefined αmerging threshold value defined by the model maker. If p > αmerging for a certain Xi pair of category of the examined contingency table, the alghoritm merges these two categories into a new single category.
The categories of merging cycle continues until the contingency table with the highest „p”
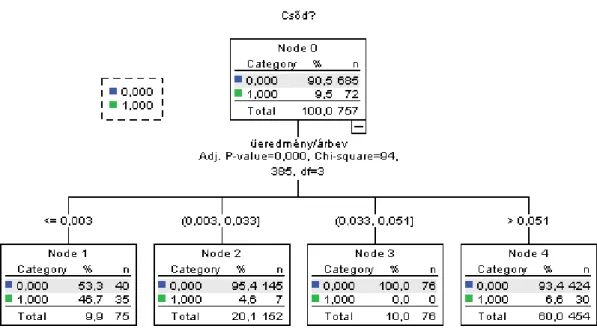
value p < αmerging criteria is fullfilled. In the next step the alghoritm calculates the „p” values for the X comlpete, merged new structure of categories. The following figure shows the outcome of the algorithm3 in a case of a specific continuous variable
3. figure.CHAID-based categorization
1 The default setting for continouous variables is K=10.
Given a bank database of domestic medium-sized business customers. The continuous financial ratio is the Operating income/ total revenue (üzemieredmény/árbevétel on the figure 3). In the rectangles of the figure can be seen the distributions of the target variable (Bankruptcy/Csőd) splitted by the categories of the financial ratio. As in top rectangle (at the top of the tree diagram) can be seen, the initial database contains 685 non-bankruptcy and 72 bankruptcy companies. The category boundaries are the following according to the figure:
0,003 between the first and second categories
0,033 between the second and third categories
0,051 between the third and fourth categories
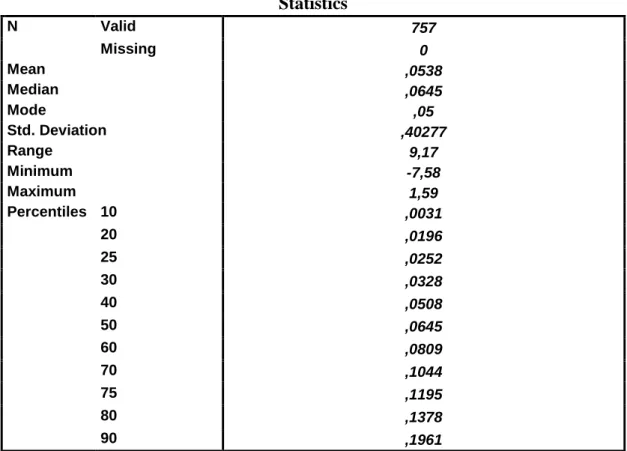
After that, we looked at what happens when the category boundaries formed along with other categorization logic. We used the main descriptive statistics of the continuous variable of Operating income/ total revenue. The following table shows these figures:
6. Table. Operating income/total revenue
Statistics
N Valid 757
Missing 0
Mean ,0538
Median ,0645
Mode ,05
Std. Deviation ,40277
Range 9,17
Minimum -7,58
Maximum 1,59
Percentiles 10 ,0031
20 ,0196
25 ,0252
30 ,0328
40 ,0508
50 ,0645
60 ,0809
70 ,1044
75 ,1195
80 ,1378
90 ,1961
These basic statistics were used to define four different categorization method in the following manner:
1. Categorical variable with four categories defined by the three quartiles, marked by
„Q123KAT”
2. Categorical variable with four categories. The distribution is arbitrarily splitted by three different points, marked by „SCALEKAT”
3. Binary variable defined by the median of the distribution, marked by „MEDIANKAT”
4. Binary variable defined by the mean of the distribution, marked by „MEANKAT”
As a result of CHAID-based optimal categorization process the final and optimal categorical variable is named by „CHAIDKAT”, where the category boundaries are the following: 0,003;
0,033 és 0,051.
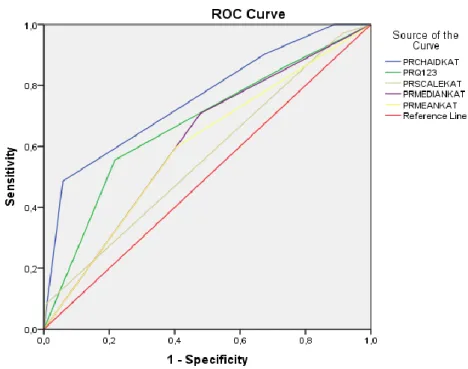
The goal of the analyses to compare the predictive power of the variables derived from the alternative categorization methods to the predictive power of the optimal categorized variable„CHAIDKAT”. We run logistic regression models on each categorical variables, than the fitness of the models were evaluated by ROC curves and GINI coefficient.
In the following figure and table the joint ROC curves and the GINI indexes of the individual models can be seen:
4. figure. Joint ROC curve.
As the above figure shows the largest area under ROC curve (blue line) and therefore the best fitted model is related to the optimal „CHAIDKAT” variable. The following table summarizes
7. Table. GINI values
Variable CHAIDKAT Q123KAT MEDIANKAT MEANKAT SCALEKAT
GINI 51,4% 34,7% 23% 19,3% 13%
The study clearly demonstrated on a specific dataset, that the optimal CHAID-based categorization method insure the maximal predictive power of a certain continuous variable in logistic regression model.
New Research Results
Managed to to demonstrate that appropriate treatment of observations with extreme values increase the classification power of the regression (hypotheses 1). Similarly was shown that in the case of continuous variables, the variable categorization can improve the fit of the model,even if the relationship between the target variable and the continuous explanatory variable is monotonous (hypotheses 2). We have presented a new method in order to define an optimal categorization for continuous variables and we presented this method on a specific dataset. (hypotheses 3).
Publications
Hungarian-language Publications
Hámori Gábor: “Fizetésképtelenség előrejelzése logit-modellel (Bankruptcy prediction by logit model)”. Bankszemle. 2001 / 1-2. p.65-87
Hámori Gábor: “Chaid-alapú döntési fák jellemzői (Characteristics of CHAID–based decision trees) ”. Statisztikai Szemle 79. 2001 / 8 p.703-710
Csákány Tibor- Hámori Gábor:”Szofisztikált kockázatkezelési módszerek egészségügyi alkalmazásokban/kórházi környezetben (Sophisticated risk management techniques in health administration / hospital environments)”, Kórház 2012/12 p.18-19
Hámori Gábor: „Érvényesség és korlátok az algoritmikus döntéshozatalban (Validity and limitations of algorithmic decision-making)”. Peer-reviewed and accepted, Expected publishin date in Gazdaság és Pénzügy: 2015/4 p.1-11
Hámori Gábor:"Magyarázó változók kezelésének egyes kérdései regressziós modellezés során (Some aspects of the treatment of explanatory variables in regression modelling)". Peer- reviewed and accepted, Expected publishin date in Statisztikai Szemle: 2016 january p.1-19
Foreign-language Publications
Gábor Hámori: „Regression based classification models and expert judgement in predictive situations”, Regional and Business Studies 2015 Vol 7 No 1, 51-60
Other
Best Papers, Global Spine Congress organized by AOSpine 2013, Hong Kong, April 4-6, 2013: Tibor Csákány, Gábor Hámori, P.P Varga: "Risk factors for surgical site infection following thoracolumbar spinal operations and a novel risk stratification model using predictive analytics".
Hámori Gábor: ”Információszerzés nagyméretű adatbázisokból (Obtain information from large databases)”, HVG Big Data conference, Budapest 28. october. 2014 (conference book in preparation)