Acoustic investigation of chocolate by changing temperature and cocoa content
KATALIN BADAK-KERTI
1p, VIKT ORIA ZSOM-MUHA
2, TAM AS ZSOM
3, D AVID NAGY
2and J OZSEF FELF OLDI €
21Department of Grain and and Industrial Plant Processing, Szent Istvan University, Faculty of Food Science, Villanyi str. 29-43, 1118 Budapest, Hungary
2Department of Physics and Control, Szent Istvan University, Faculty of Food Science, Somloi str. 16, 1118 Budapest, Hungary
3Department of Postharvest Science and Sensory Evaluation, Szent Istvan University, Faculty of Food Science, Menesi str. 44, 1118 Budapest, Hungary
CONFERENCE FULL PAPER
Received: January 31, 2020 • Accepted: September 30, 2020 Published online: October 27, 2020
© 2020 The Author(s)
ABSTRACT
In the experiments, the sound generated during the breaking of chocolate samples was examined. The fracture was performed by a precision penetrometer, the breaking sound was recorded. Texture index (TI) was calculated from the resulting signal. First the change of the resulting TI was monitored as a function of the samples’temperature. The sample groups of the same dark chocolate with different temperatures were completely separated from each other with statistical tool (LDA, linear discriminant analyses), but no trend was found to describe the change. Secondly, based on the TI, we could identify and classify the chocolate samples in the appropriate groups (based on cocoa content from 40 to 85%). According to linear discriminant analyses chocolates with different cocoa content were completely separated and showed a certain pattern. Based on the obtained results, it can be stated that the cocoa content of chocolate can be determined on the basis of TI obtained by acoustic method.
KEYWORDS
acoustic method, chocolate, texture index
pCorresponding author. E-mail: badakne.kerti.katalin@szie.hu
INTRODUCTION
The food consumed in our meals is experienced with all our senses. A lot of food gives a certain sound–like crunch, snap, crack, etc.–when consuming it. The idea that sound sensation plays an important role in the perception of textures was first published by Drake (1963), thereby promoting food texture analysis. If a crunchy product does not induce the expected sound after the bite, it can be attributed to the texture, the poor quality or inadequate components or process. Wojtowicz et al. (2015)investigated the effect of various recipes and processing con- ditions of breakfast cereals on thefinished product. From the results obtained, the appropriate manufacturing technology was determined. In their study of potato chips,Salvador et al. (2009) concluded that the force/deformation test and the acoustic information received at the same time could be an effective tool for comparing sensory results in crisp products.Mohamed et al.
(1982)also demonstrated in their study of different waffles for different influences that there is a significant correlation between sensorial sound characteristics and instrumental measurements (r50.701).Vickers (1976)found that combinations of acoustic and mechanical tests describe food sounds better than any technique alone in the case of different crispy food materials. Two main approaches are used to test the fracture’s sound, either the amplitude-time curve of the acoustic signal (Jakubczyk et al., 2017, Gondek et al., 2013, Salvador et al., 2009) or the amplitude frequency curve is taken up and is used for further analyses. Using a microphone Jakubczyk et al. (2017) tested various coated and/or stuffed extruded products. The force/
deformation test was performed with a TA-HD plus texture analyser. In the experiments of Taniwaki and Sakurai (2008), the food structure is quantitatively evaluated based on the texture index (TI), which is defined as energy density. Using texture measurements is widely spread to describe quality of chocolate, as for example was done byBiczo et al. (2013).
In our work, we aimed at compiling a mechanical-acoustic method suitable for examining chocolate products. A further objective was to investigate the effect of the sample temperature during the test and the effect of the chocolate cocoa content on the resulting sound response in dark chocolate and milk chocolate samples.
MATERIALS AND METHODS
For the temperature-dependence tests, 50% cocoa containing dark chocolate by Fin Carre (Lidl private label chocolate with a fat content of 52%) was used. Chocolate samples were placed in a fridge (þ48C) for 1 hour. Then, the temperature of 8 samples was measured every 3 minutes with an infrared thermometer and the acoustic response of their breaking was recorded, and the remaining samples were measured every 5 min. Three parallel measurements were made on the same batch of chocolates (a total of 39 samples). From the measured temperatures, 5 temper- ature groups were formed (Group 1–8–108C, Group 2–13.1–168C, Group 3–16.1–198C, Group 4–19.1–22 8C and Group 5–22.1–258C), in which samples were classified.
For the cocoa content test, samples were provided by Interfood & Pharma Kft. The choc- olates were of the same shape, with varying cocoa contents, 20 samples for each cocoa content were tested. Chocolate cubes (25 mm*20mm*7mm) were placed in a fridge for one day before the acoustic tests and their temperatures were recorded directly before measuring. Six types of dark chocolate and 2 types of milk chocolate were examined (a total of 160 samples). The list of different types and cocoa contents of the chocolates is shown inTable 1.
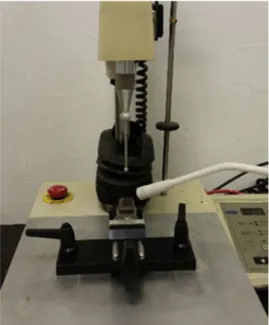
The sound of the chocolate breaking was recorded using a microphone in the set up shown inFig. 1and recorded with a‘WavePad’ program (WavePad Sound Editor v 5.02, NCH Soft- ware) at 44.1 kHz sampling frequency. The chocolate pieces were supported by a ring-shaped sample holder. For the breaking SMS TA-XT2 Precision Penetrometer (by Stable Microsystems Ltd.) with spherical probe was used, penetration depth was 7 mm and the rate of speed was 1 mm/s. Then the data from the scanned signal were normalised to always be between–1 and 1, and then they were analysed using the Fast Fourier Transform (FFT).
The frequency-domain data (20 Hz–20 kHz range) were then sub-divided into third-octave intervals and the TI was calculated for each frequency band:
Table 1.Chocolate samples
Name Cocoa content (%) Fat content (%) Type Description
Santander 85 48–52 Dark Single origin chocolate
Peru 72 41–45 Dark Single origin chocolate
Arauca 70 41–44 Dark Single origin chocolate
Huila 65 36–39 Dark Single origin chocolate
Macondo 60 34–37 Dark Casa luker cacao
Sombra 54 32–34 Dark Casa luker cacao
Colombia 45 32–35 Milk Single origin chocolate
Noche 40 32–35 Milk Casa luker cacao
Fig. 1.Set up of the acoustic measurements using SMS TA-XT2
TI¼ ðfL$fHÞ1 n
Xn
i¼1Vi2
where
- fL represents the lowest and fHthe highest frequency of each frequency band (third-octave intervals),
- Viis the amplitude of the texture signal, and
- nis the number of data points in the given frequency band.
The processing of the signal and the calculation of the ‘Texture Index’ were done in the Mathcad program based on the algorithm developed by the Department of Physics and Control, SZIU. In further analyses this parameter was used to characterise the acoustic response of the chocolate’s fractioning.
The statistical analyses of the data were performed by using Rstudio (R-project 3.4.1) statistical program. partial least squares regression (PLSR) analysis was used to find the correlation between the cocoa content and the frequency. Linear Discrimination Analysis (LDA) was applied to separate groups in the various measurements for acoustic sound characteristics.
RESULTS AND DISCUSSION
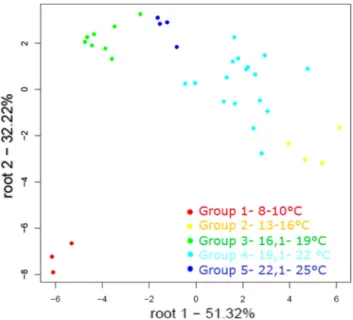
In the first experiment, the effect of the temperature on the acoustic response of chocolate fractioning was investigated. On the basis of our results, samples in the higher temperature groups got higher‘texture index’ values. Linear discrimination analysis (LDA) showed clearly (Fig. 2) that chocolate samples of different temperature groups could be distinguished by their sound signal. However, we did notfind a model which could describe consequently the change in the acoustic signal and the temperature.
In the second experiment, different cocoa-containing samples were tested for acoustic sound response. Using the results obtained by the acoustic measurements and the calculated texture index we were able to identify and classify the chocolate samples corresponding to their cocoa content with 100% certainty. The Linear Discrimination Analysis (LDA) diagram (Fig. 3) il- lustrates well that different chocolate cocoa-containing chocolates are nicely separated from each other and even show some pattern.
There are three directions along the increasing cocoa content, which divides our data into three groups: Group 1: milk chocolate (40%, 45% cocoa content), Group 2: chocolates with 54– 65% cocoa content, Group 3: dark chocolate with 70–85% cocoa content.
The separation of the first group (milk chocolates) is obvious because their composition differs significantly from dark chocolates, as they contain milk, which softens their texture and are therefore more flexible. Both hardness and flexibility are of great significance to the sound intensity of the chocolates, as if energy is released quickly, high intensity sounds will be generated. Thus, the hard texture with low degree of flexibility (less elastic) is more likely to provide rapid release after breaking and thus high intensity sound output. The more elastic nature allows greater deformation of the samples throughout the break, resulting in slower energy release (Gregerson et al., 2015).
Fig. 2.LDA analysis of the acoustic responses of chocolate samples at different temperatures
Fig. 3.LDA analysis of the‘texture index’of different cocoa containing chocolate samples (numbers are confirming the cocoa content of the samples)
We do not know exactly the reason for the difference between Group 2 and Group 3. There is no information about the exact composition of the samples; but the fat composition of cocoa beans grown at different locations may differ, which affects the properties of the chocolates.
PLSR regression was performed, the results of which are shown inFig. 4. Separately, PLSR was performed only on the dark chocolate groups (Fig. 4a) and on all samples used for the cocoa content test (Fig. 4b). In both cases, a significant relationship was found between the cocoa content and the sound response of the breaking.
The frequency at which the largest value of the regression vector was given was 68 Hz for only dark chocolates and 217 Hz for all chocolate samples together. All chocolate samples analysed together gave a higherR2value (0.8397) and validation was also better (R250.7218) compared to the analysis of dark chocolate samples only. There was in any case close rela- tionship between the cocoa content and the crispness of the chocolate samples, which should be taken care of, as the sound released during breakage plays an important role in consumers’
perception of different food products, especially for chocolate.
CONCLUSIONS
Breaking sound of chocolate is an important parameter for judging the eating experience. A well-tempered, high cocoa containing chocolate is expected to break with a snap.
From our experiments we can conclude that measuring the acoustic signal of chocolates’ breaking is suitable for testing the chocolates’texture. With the help of calculated texture index, sample groups of different temperatures could be distinguished, but we did notfind a trend that describes the change.
Dark chocolate samples (50% cocoa content) of different temperatures gave different texture index values (higher temperature samples had higher texture indexes), and although the Fig. 4.PLRS regression results of texture indexes of (a) dark chocolate and a (b) chocolates with different
cocoa contents
temperature-groups could be distinguished 100% correctly by linear discriminant analysis, no correlation could be described between temperature and texture index.
Using texture index (based on the acoustic response values) we could identify the chocolate samples in the corresponding cocoa-containing group 100% correctly (from milk chocolate samples to dark chocolate samples, i.e. 54–65% cocoa and 70–85% cocoa).
Linear discriminant analyses distinguished among different chocolate samples based on their cocoa content and a certain pattern was recognisable. There were three directions according to the cocoa content, which divided our data into three groups. Group 1: milk chocolates (40%, 45% cocoa content), Group 2: chocolates with 54–65% cocoa content and Group 3: dark chocolates with 70–85% cocoa content.
These results are certainly inspiring and further studies are required as they provide a possible new measurement method. Using acoustic response, a quick method for estimating the cocoa content of chocolate could be established, with suitable equipment and the support of a statistical model. This new method would not require any sample preparation, and it was based on purely physical parameters instead of chemical characteristics.
ACKNOWLEDGEMENTS
The Authors wish to thank the Interfood & Pharma Ltd for supplying the chocolate samples.
The Project was supported by the European Union and co-financed by the European Social Fund (grant agreement no. EFOP-3.6.3-VEKOP-16-2017-00005).
REFERENCES
Biczo, V., Fekete, A., and Scherer, R. (2013). Influence of composition and storage conditions on chocolate hardness and heat resistance.Progress in Agricultural Engineering Sciences, 9(1): 55–73.
Drake, B.K. (1963). Food crushing sounds. An introductory study. Journal of Food Science, 28(2):
233–241.
Gondek, E., Jakubczyk, E., Herremans, E., Verlinden, B., Hertog, M., Vandendriessche, T., Verboven, P., Bongaers, A.A.E., Estrade, P., and Nicolaı€, B.M. (2013). Acoustic, mechanical and microstructural properties of extruded crisp bread.Journal of Cereal Science, 58(1): 132–139.
Gregerson, S.B., Povey, M.J.W., Kidmose, U., Andersen, M.D., Hammershøj, M., and Wiking, L. (2015).
Identification of important mechanical and acoustic parameters for the sensory quality of cocoa butter alternatives.Food Research International, 76: 637–644.
Jakubczyk, E., Gondek, E., and Tryzno, E. (2017). Application of novel acoustic measurement techniques for texture analysis of co-extruded snacks.LWT–Food Science and Technology, 75: 582–589.
Mohamed, A.A.A., Jowitt, R., and Brennan, J.G. (1982). Instrumental and sensory evalutaion of crispness: I –in friable foods.Journal of Food Engineering, 1: 55–75.
Salvador, A., Varela, P., Sanz, T., and Fiszman, S.M. (2009). Understanding potato chips crispy texture by simultaneous fracture and acoustic measurements, and sensory analysis.LWT – Food Science and Technology, 42: 763–767.
Taniwaki, M. and Sakurai, N. (2008). Texture measurement of cabbages using an acoustical vibration method.Postharvest Biology and Technology, 50: 176–181.
Vickers, Z.M. and Bourne, M.C. (1976). A psychoacoustical theory of crispness.Journal of Food Science, 41:
1158–1164.
Wojtowicz, A., Mitrus,M., Oniszczuk, T., Moscicki, L., Kre¸cisz, M., and Oniszczuk, A. (2015). Selected physical properties, texture and sensory characteristics of extruded breakfast cereals based on whole grain wheatflour.Agriculture and Agricultural Science Procedia, 7: 301–308.
Open Access. This is an open-access article distributed under the terms of the Creative Commons Attribution 4.0 International License (https://creativecommons.org/licenses/by/4.0/), which permits unrestricted use, distribution, and reproduction in any medium, provided the original author and source are credited, a link to the CC License is provided, and changes–if any–are indicated. (SID_1)