Automatic classification possibilities of the voices of children with dysphonia
M. G. Tulics and K. Vicsi are with the Department of Telecommunications and Media Informatics, Budapest University of Technology and Economics, Magyar Tudósok krt. 2., Budapest 1117, Hungary
(email: tulics,vicsi@tmit.bme.hu., url: http://www.tmit.bme.hu)
DOI: 10.36244/ICJ.2018.3.5
SEPTEMBER 2018 • VOLUME X • NUMBER 3 30
INFOCOMMUNICATIONS JOURNAL
Abstract—Dysphonia is a common complaint, almost every fourth child produces a pathological voice. A mobile based filtering system, that can be used by pre-school workers in order to recognize dysphonic voiced children in order to get professional help as soon as possible, would be desired. The goal of this research is to identify acoustic parameters that are able to distinguish healthy voices of children from those with dysphonia voices of children. In addition, the possibility of automatic classification is examined. Two sample T-tests were used for statistical significance testing for the mean values of the acoustic parameters between healthy voices and those with dysphonia. A two-class classification was performed between the two groups using leave-one-out cross validation, with support vector machine (SVM) classifier.
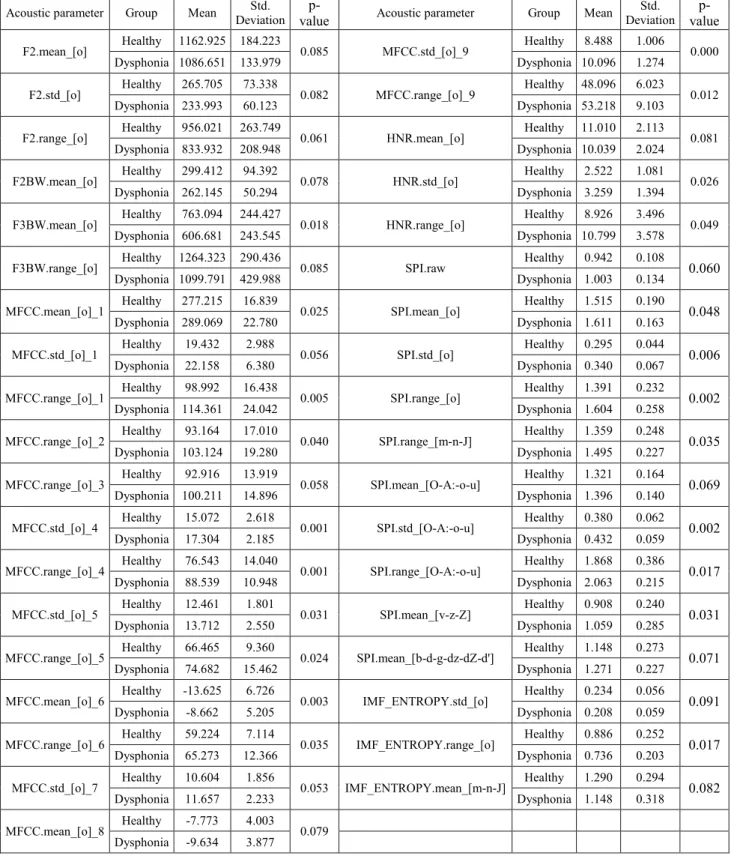
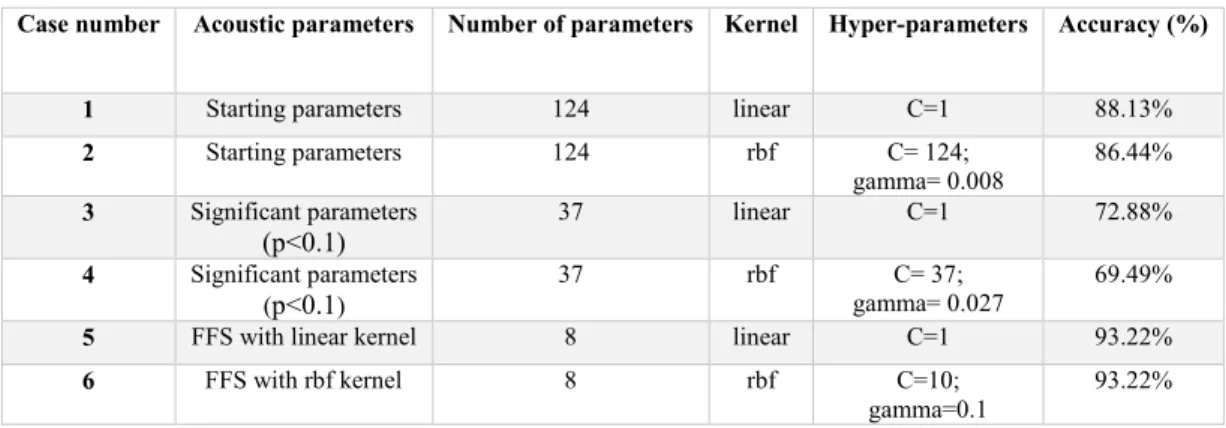
Formant frequencies, mel-frequency cepstral coefficients (MFCCs), Harmonics-to-Noise Ratio (HNR), Soft Phonation Index (SPI) and frequency band energy ratios, based on intrinsic mode functions (𝐈𝐈𝐈𝐈𝐈𝐈𝐞𝐞𝐞𝐞𝐞𝐞𝐞𝐞𝐞𝐞𝐞𝐞𝐞𝐞) measured on different variations of phonemes showed statistical difference between the groups. A high classification accuracy of 93% was achieved by SVM with linear and rbf kernel using only 8 acoustic parameters. Additional data is needed to build a more general model, but this research can be a reference point in the classification of voices using continuous speech between healthy children and children with dysphonia.
Index Terms — voice disorder, statistical analysis, acoustic parameters, dysphonia, classification
I. INTRODUCTION
ysphonia is a common complaint, reported in nearly one- third of the population at some point in their life. It affects the formation of clear and distinct sounds in speech as a complex function, a pathological condition showing various symptoms due to several etiologic factors and pathogenesis diversity [1]. The term dysphonia is often incorrectly used when referring to hoarseness, however hoarseness is a symptom of altered voice quality reported in patients, while dysphonia can be defined as altered pitch, loudness, or vocal quality or effort that impairs communication as assessed by a clinician and affects the patients’ life [2]. The development of cheap, easy- to-use and lightweight methods that alert subjects of possible health problems is desired.
Mobile technology is attractive, since it is easy to use and it is a nearly constant feature of daily life. The number of mobile applications is growing in healthcare. A smartphone or tablet could be an ideal mobile tool to use with complex methods that
M. G. Tulics and K. Vicsi are with the Department of Telecommunications and Media Informatics, Budapest University of Technology and Economics,
can offer clues for general physicians in identifying the early stages of dysphonia.
Researchers target such applications for the early diagnosis of pathological voices in case of adults. In the work of [3] a mobile health (m-Health) application is presented for voice screening of adults by using a mobile device. The system is able to distinguish healthy voices from pathological ones using a noise-aware method that provides a robust estimation of the fundamental frequency during a sustained production of the vowel /a/.
Some systems record more than voice disorders, also recording other details regarding the general health of a patient.
In [4] a healthcare framework based on the Internet of Things (IoT) and cloud computing, the system is able to capture voice, body temperature, electrocardiogram, and ambient humidity.
Most of the research on the subject currently focuses on the accurate estimation of dysphonia, rather than the development of practical applications.
Dysphonia affects patients of all ages, however research suggests that risks are higher in pediatric and elderly (>65 years of age) populations. 23.4% of pediatric patients have dysphonia at some point during their childhood [5], [6], [7], [8]. The data therefore suggests that almost every fourth child produces a pathological voice. Studies agree that dysphonia is more often reported among boys than girls, the ratio being 70-30%.
In the last 10-20 years many studies focused on dysphonia in adults, not only on sustained vowels, but on running speech as well [9], [10]. However, in the literature we can find some studies focusing on the dysphonic voices of children.
Previous studies regarding the analysis of pathological children’s voice focused mainly on sustained vowels.
Researchers mostly work with small sample sizes because it is difficult to collect recordings from children. Janete Coelho and his colleagues [11] analyzed the perceptual and acoustic vocal parameters of school age children with vocal nodules and to compared them with a group of children without vocal nodules.
Five children were examined from both genders, aged from 7 to 12 years. The Mann–Whitney U test, with p < 0.05 significance level was used in their work. Statistically significant differences were registered between the group of vocal nodules vs. the group without vocal nodules, on the following parameters: fundamental frequency, shimmer, HNR , maximum phonation time for /a/ e /z/, s/z coefficient and GRBASI (Grade, Roughness, Breathiness, Asthenia, Strain, Magyar Tudósok krt. 2., Budapest 1117, Hungary (email:
tulics,vicsi@tmit.bme.hu., url: http://www.tmit.bme.hu)
Automatic classification possibilities of the voices of children with dysphonia
Miklós Gábriel Tulics and Klára Vicsi
D
Automatic classification possibilities of the voices of children with dysphonia
Miklós Gábriel Tulics and Klára Vicsi
Instability). On jitter and maximum phonation time for /s/ there were no statistically significant differences.
The study of Gopi Kishore Pebbili and his colleagues [12]
aimed to document the Dysphonia Severity Index (DSI) scores of 42 Indian children aged 8–12 years. DSI values were found to be significantly higher (p=0.027) in girls than in boys. DSI attempts to measure the severity of dysphonia based on the sustained production of a vowel, using a weighted combination of maximum phonation time, highest frequency, lowest intensity, and jitter (%) of an individual.
In [13] correlation between perceptual and acoustic data was examined to identify measures that are useful in determining the severity of voice deviation in children. Recordings from 71 children (aged 3–9 years) were used, containing the sustained sound /ε/ and the counting of numbers from 1 to 10. Results showed that F0 measures correlate with strain to phonate;
shimmer and GNE parameters correlate with general degree of voice deviation.
In our earlier research [14] continuous speech was examined, where we investigated the relationship between the voices of healthy children and those with functional dysphonia (FD). The statistical analyses drew the conclusion that variations of jitter and shimmer values with HNR (Harmonics-to-Noise Ratio) and the first component (c1) of the mel-frequency cepstral coefficients (referred to as ‘MFCC01’) are good indicators to separate healthy voices from voices with FD in the case of children. Samples from healthy children and adult voices were also compared giving a clear conclusion that differences exist in the examined acoustical parameters even between the two groups. It is necessary to carry out the investigations separately on children's voices as well; we cannot use adult voices to draw any conclusions regarding children's voices.
The goal of this research is to identify further acoustic parameters that are able to distinguish healthy voices of children from ones with dysphonia. For this reason statistical analyses was prepared, followed by a detailed classification experiment. Thus, setting a basis of a future mobile health application for the early recognition of dysphonia in the case of children.
Section 2 briefly describes the speech material used in the
experiments, followed by the description of the measured acoustic parameters, the statistical evaluation, parameter reduction and model building. Our results are shown in Section 3, followed by the discussion and the future direction in Section 4.
II. MATERIALSANDMETHODS
A diagnostic support system for the early recognition of dysphonia in the voices of children would follow the logic described in Fig 1. The A/D converter digitizes the analogue speech signal of the child, after which the signal is normalized. In continuous speech, the measuring locations must be determined. Since in this work the acoustic parameters are measured on phonemes, phoneme level segmentation is required. Acoustic parameters (described in paragraph B) are extracted from the selected phonemes and arranged into a feature vector. The feature vector is given to a classifier to perform binary classification (healthy or unhealthy). Prior knowledge is gained by the processing of a carefully built speech database (described in paragraph A) and an optimal classification model using the acoustic parameters with great distinguishing power (classifier model). The system produces an output; this decision is shown on the user interface of the application. This study focuses on the automatic classification of voices of children with dysphonia.
A. Dysphonic and Healthy Child Speech Database
Sound samples from children were collected at several kindergartens. All the recordings were made with parental consent, mostly in the presence of the children's parents. The children recited a poem entitled “The Squirrel”, written by a logopedic specialist. This poem was chosen for therapeutic reasons, speech therapists using the poem during treatment, and because children in the 5-10 year old age group are very fond of the poem and it is easy for them to learn. The most frequent vowel in the poem is the vowel [o], with 16 pieces followed by 14 pieces of the vowel [O] and 9 pieces of vowel [E].
The recordings were made using a near field microphone (Monacor ECM-100), Creative Soundblaster Audigy 2 NX outer USB sound card, with 44.100 Hz sampling rate and 16-bit Fig. 1. Proposed framework for the recognition of dysphonic voiced children
Abstract—Dysphonia is a common complaint, almost every fourth child produces a pathological voice. A mobile based filtering system, that can be used by pre-school workers in order to recognize dysphonic voiced children in order to get professional help as soon as possible, would be desired. The goal of this research is to identify acoustic parameters that are able to distinguish healthy voices of children from those with dysphonia voices of children. In addition, the possibility of automatic classification is examined. Two sample T-tests were used for statistical significance testing for the mean values of the acoustic parameters between healthy voices and those with dysphonia. A two-class classification was performed between the two groups using leave-one-out cross validation, with support vector machine (SVM) classifier.
Formant frequencies, mel-frequency cepstral coefficients (MFCCs), Harmonics-to-Noise Ratio (HNR), Soft Phonation Index (SPI) and frequency band energy ratios, based on intrinsic mode functions (𝐈𝐈𝐈𝐈𝐈𝐈𝐞𝐞𝐞𝐞𝐞𝐞𝐞𝐞𝐞𝐞𝐞𝐞𝐞𝐞) measured on different variations of phonemes showed statistical difference between the groups. A high classification accuracy of 93% was achieved by SVM with linear and rbf kernel using only 8 acoustic parameters. Additional data is needed to build a more general model, but this research can be a reference point in the classification of voices using continuous speech between healthy children and children with dysphonia.
Index Terms — voice disorder, statistical analysis, acoustic parameters, dysphonia, classification
I. INTRODUCTION
ysphonia is a common complaint, reported in nearly one- third of the population at some point in their life. It affects the formation of clear and distinct sounds in speech as a complex function, a pathological condition showing various symptoms due to several etiologic factors and pathogenesis diversity [1]. The term dysphonia is often incorrectly used when referring to hoarseness, however hoarseness is a symptom of altered voice quality reported in patients, while dysphonia can be defined as altered pitch, loudness, or vocal quality or effort that impairs communication as assessed by a clinician and affects the patients’ life [2]. The development of cheap, easy- to-use and lightweight methods that alert subjects of possible health problems is desired.
Mobile technology is attractive, since it is easy to use and it is a nearly constant feature of daily life. The number of mobile applications is growing in healthcare. A smartphone or tablet could be an ideal mobile tool to use with complex methods that
M. G. Tulics and K. Vicsi are with the Department of Telecommunications and Media Informatics, Budapest University of Technology and Economics,
can offer clues for general physicians in identifying the early stages of dysphonia.
Researchers target such applications for the early diagnosis of pathological voices in case of adults. In the work of [3] a mobile health (m-Health) application is presented for voice screening of adults by using a mobile device. The system is able to distinguish healthy voices from pathological ones using a noise-aware method that provides a robust estimation of the fundamental frequency during a sustained production of the vowel /a/.
Some systems record more than voice disorders, also recording other details regarding the general health of a patient.
In [4] a healthcare framework based on the Internet of Things (IoT) and cloud computing, the system is able to capture voice, body temperature, electrocardiogram, and ambient humidity.
Most of the research on the subject currently focuses on the accurate estimation of dysphonia, rather than the development of practical applications.
Dysphonia affects patients of all ages, however research suggests that risks are higher in pediatric and elderly (>65 years of age) populations. 23.4% of pediatric patients have dysphonia at some point during their childhood [5], [6], [7], [8]. The data therefore suggests that almost every fourth child produces a pathological voice. Studies agree that dysphonia is more often reported among boys than girls, the ratio being 70-30%.
In the last 10-20 years many studies focused on dysphonia in adults, not only on sustained vowels, but on running speech as well [9], [10]. However, in the literature we can find some studies focusing on the dysphonic voices of children.
Previous studies regarding the analysis of pathological children’s voice focused mainly on sustained vowels.
Researchers mostly work with small sample sizes because it is difficult to collect recordings from children. Janete Coelho and his colleagues [11] analyzed the perceptual and acoustic vocal parameters of school age children with vocal nodules and to compared them with a group of children without vocal nodules.
Five children were examined from both genders, aged from 7 to 12 years. The Mann–Whitney U test, with p < 0.05 significance level was used in their work. Statistically significant differences were registered between the group of vocal nodules vs. the group without vocal nodules, on the following parameters: fundamental frequency, shimmer, HNR , maximum phonation time for /a/ e /z/, s/z coefficient and GRBASI (Grade, Roughness, Breathiness, Asthenia, Strain, Magyar Tudósok krt. 2., Budapest 1117, Hungary (email:
tulics,vicsi@tmit.bme.hu., url: http://www.tmit.bme.hu)
Automatic classification possibilities of the voices of children with dysphonia
Miklós Gábriel Tulics and Klára Vicsi
D
Instability). On jitter and maximum phonation time for /s/ there were no statistically significant differences.
The study of Gopi Kishore Pebbili and his colleagues [12]
aimed to document the Dysphonia Severity Index (DSI) scores of 42 Indian children aged 8–12 years. DSI values were found to be significantly higher (p=0.027) in girls than in boys. DSI attempts to measure the severity of dysphonia based on the sustained production of a vowel, using a weighted combination of maximum phonation time, highest frequency, lowest intensity, and jitter (%) of an individual.
In [13] correlation between perceptual and acoustic data was examined to identify measures that are useful in determining the severity of voice deviation in children. Recordings from 71 children (aged 3–9 years) were used, containing the sustained sound /ε/ and the counting of numbers from 1 to 10. Results showed that F0 measures correlate with strain to phonate;
shimmer and GNE parameters correlate with general degree of voice deviation.
In our earlier research [14] continuous speech was examined, where we investigated the relationship between the voices of healthy children and those with functional dysphonia (FD). The statistical analyses drew the conclusion that variations of jitter and shimmer values with HNR (Harmonics-to-Noise Ratio) and the first component (c1) of the mel-frequency cepstral coefficients (referred to as ‘MFCC01’) are good indicators to separate healthy voices from voices with FD in the case of children. Samples from healthy children and adult voices were also compared giving a clear conclusion that differences exist in the examined acoustical parameters even between the two groups. It is necessary to carry out the investigations separately on children's voices as well; we cannot use adult voices to draw any conclusions regarding children's voices.
The goal of this research is to identify further acoustic parameters that are able to distinguish healthy voices of children from ones with dysphonia. For this reason statistical analyses was prepared, followed by a detailed classification experiment. Thus, setting a basis of a future mobile health application for the early recognition of dysphonia in the case of children.
Section 2 briefly describes the speech material used in the
experiments, followed by the description of the measured acoustic parameters, the statistical evaluation, parameter reduction and model building. Our results are shown in Section 3, followed by the discussion and the future direction in Section 4.
II. MATERIALSANDMETHODS
A diagnostic support system for the early recognition of dysphonia in the voices of children would follow the logic described in Fig 1. The A/D converter digitizes the analogue speech signal of the child, after which the signal is normalized. In continuous speech, the measuring locations must be determined. Since in this work the acoustic parameters are measured on phonemes, phoneme level segmentation is required. Acoustic parameters (described in paragraph B) are extracted from the selected phonemes and arranged into a feature vector. The feature vector is given to a classifier to perform binary classification (healthy or unhealthy). Prior knowledge is gained by the processing of a carefully built speech database (described in paragraph A) and an optimal classification model using the acoustic parameters with great distinguishing power (classifier model). The system produces an output; this decision is shown on the user interface of the application. This study focuses on the automatic classification of voices of children with dysphonia.
A. Dysphonic and Healthy Child Speech Database
Sound samples from children were collected at several kindergartens. All the recordings were made with parental consent, mostly in the presence of the children's parents. The children recited a poem entitled “The Squirrel”, written by a logopedic specialist. This poem was chosen for therapeutic reasons, speech therapists using the poem during treatment, and because children in the 5-10 year old age group are very fond of the poem and it is easy for them to learn. The most frequent vowel in the poem is the vowel [o], with 16 pieces followed by 14 pieces of the vowel [O] and 9 pieces of vowel [E].
The recordings were made using a near field microphone (Monacor ECM-100), Creative Soundblaster Audigy 2 NX outer USB sound card, with 44.100 Hz sampling rate and 16-bit Fig. 1. Proposed framework for the recognition of dysphonic voiced children
Instability). On jitter and maximum phonation time for /s/ there were no statistically significant differences.
The study of Gopi Kishore Pebbili and his colleagues [12]
aimed to document the Dysphonia Severity Index (DSI) scores of 42 Indian children aged 8–12 years. DSI values were found to be significantly higher (p=0.027) in girls than in boys. DSI attempts to measure the severity of dysphonia based on the sustained production of a vowel, using a weighted combination of maximum phonation time, highest frequency, lowest intensity, and jitter (%) of an individual.
In [13] correlation between perceptual and acoustic data was examined to identify measures that are useful in determining the severity of voice deviation in children. Recordings from 71 children (aged 3–9 years) were used, containing the sustained sound /ε/ and the counting of numbers from 1 to 10. Results showed that F0 measures correlate with strain to phonate;
shimmer and GNE parameters correlate with general degree of voice deviation.
In our earlier research [14] continuous speech was examined, where we investigated the relationship between the voices of healthy children and those with functional dysphonia (FD). The statistical analyses drew the conclusion that variations of jitter and shimmer values with HNR (Harmonics-to-Noise Ratio) and the first component (c1) of the mel-frequency cepstral coefficients (referred to as ‘MFCC01’) are good indicators to separate healthy voices from voices with FD in the case of children. Samples from healthy children and adult voices were also compared giving a clear conclusion that differences exist in the examined acoustical parameters even between the two groups. It is necessary to carry out the investigations separately on children's voices as well; we cannot use adult voices to draw any conclusions regarding children's voices.
The goal of this research is to identify further acoustic parameters that are able to distinguish healthy voices of children from ones with dysphonia. For this reason statistical analyses was prepared, followed by a detailed classification experiment. Thus, setting a basis of a future mobile health application for the early recognition of dysphonia in the case of children.
Section 2 briefly describes the speech material used in the
experiments, followed by the description of the measured acoustic parameters, the statistical evaluation, parameter reduction and model building. Our results are shown in Section 3, followed by the discussion and the future direction in Section 4.
II. MATERIALSANDMETHODS
A diagnostic support system for the early recognition of dysphonia in the voices of children would follow the logic described in Fig 1. The A/D converter digitizes the analogue speech signal of the child, after which the signal is normalized.
In continuous speech, the measuring locations must be determined. Since in this work the acoustic parameters are measured on phonemes, phoneme level segmentation is required. Acoustic parameters (described in paragraph B) are extracted from the selected phonemes and arranged into a feature vector. The feature vector is given to a classifier to perform binary classification (healthy or unhealthy). Prior knowledge is gained by the processing of a carefully built speech database (described in paragraph A) and an optimal classification model using the acoustic parameters with great distinguishing power (classifier model). The system produces an output; this decision is shown on the user interface of the application. This study focuses on the automatic classification of voices of children with dysphonia.
A. Dysphonic and Healthy Child Speech Database
Sound samples from children were collected at several kindergartens. All the recordings were made with parental consent, mostly in the presence of the children's parents. The children recited a poem entitled “The Squirrel”, written by a logopedic specialist. This poem was chosen for therapeutic reasons, speech therapists using the poem during treatment, and because children in the 5-10 year old age group are very fond of the poem and it is easy for them to learn. The most frequent vowel in the poem is the vowel [o], with 16 pieces followed by 14 pieces of the vowel [O] and 9 pieces of vowel [E].
The recordings were made using a near field microphone (Monacor ECM-100), Creative Soundblaster Audigy 2 NX outer USB sound card, with 44.100 Hz sampling rate and 16-bit Fig. 1. Proposed framework for the recognition of dysphonic voiced children
Abstract—Dysphonia is a common complaint, almost every fourth child produces a pathological voice. A mobile based filtering system, that can be used by pre-school workers in order to recognize dysphonic voiced children in order to get professional help as soon as possible, would be desired. The goal of this research is to identify acoustic parameters that are able to distinguish healthy voices of children from those with dysphonia voices of children. In addition, the possibility of automatic classification is examined. Two sample T-tests were used for statistical significance testing for the mean values of the acoustic parameters between healthy voices and those with dysphonia. A two-class classification was performed between the two groups using leave-one-out cross validation, with support vector machine (SVM) classifier.
Formant frequencies, mel-frequency cepstral coefficients (MFCCs), Harmonics-to-Noise Ratio (HNR), Soft Phonation Index (SPI) and frequency band energy ratios, based on intrinsic mode functions (𝐈𝐈𝐈𝐈𝐈𝐈𝐞𝐞𝐞𝐞𝐞𝐞𝐞𝐞𝐞𝐞𝐞𝐞𝐞𝐞) measured on different variations of phonemes showed statistical difference between the groups. A high classification accuracy of 93% was achieved by SVM with linear and rbf kernel using only 8 acoustic parameters. Additional data is needed to build a more general model, but this research can be a reference point in the classification of voices using continuous speech between healthy children and children with dysphonia.
Index Terms — voice disorder, statistical analysis, acoustic parameters, dysphonia, classification
I. INTRODUCTION
ysphonia is a common complaint, reported in nearly one- third of the population at some point in their life. It affects the formation of clear and distinct sounds in speech as a complex function, a pathological condition showing various symptoms due to several etiologic factors and pathogenesis diversity [1]. The term dysphonia is often incorrectly used when referring to hoarseness, however hoarseness is a symptom of altered voice quality reported in patients, while dysphonia can be defined as altered pitch, loudness, or vocal quality or effort that impairs communication as assessed by a clinician and affects the patients’ life [2]. The development of cheap, easy- to-use and lightweight methods that alert subjects of possible health problems is desired.
Mobile technology is attractive, since it is easy to use and it is a nearly constant feature of daily life. The number of mobile applications is growing in healthcare. A smartphone or tablet could be an ideal mobile tool to use with complex methods that
M. G. Tulics and K. Vicsi are with the Department of Telecommunications and Media Informatics, Budapest University of Technology and Economics,
can offer clues for general physicians in identifying the early stages of dysphonia.
Researchers target such applications for the early diagnosis of pathological voices in case of adults. In the work of [3] a mobile health (m-Health) application is presented for voice screening of adults by using a mobile device. The system is able to distinguish healthy voices from pathological ones using a noise-aware method that provides a robust estimation of the fundamental frequency during a sustained production of the vowel /a/.
Some systems record more than voice disorders, also recording other details regarding the general health of a patient.
In [4] a healthcare framework based on the Internet of Things (IoT) and cloud computing, the system is able to capture voice, body temperature, electrocardiogram, and ambient humidity.
Most of the research on the subject currently focuses on the accurate estimation of dysphonia, rather than the development of practical applications.
Dysphonia affects patients of all ages, however research suggests that risks are higher in pediatric and elderly (>65 years of age) populations. 23.4% of pediatric patients have dysphonia at some point during their childhood [5], [6], [7], [8]. The data therefore suggests that almost every fourth child produces a pathological voice. Studies agree that dysphonia is more often reported among boys than girls, the ratio being 70-30%.
In the last 10-20 years many studies focused on dysphonia in adults, not only on sustained vowels, but on running speech as well [9], [10]. However, in the literature we can find some studies focusing on the dysphonic voices of children.
Previous studies regarding the analysis of pathological children’s voice focused mainly on sustained vowels.
Researchers mostly work with small sample sizes because it is difficult to collect recordings from children. Janete Coelho and his colleagues [11] analyzed the perceptual and acoustic vocal parameters of school age children with vocal nodules and to compared them with a group of children without vocal nodules.
Five children were examined from both genders, aged from 7 to 12 years. The Mann–Whitney U test, with p < 0.05 significance level was used in their work. Statistically significant differences were registered between the group of vocal nodules vs. the group without vocal nodules, on the following parameters: fundamental frequency, shimmer, HNR , maximum phonation time for /a/ e /z/, s/z coefficient and GRBASI (Grade, Roughness, Breathiness, Asthenia, Strain, Magyar Tudósok krt. 2., Budapest 1117, Hungary (email:
tulics,vicsi@tmit.bme.hu., url: http://www.tmit.bme.hu)
Automatic classification possibilities of the voices of children with dysphonia
Miklós Gábriel Tulics and Klára Vicsi
D
Automatic classification possibilities of the voices of children with dysphonia INFOCOMMUNICATIONS JOURNAL
SEPTEMBER 2018 • VOLUME X • NUMBER 3 31
Abstract—Dysphonia is a common complaint, almost every fourth child produces a pathological voice. A mobile based filtering system, that can be used by pre-school workers in order to recognize dysphonic voiced children in order to get professional help as soon as possible, would be desired. The goal of this research is to identify acoustic parameters that are able to distinguish healthy voices of children from those with dysphonia voices of children. In addition, the possibility of automatic classification is examined. Two sample T-tests were used for statistical significance testing for the mean values of the acoustic parameters between healthy voices and those with dysphonia. A two-class classification was performed between the two groups using leave-one-out cross validation, with support vector machine (SVM) classifier.
Formant frequencies, mel-frequency cepstral coefficients (MFCCs), Harmonics-to-Noise Ratio (HNR), Soft Phonation Index (SPI) and frequency band energy ratios, based on intrinsic mode functions (𝐈𝐈𝐈𝐈𝐈𝐈𝐞𝐞𝐞𝐞𝐞𝐞𝐞𝐞𝐞𝐞𝐞𝐞𝐞𝐞) measured on different variations of phonemes showed statistical difference between the groups. A high classification accuracy of 93% was achieved by SVM with linear and rbf kernel using only 8 acoustic parameters. Additional data is needed to build a more general model, but this research can be a reference point in the classification of voices using continuous speech between healthy children and children with dysphonia.
Index Terms — voice disorder, statistical analysis, acoustic parameters, dysphonia, classification
I. INTRODUCTION
ysphonia is a common complaint, reported in nearly one- third of the population at some point in their life. It affects the formation of clear and distinct sounds in speech as a complex function, a pathological condition showing various symptoms due to several etiologic factors and pathogenesis diversity [1]. The term dysphonia is often incorrectly used when referring to hoarseness, however hoarseness is a symptom of altered voice quality reported in patients, while dysphonia can be defined as altered pitch, loudness, or vocal quality or effort that impairs communication as assessed by a clinician and affects the patients’ life [2]. The development of cheap, easy- to-use and lightweight methods that alert subjects of possible health problems is desired.
Mobile technology is attractive, since it is easy to use and it is a nearly constant feature of daily life. The number of mobile applications is growing in healthcare. A smartphone or tablet could be an ideal mobile tool to use with complex methods that
M. G. Tulics and K. Vicsi are with the Department of Telecommunications and Media Informatics, Budapest University of Technology and Economics,
can offer clues for general physicians in identifying the early stages of dysphonia.
Researchers target such applications for the early diagnosis of pathological voices in case of adults. In the work of [3] a mobile health (m-Health) application is presented for voice screening of adults by using a mobile device. The system is able to distinguish healthy voices from pathological ones using a noise-aware method that provides a robust estimation of the fundamental frequency during a sustained production of the vowel /a/.
Some systems record more than voice disorders, also recording other details regarding the general health of a patient.
In [4] a healthcare framework based on the Internet of Things (IoT) and cloud computing, the system is able to capture voice, body temperature, electrocardiogram, and ambient humidity.
Most of the research on the subject currently focuses on the accurate estimation of dysphonia, rather than the development of practical applications.
Dysphonia affects patients of all ages, however research suggests that risks are higher in pediatric and elderly (>65 years of age) populations. 23.4% of pediatric patients have dysphonia at some point during their childhood [5], [6], [7], [8]. The data therefore suggests that almost every fourth child produces a pathological voice. Studies agree that dysphonia is more often reported among boys than girls, the ratio being 70-30%.
In the last 10-20 years many studies focused on dysphonia in adults, not only on sustained vowels, but on running speech as well [9], [10]. However, in the literature we can find some studies focusing on the dysphonic voices of children.
Previous studies regarding the analysis of pathological children’s voice focused mainly on sustained vowels.
Researchers mostly work with small sample sizes because it is difficult to collect recordings from children. Janete Coelho and his colleagues [11] analyzed the perceptual and acoustic vocal parameters of school age children with vocal nodules and to compared them with a group of children without vocal nodules.
Five children were examined from both genders, aged from 7 to 12 years. The Mann–Whitney U test, with p < 0.05 significance level was used in their work. Statistically significant differences were registered between the group of vocal nodules vs. the group without vocal nodules, on the following parameters: fundamental frequency, shimmer, HNR , maximum phonation time for /a/ e /z/, s/z coefficient and GRBASI (Grade, Roughness, Breathiness, Asthenia, Strain, Magyar Tudósok krt. 2., Budapest 1117, Hungary (email:
tulics,vicsi@tmit.bme.hu., url: http://www.tmit.bme.hu)
Automatic classification possibilities of the voices of children with dysphonia
Miklós Gábriel Tulics and Klára Vicsi
D
Instability). On jitter and maximum phonation time for /s/ there were no statistically significant differences.
The study of Gopi Kishore Pebbili and his colleagues [12]
aimed to document the Dysphonia Severity Index (DSI) scores of 42 Indian children aged 8–12 years. DSI values were found to be significantly higher (p=0.027) in girls than in boys. DSI attempts to measure the severity of dysphonia based on the sustained production of a vowel, using a weighted combination of maximum phonation time, highest frequency, lowest intensity, and jitter (%) of an individual.
In [13] correlation between perceptual and acoustic data was examined to identify measures that are useful in determining the severity of voice deviation in children. Recordings from 71 children (aged 3–9 years) were used, containing the sustained sound /ε/ and the counting of numbers from 1 to 10. Results showed that F0 measures correlate with strain to phonate;
shimmer and GNE parameters correlate with general degree of voice deviation.
In our earlier research [14] continuous speech was examined, where we investigated the relationship between the voices of healthy children and those with functional dysphonia (FD). The statistical analyses drew the conclusion that variations of jitter and shimmer values with HNR (Harmonics-to-Noise Ratio) and the first component (c1) of the mel-frequency cepstral coefficients (referred to as ‘MFCC01’) are good indicators to separate healthy voices from voices with FD in the case of children. Samples from healthy children and adult voices were also compared giving a clear conclusion that differences exist in the examined acoustical parameters even between the two groups. It is necessary to carry out the investigations separately on children's voices as well; we cannot use adult voices to draw any conclusions regarding children's voices.
The goal of this research is to identify further acoustic parameters that are able to distinguish healthy voices of children from ones with dysphonia. For this reason statistical analyses was prepared, followed by a detailed classification experiment. Thus, setting a basis of a future mobile health application for the early recognition of dysphonia in the case of children.
Section 2 briefly describes the speech material used in the
experiments, followed by the description of the measured acoustic parameters, the statistical evaluation, parameter reduction and model building. Our results are shown in Section 3, followed by the discussion and the future direction in Section 4.
II. MATERIALSANDMETHODS
A diagnostic support system for the early recognition of dysphonia in the voices of children would follow the logic described in Fig 1. The A/D converter digitizes the analogue speech signal of the child, after which the signal is normalized.
In continuous speech, the measuring locations must be determined. Since in this work the acoustic parameters are measured on phonemes, phoneme level segmentation is required. Acoustic parameters (described in paragraph B) are extracted from the selected phonemes and arranged into a feature vector. The feature vector is given to a classifier to perform binary classification (healthy or unhealthy). Prior knowledge is gained by the processing of a carefully built speech database (described in paragraph A) and an optimal classification model using the acoustic parameters with great distinguishing power (classifier model). The system produces an output; this decision is shown on the user interface of the application. This study focuses on the automatic classification of voices of children with dysphonia.
A. Dysphonic and Healthy Child Speech Database
Sound samples from children were collected at several kindergartens. All the recordings were made with parental consent, mostly in the presence of the children's parents. The children recited a poem entitled “The Squirrel”, written by a logopedic specialist. This poem was chosen for therapeutic reasons, speech therapists using the poem during treatment, and because children in the 5-10 year old age group are very fond of the poem and it is easy for them to learn. The most frequent vowel in the poem is the vowel [o], with 16 pieces followed by 14 pieces of the vowel [O] and 9 pieces of vowel [E].
The recordings were made using a near field microphone (Monacor ECM-100), Creative Soundblaster Audigy 2 NX outer USB sound card, with 44.100 Hz sampling rate and 16-bit Fig. 1. Proposed framework for the recognition of dysphonic voiced children
linear coding. The duration of the recordings is about 20 seconds each.
All recordings were annotated and segmented on phoneme level, using the SAMPA phonetic alphabet [15]. In the rest of this article, vowels and other sounds will be referred with SAMPA characters in brackets. The segmentation was made with the help of an automatic phoneme segmentator, which was developed in our laboratory, followed by manual corrections. A total of 59 recordings were used in this work: 25 voices from children with dysphonia (mean age: 6.52(±1.94)) (3 children had vocal nodes, the rest had functional dysphonia) and 34 recordings from healthy children (mean age: 5.35(±0.54)).
Table I summarizes the recordings from the database used in the experiments.
B. Acoustic parameters
In our earlier study [14], statistical analyses draw the conclusion that acoustic parameters like jitter, shimmer, HNR and the first component (c1) of the mel-frequency cepstral coefficients are good indicators to separate healthy and dysphonic voices in case of children. These acoustic parameters showed significant difference on vowels [E], [o], [O], [A:].
Since the most frequent vowel in the poem is the [o], it is sufficient to extract these acoustic parameters on it.
In this work, we are attempting to expand the set of used acoustic parameters that could be helpful in the automatic classification of children with healthy voices from those with dysphonic ones.
In our earlier work [16] we demonstrated Soft Phonation Index (SPI) and Empirical mode decomposition (EMD) based frequency band ratios (IMFentropy) acoustic parameters measured on different phonetic classes (for example nasals, vowels, fricatives etc.) correlate with the severity of dysphonia in adult speech. Further parameters also needs to be investigated in continuous children speech.
The following acoustic parameters were used in this study:
Fundamental frequency (F0) means, standard deviations and ranges were calculated on vowels [E] and [o]. The fundamental frequency calculation was done by an autocorrelation method described in [17].
Formant frequency (F1, F2, F3) means, standard deviations and ranges were calculated on vowels [E] and [o].
Formant frequency bandwidth (F1BW, F2BW, F3BW) means, standard deviations and ranges were calculated on vowels [E] and [o]. Formant frequency tracking was realized by applying Gaussian window for a 150 ms long signal at a 10 ms rate. For each frame LPC coefficients were measured. The algorithm can be found in [16]. In case of fundamental frequency and formant frequencies we wanted to examine if there is a difference between the vowel [E] and [o]. Vowel [E]
was used by us in adult speech.
Jitter(ddp), shimmer(ddp), HNR (Harmonics-to-Noise Ratio) means, standard deviations and ranges were calculated on vowel [o]. Jitter is the average absolute difference between consecutive time periods (T) in speech, divided by the average time period. Calculation of jitter goes as follows:
𝑗𝑗𝑗𝑗𝑗𝑗𝑗𝑗𝑗𝑗𝑗𝑗(𝑑𝑑𝑑𝑑𝑑𝑑) = ∑𝑁𝑁−1𝑖𝑖=2|2∗𝑇𝑇∑𝑖𝑖−𝑇𝑇𝑖𝑖−1𝑇𝑇 −𝑇𝑇𝑖𝑖+1|
𝑁𝑁−1 𝑖𝑖
𝑖𝑖=2 ∗ 100 [%] (1)
where N is the number of periods, and T is the length of the periods. Shimmer is the average absolute difference between consecutive differences between the amplitudes of consecutive periods. Its calculation goes in a similar way:
𝑠𝑠ℎ𝑗𝑗𝑖𝑖𝑖𝑖𝑗𝑗𝑗𝑗(𝑑𝑑𝑑𝑑𝑑𝑑) = ∑𝑁𝑁−1𝑖𝑖=2 |2∗𝐴𝐴∑𝑁𝑁−1𝑖𝑖−𝐴𝐴𝐴𝐴𝑖𝑖−1𝑖𝑖−𝐴𝐴𝑖𝑖+1|
𝑖𝑖=2 ∗ 100 [%] (2)
HNR represents the degree of acoustic periodicity. It is calculated wit the following formula:
𝐻𝐻𝐻𝐻𝐻𝐻 = 10 ∗ 𝑙𝑙𝑙𝑙𝑙𝑙𝐸𝐸𝐸𝐸𝐻𝐻𝑁𝑁[𝑑𝑑𝑑𝑑] (3)
where 𝐸𝐸𝐻𝐻 is the energy of the harmonic component, while 𝐸𝐸𝑁𝑁is the energy of the noise component.
12 MFCC (mel-frequency cepstral coefficients) means, standard deviations and ranges were calculated on vowel [o].
MFCCs are widely used in automatic speech and speaker recognition, where frequency bands are equally spaced on the mel scale, that approximates the human auditory system's response. To calculate the MFCCs on needs to do the following steps: first we need to frame the signal into short frames, for each frame we need to calculate the periodogram estimate of the power spectrum. Then apply the mel filterbank to the power spectra, sum the energy in each filter and take the logarithm of all filterbank energies. MFCCs are the output of a Discrete Cosine Transform (DCT) on spectral values 𝑃𝑃𝑗𝑗. DCT is given by the following equation:
𝑐𝑐𝑘𝑘−1= ∑𝑁𝑁 𝑃𝑃𝑗𝑗 𝑐𝑐𝑙𝑙𝑠𝑠(𝜋𝜋(𝑘𝑘−1)𝑁𝑁 (𝑗𝑗 − 0,5))
𝑗𝑗=1 (4)
where N represents the number of spectral values and 𝑃𝑃𝑗𝑗 the power in dB of the jth spectral value (k runs from 1 to N).
SPI (Soft Phonation Index) and 𝐈𝐈𝐈𝐈𝐈𝐈𝐞𝐞𝐞𝐞𝐞𝐞𝐞𝐞𝐞𝐞𝐞𝐞𝐞𝐞 means, standard deviations and ranges were calculated on vowel [o], nasals ([m], [n] and [J]), low vowels, high vowels, voiced spirants ([v], [z]
and [Z]), voiced plosives and affricates ([b], [d], [g], [dz], [dZ]
and [d’]). Moreover, SPI was calculated on the whole sample as well. SPI is the average ratio of energy of the speech signal in the low frequency band (70-1600 Hz) to the high frequency band (1600-4500 Hz). If the ratio is large that means the energy is concentrated in the low frequencies, indicating a softer voice [17].
IMFentropy is an empirical mode decomposition (EMD)
based frequency band ratio acoustic parameter. EMD decomposes a multicomponent signal into elementary signal components called intrinsic mode functions (IMFs) [20]. Each of these IMFs contributes both in amplitude and frequency towards generating the speech signal. The IMFs are arranged in a matrix in sorted order according to frequency. The first few IMFs are the high frequency components of the signal, the latter IMFs represent the lower frequency components. We calculate