Introduction
Credit is a necessary and important factor in the agri- cultural production process in many poor countries. Credit access can considerably increase the financial ability of farm households for agricultural inputs and productive invest- ments in both the short-run and long run (Lin et al., 2019).
Indeed, credit has been considered as one efficient way to improve agricultural productivity and reduce poverty. In developing countries, particularly in rural areas where the credit markets are imperfect, farmers cannot easily access credit sources. With constrained credit, rural households have difficulties in making agricultural inputs investment and consequently must limit their production and smoothing consumption (Oseni and Winters, 2009). Some empirical lit- erature has found that in rural areas of developing countries, credit constraints have significant adverse effects on agri- cultural productivity (Guirkinger and Boucher, 2008; Dong et al., 2012) and farm investment (Carter and Olinto, 2003).
One way farmers used to overcome the constraints and imperfections of the credit market is by diversifying their livelihoods into non-farm activities (Oseni and Winters, 2009). The literature indicated that the income source obtained from non-farm activities could help farm house- holds for improving their household income (Ferreira and Lanjouw, 2001; Nnadi et al., 2020; Kumar et al., 2020), smoothing consumption (Seng, 2015; Mishra et al., 2015;
Abdurezak and Ahmed, 2020), and reducing poverty (Hag- gblade et al., 2010; Hoang et al., 2014; Bui and Hoang, 2020). Sometimes, farm income is not sufficient to supply a sufficient livelihood (Minot et al., 2006), which can be a push factor driving rural households to seek opportunities for employment outside farm activities. In farming activity, farm households always face many risks or limited risk- bearing capacity, inducing household members to engage in non-farm activities to reduce risk and reduce consumption uncertainties (Reardon, 1997; Barrett et al., 2001; Oseni
and Winters, 2009). In addition, the non-farm income can be used in agricultural production when farmers do not have enough financial capacity to pay for farm inputs. Thus, par- ticipation in the non-farm market could help farm household to relax the liquidity constraints they face when credit is not available (Pfeiffer et al., 2009).
Both the loss of family labour in the shift from farm activ- ity to non-farm activities and access to non-farm income can influence agricultural production in direct and indirect ways.
Besides the labour-lost effect, the earnings from non-farm employment can provide cash for farmers to make invest- ments in agricultural production to enhance productivity.
These investments could be for the short term such as the purchase of fertilisers, feed, herbicide, pesticide, and other inputs, or for the long term such as investments in machinery or irrigation or the adoption of new technologies (high yield- ing seed or improved seed) (Pfeiffer et al., 2009).
There are numerous studies showing the relationship between non-farm activities and agricultural inputs invest- ment/expenses in several developing countries. The findings reveal this effect can be positive, negative, or nil (equal to zero), depending on the context. The positive relationship between non-farm participation and the purchasing of pro- ductive agricultural assets has been explored in many coun- tries, including Bulgaria, Nigeria, Mexico, Philippines, and Ghana (Hertz, 2009; Oseni and Winters, 2009; Pfeiffer et al., 2009; Takahashi and Otsuka, 2009; Anríquez and Daidone, 2010). These studies all concluded that the income from non- farm activities could loosen the credit constraints for farm households who were now able to pay more for inputs in agricultural production. However, in Albania, Kenya and China, non-farm employment had been found to have a negative impact or no impact (Albania: Kilic et al., 2009;
Kenya: Mathenge et al., 2015; China: Huang et al., 2009) on agricultural input expenditures. Ahituv and Kimhi (2002) analysed farm households’ off-farm labour and farm capital investment decisions and found a strong negative associa- Hang Thi Thuy NGUYEN*, Xuan Hung PHAM* and Takumi KONDO**
The impact of non-farm activities on agricultural investment in Vietnam: the difference made by credit constraints levels
This paper examines the impacts of non-farm activities on farm inputs investment decisions across six regions in Vietnam using the Vietnam Household Living Standards Survey. Results suggest that although income from non-farm activities con- tributes to relaxing credit constraints among farmers, such alleviation does not necessarily allow farmers to increase their on- farm investments. We found that in the developed regions where farmers participate and earn more from non-farm activities, despite there being a low level of credit constraints, their investment in agriculture is still limited due to the labour constraints of the farm household. In contrast, in the less developed regions, where farmers have less access to non-farm income sources, they tend to invest their non-farm income in on-farm activities. The article contributes to the literature by showing that differ- ences in credit constraints levels lead to variations in farm households’ decisions on whether or not to direct non-farm income towards investment in agricultural production.
Keywords: non-farm activities, agricultural inputs investment, regions, credit/liquidity constraints, Vietnam.
JEL classification: Q14
* University of Economics - Hue University. 99 Ho Dac Di Street, Hue City, Vietnam. Corresponding author: nguyenthithuyhang_dhkt@hueuni.edu.vn
** Research Faculty of Agriculture, Hokkaido University. Kita 9 Nishi 9, Kita-ku, Sapporo, Hokkaido, Japan.
Received: 26 July 2021, Revised: 30 September 2021, Accepted: 5 October 2021.
tion between off-farm work and farm capital accumulation in Israel. In the case of Vietnam, Stampini and Davis (2009) found a positive relationship between non-agricultural labour activities and the use of inputs in farming production.
Based on the above studies, we wonder why there exists a difference in the empirical results of the impact of non-farm income on the farmers’ investment decisions when the mar- kets are imperfect in all studied countries? What is the factor affecting these different results? In the cases of Albania and China – where negative, or no effects were found – Davis et al. (2009) supposed that non-farm employment is consid- ered clearly an alternative to the intensification of farming and makes farmers access to credit easier. In all cases, the articles posited that this was driven mainly by farm credit constraints (Davis et al., 2009). Thus, our research question is how will the effect of non-farm activities on farm inputs investment decisions look like if the farmer’s capacity to access credit sources or the level of credit constraints farm households are subject to is different?
In order to answer this research question, our paper attempts to examine the effect of non-farm activities on agri- cultural inputs investment among the regions in Vietnam. We suppose that each region has dissimilarities in agricultural production activities due to geographical characteristics. In addition, the opportunities to engage non-farm employment are considered dissimilarities among regions where the cen- tre and developed regions have higher participation chances than the far and less developed regions. The territory of Viet- nam is divided into six main regions, namely Red River Delta, Midland and Northern Mountainous, Northern and Coastal Central, Central Highland, South Eastern Area and Mekong River Delta. The income per capita also varies from region to region, out of which Red River Delta and South Eastern Area belong to high-income regions or developed regions, while the remainder are lower-income regions or less developed regions. The dissimilarity in opportunities to engage in the non-farm sector, or to put it another way, the dissimilarity in the capacity to access credit sources could bring differ- ent impact results in these two groups of regions. In addi- tion, the influence of participation in non-farm employment on the decision to purchase or invest inputs into agricultural production depends on the context of the credit constraint of farm households. The level of restriction credit or the level of access to credit sources could be different among regions, especially between developed and less developed regions.
Therefore, to examine the effect of non-farm activities on agricultural inputs investment/expenditure in the cases of the dissimilarity of capacity to access non-farm income sources, we focus on the analysis of this effect among regions in Viet- nam. The article contributes to the literature by providing evidence on the difference in farm investment behaviour influenced by credit constraints level differences.
The remainder of this paper is organised as follows. Sec- tion 2 describes the background of rural non-farm activities in the different regions of Vietnam. Section 3 presents the material and method of the paper, including the data sources, the research methodology and descriptive statistics of vari- ables used in this paper. In section 4 and 5, we present the estimation results and conclusion.
Conceptual framework
The relationship between farm and non-farm sectors in rural economy is shown in the household model of Singh et al. (1986) and Pfeiffer et al. (2009). If all markets are perfect and farm households are not constrained, a separa- ble model is applicable because the production decisions that households make are independent of consumption and labour allocation decisions. In the presence of market imperfection, this household model is called non-separable because the household’s decisions regarding production, consumption, and labour allocation are interacting with each other. The production decisions of households such as use of inputs, choice of activities, and desired production levels are affected by their characteristics as consumers or their socio- economic status (Oseni and Winters, 2009).
If the credit market is complete, farm households can borrow enough to meet their production needs, which means that they are not constrained. In this case, the production decisions of households can be made separately from their consumption decisions. However, in the presence of credit market imperfection, farm households cannot borrow to optimise production or alternatively, they are constrained by limited credit, thus the farm households make their produc- tion and consumption decisions jointly (Oseni and Winters, 2009). According to Pfeiffer et al. (2009), if credit is not available, a farm household’s expenditures on inputs for agri- cultural production (including hired labour) cannot exceed its own exogenous income and savings plus income received from off-farm work. The liquidity constraint becomes linked to consumption decisions and the household’s leisure time is linked to off-farm activities (Oseni and Winters, 2009).
Thus, when facing credit constraints, households make deci- sions that can lessen their constraint, and their decisions in relation to agricultural production or purchasing inputs are related to the household’s off-farm income.
To overcome the liquidity constraints, one possible way is to engage in non-farm activities to earn an alternative income. Singh et al. (1986) supposed that an increase in the off-farm income can influence the production and con- sumption of the household facing credit constraints. With the relaxation for credit-constrained, an important concern is how participation in non-farm activities affects farm house- holds’ investment in inputs of agricultural production. Oseni and Winters (2009) reasoned that participating in non-farm activities could increase the overall household’s income, thereby making the decision easier to purchase agricultural inputs. According to Pfeiffer et al. (2009), if a household is constrained by limited liquidity or credit, the income from working outside of farming can be used to purchase inputs for agricultural production. The paper of Hertz (2009) also indicated that this is consistent with the presence of farm credit constraints that induce farmers to fund farm expendi- tures with non-farm income.
On the other hand, when family members engage in non- farm activities, this induces a shift of family labour from on- farm activity to non-farm activities, thus potentially reduc- ing family labour in agricultural production. The increase in non-farm income creates an incentive to substitute some of
Background of rural non-farm activities by regions in Vietnam
With the introduction of the reform policy or Doi Moi policy in 1986, the structural changes occurred not only within the agriculture sector but also in the entire rural econ- omy of Vietnam. The rural non-farm sector was expanded and developed gradually following the opening of the econ- omy. As a result, household businesses have become the most important source of job creation in the rural economy.
Based on the calculation from data of Vietnam Household Living Standard Survey of 2012, Table 1 displays the farm income, non-farm income and non-farm participation rate of rural households by region. The share of non-farm income was relatively high (65.48%), while the non-farm participa- tion rate of rural households was quite high (73.96%).
Among the regions, the earnings from non-farm activi- ties are largest in the Red River Delta and South Eastern Area, at 67.06 million Vietnam Dongs (VND) and 76.40 million VND, respectively. Those two regions – where the two biggest cities (Hanoi and Ho Chi Minh) are located – are the most developed regions, and each has a high population.
The opportunities to seek income from other activities out- side farm production are high in these regions as compared to other regions far from the centre. The Central Highland, Midland and Northern Mountainous regions are located far from the major developed regions where the earnings from non-farm employment are quite small (only 28.29 million VND and 31.68 million VND, respectively). If we examine the share of non-farm income in total household income, the percentages for the Red River Delta region, Northern and Coastal Central region and South Eastern Area are the highest among the regions, at 79.67%, 69.75% and 67.21%, respec- tively. The main production activity in the Central Highland region is agricultural production; thus, farm income is the main income source of farm households here (61.15%). In the Midland and Northern Mountainous region and Mekong River Delta, non-farm income also plays an important role with its share extending beyond half of the total farm house- hold’s income. The participation rate in non-farm activities of the head or/and spouse household was found to be a little the cheap inputs for family labour (Pfeiffer et al., 2009). The
analysis in the conceptual framework of Pfeiffer et al. (2009) concluded that a credit-constrained household could send family members to participate in non-farm activities, and in turn, these income sources could help farmers not only pur- chase agricultural inputs but also hire labour to compensate for the family labour lost.
The decision to purchase or invest farm inputs depends on the context of household and the asset position of the household including natural capital, human capital, social capital, and financial capital (Ellis, 2000; Oseni and Win- ters, 2009). Mathenge et al. (2014) developed a theoretical model for inputs purchased by farms, which is dependent on factors such as household characteristics or human capital, non-farm income, as well as some factors related to the agro- ecological conditions for crop production and market condi- tions. Thus, to examine the relationship between agricultural inputs, investment, and non-farm income, it is necessary to control these factors. According to Evans and Ngau (1991) and Oseni and Winters (2009), land or farm size represents natural capital, and it is hypothesised that farm households with a larger farm size tend to use more agricultural inputs for production. The human capital or household character- istics are the factors which affect the decision in purchased inputs including education level, age, household size and family labour (Oseni and Winters, 2009; Mathenge et al., 2014). It is hypothesised that when a household possesses a higher level of schooling, this leads to increased expenditure on farm inputs. Social capital refers to one’s membership of social networks that offer a household the opportunity to gain important benefits. Ellis (2000) has further indicated that aspects of one’s social identity such as gender and eth- nicity should be regarded as social capital. Financial capital refers the financial capacity or credit access ability of farm households. In this paper, non-farm income is considered to represent financial capital and it is the factor that we would like to focus on. Moreover, the non-farm income variable is an endogenous variable which correlates with the other inde- pendent variables in the model. Several studies have applied instrumental variables to address the endogeneity problem of non-farm income variables (Pfeiffer et al., 2009; Oseni and Winters, 2009; Kilic et al., 2009; Hertz, 2009).
Table 1: Farm income, non-farm income and non-farm participation rate of rural households in Vietnam by regions.
RRD MNM NCC CHL SEA MRD Whole
country
Farm income (million VND) 17.11 25.37 19.99 44.53 37.27 31.69 26.11
Non-farm income (million VND) 67.06 31.68 46.10 28.29 76.40 48.20 49.52
Total income (million VND) 84.17 57.05 66.09 72.82 113.67 79.89 75.63
Farm income share (%) 20.33 44.47 30.25 61.15 32.79 39.67 34.52
Non-farm income share (%) 79.67 55.53 69.75 38.85 67.21 60.33 65.48
Non-farm participation rate of head or/
and spouse (%) 80.51 63.77 71.57 74.17 86.07 74.47 73.96
Notes: RRD: Red River Delta, MNM: Midland and Northern Mountainous, NCC: Northern and Coastal Central, CHL: Central Highland, SEA: South Eastern Area, MRD:
Mekong River Delta.
VND is Vietnam’s currency (Vietnamese Dong).
Source: Vietnam Household Living Standards Survey (VHLSS), 2012
different between regions. Naturally, the two most developed regions (Red River Delta and South Eastern Area) have a high non-farm participation rate (80.51% and 86.07%), while this rate remains lower in other regions.
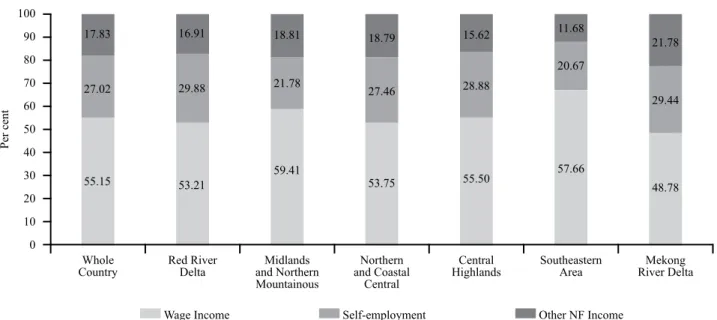
There are many ways to define non-farm income. Specifi- cally, Reardon (1997) defined non-farm income as consisting of different types of activities such as non-farm wage, self- employment, and migration remittances. Oseni et al. (2009) indicated that non-farm income is the total income of three income sources: wage employment, self-employment, and transfers. On the other hand, Pfeiffer et al. (2009) identified off-farm income including non-agricultural wage work and remittances. Based on previous definitions and the Viet- nam Household Living Standard Survey dataset, we define non-farm income as income earned from non-farm wages, self-employment income, and other income. In Vietnam rural households, earnings from wages is a major compo- nent of non-farm activities (Figure 1). In fact, it is the larg- est component of non-farm income in all households across the six regions. This is especially so in the South Eastern Area, where this non-farm wage income source accounts for 67.65% of total non-farm income. For other regions, this income source constitutes over half of the total non-farm income of households. In addition, it can be seen that earn- ings from self-employment represent an important source of non-farm income for Vietnamese rural households.
Data and Methodology
Data sources
Our empirical analysis is based on a data set from the Vietnam Household Living Standards Survey (VHLSS).
This survey of the household living standard was conducted by the General Statistics Office of Vietnam and collabo-
rated with the World Bank within the framework of Living Standard Measurement Surveys (LSMS). This survey pro- vides detailed data on socio-demographic characteristics, employment, production, income sources, assets, and other information from a representative sample of urban and rural households in Vietnam. However, this article only focuses on the rural farm households that participate in all agricultural, forestry and aquaculture activities. We aggregate the three primary sectors (agriculture, forestry, and aquaculture) and not only on a specific sector to investigate the relationship between non-farm activities and production inputs cost. The commune survey of the VHLSS is also used in this paper for instrumental variables (IVs) to deal with the endogenous variable. This survey investigated the socio-economic char- acteristics of the communes to facilitate the choice of IVs.
However, some communes have missing values or were not investigated, a situation which has led us to reduce the num- ber of observations. Finally, the number of households in our analysis is 4,823.
Methodology
The purpose of our empirical analysis is to investigate the difference in the impact of non-farm activities on agri- cultural input investment in the short run among regions.
Here we focus on all three primary activities – agriculture, forestry, and aquaculture – of farm households. Thus, we aggregate the cost of all inputs of farm production for all agriculture, forestry, and aquaculture activities.
The value of input expenses/investment can sometimes be equal to zero because some farm households use self-sup- plied inputs, do not use some of inputs in production such as herbicide, pesticide, or/and do not hire machines and labour.
Hence, some observations take a value equal to zero with a positive probability, but the dependent variable is a con- tinuous random variable with strictly positive values (Wool- dridge, 2013). To deal with zeros in dependent variables, we
Other NF Income
Wage Income Self-employment
100
0 10 20 30 40 50 60 70 80
Per cent
90
Whole
Country Red River
Delta Midlands
and Northern Mountainous
Northern and Coastal
Central
Central
Highlands Southeastern
Area Mekong
River Delta 17.83
27.02
55.15
16.91
29.88
53.21
18.81 21.78
59.41
18.79
27.46
53.75
15.62 28.88
55.50 57.66
48.78 29.44 21.78 20.67
11.68
Figure 1: Source of non-farm income by region.
Source: Own composition based on VHLSS (2012)
applied the Tobit model for a corner solution response. The structural equation of the Tobit model is presented as fol- lows:
. ,
, ,
exp
y X
y if y y if y
Input NF Z
NF Z I
0 0
0
*
*
* *
i i i
i
i i i
i i i i
0 1 2
0 1 2
2
#
b f
b b b f
m m m n
= +
= + + +
= + + +
(
, (1) where, ɛi ~ N(0, σ2), and y* is a latent variable that is observed for values greater than zero. The observed yi is defined as:
. ,
, ,
exp
y X
y if y y if y
Input NF Z
NF Z I
0 0
0
*
*
* *
i i i
i
i i i
i i i i
0 1 2
0 1 2
2
#
b f
b b b f
m m m n
= +
= + + +
= + + +
(
Based on the conceptual framework, the decision to pur- chase/invest agricultural inputs depends on a set of other factors such as human capital, natural capital, social capital, financial capital, etc. (Ellis, 2000; Oseni and Winters, 2009;
Mathenge et al., 2014). According to Kilic et al. (2009), the impact of non-farm income on agricultural expenditure/input costs can be estimated by comparing non-farm income-recip- ient households with nonrecipient ones through the inclusion of a set of observable characteristics at the household and community level. The empirical previous studies applied the regression model in both ordinary least squares (OLS) and the instrumental variables (IV) methods to analyse the relationship between non-farm activities and agricultural input cost with the using the explanatory variables including household and community characteristics (Oseni and Win- ters, 2009; Kilic et al., 2009; Pfeiffer et al., 2009; Stampini and Davis, 2009). Thus, our paper also applies such a model to investigate the relationship between non-farm activities and the cost of agricultural inputs. The regression equation is calculated as follows:.
,
, ,
exp
y X
y if y y if y
Input NF Z
NF Z I
0 0
0
*
*
* *
i i i
i
i i i
i i i i
0 1 2
0 1 2
2
#
b f
b b b f
m m m n
= +
= + + +
= + + +
(
(2) where Input_expi represents the agricultural input cost of the ith farm household. Specifically, the dependent variable used in this paper is the total inputs cost in all farm activi- ties including agriculture (cultivation and livestock), forestry and aquaculture. In addition, our paper examined this rela- tionship in terms of individual categories inputs, to analyse more deeply the different impacts, region by region. Con- sequently, other agricultural input dependent variables were also used, including seed and breed cost, fertiliser and feed cost, herbicide-pesticide-medicine cost, hired machinery cost and hired labour costs.
NFi is the non-farm income variable. The coefficient β1 indicates the marginal effect of the non-farm income variable. If negative, it would suppose that participation in non-farm activities reduces the expenditure on agricultural inputs. If positive, it indicates that the non-farm income could help farmers to overcome credit constraints by facili- tating spending in agricultural production. Zi is a vector of variables that comprises the socio-economic characteristics of the ith farm household. The socio-economic characteristics variables include the household head’s gender, age, educa- tion, the household size, ethnicity, the number of male and female workers in the household, and size of farmland. The dummy variable of household head’s gender takes a value
equal to one if the head of the household is male. The educa- tion level of the household head denoted by the number of completed years of schooling. The household size variable indicates the total number of members of the household.
The ethnicity variable is a dummy variable that equals one if the household head is of Kinh ethnicity, the dominant racial identity of Vietnamese people, and zero for other minority ethnicities. ɛi is the error term.
The participation in non-farm activities is not exog- enously determined in our model specification. The possi- ble endogeneity of non-farm participation could influence agricultural input expenditure, thus leading to inconsistent estimation results. The endogeneity problem implies that non-farm variables (NFi) correlated with the error term (ɛi).
To treat this problem, we apply the instrumental variables (IV) approach. The IV framework tries to identify variables that are uncorrelated with ɛi but correlated with non-farm income variables and have no direct effect on agricultural input expenses. In other words, each instrument needs to satisfy two conditions, namely, instrumental relevance and instrumental exogeneity. This enables consistent estimation.
A single endogenous regression equation estimates the rela- tion between the instruments and non-farm income, as fol- lows:
. ,
, ,
exp
y X
y if y y if y
Input NF Z
NF Z I
0 0
0
*
*
* *
i i i
i
i i i
i i i i
0 1 2
0 1 2
2
#
b f
b b b f
m m m n
= +
= + + +
= + + +
(
(3) where NFi is a latent variable. In this empirical analysis, we treat the non-farm explanatory variable as non-farm income because the Tobit model is applied in the initial model.
This is a nonlinear regression model; thus the explanatory endogenous variable must be a continuous variable. The non-farm income is the total earnings from non-farm jobs of all members of a household in million VND. Therefore, we use linear regression in the first stage model. The F-test of the joint significance of instrumental variables is applied in the first stage regression that indicates the instruments are weak or not. The F-test result must be greater than 10, so that we can conclude the instrument are strong instrumental variables and correlated with the non-farm variables. Zi has been previously defined, Ii is a vector of instruments, and 𝜇i is the error term. Finally, the IV-Tobit is applied in our paper to determine the corner solution for the dependent variables and treat the endogenous regressor.
We identified three instruments that must satisfy the two conditions mentioned above. The first instrument, factory/
manufacture location, is a dummy variable that takes a value equal to one if communes have a factory or manufactory or traditional occupation village located nearby, and zero otherwise. The proximity of a factory or traditional occupa- tion village to the commune facilitates the participation of households in non-farm employment. The second instru- ment, Time_Town, is the time distance from the commune to the nearest town by private or public transportation. The last instrument, Time_City, is the time distance from the com- mune to the nearest city or provincial capital. These vari- ables could explain the potential household’s opportunities for participation in non-farm employment, which depends on whether they live near a town or city and the convenience of the travel time. The relevant data were obtained from the
commune survey of dataset, conducted on 2,218 communes.
However, several surveys reported incomplete answers, which led to a significant reduction in the sample size of both communes and households.
Finally, the above discussion provides the main model analysed in the paper. Additionally, our purpose is to explore the difference in the role of non-farm activities on agricul- tural production between regions, thus, we estimate this rela- tionship by the IV Tobit model in each region. To conduct this paper, we use STATA software to analyse the dataset and estimate the models.
Descriptive statistics
Table 2 displays the descriptive statistics of variables used of farm households in the country as a whole and by region. It provides a general overview of household socio- economic characteristics, the inputs cost in agricultural pro- duction, land, and instrumental variables in this analysis. To
examine the impact of non-farm activities on farm invest- ment, in particular the input costs of agricultural production, we use some of specific input cost variables including seed and breed, fertiliser and feed, pesticide-herbicide-medicine cost, hired machinery and hired labour.
The average total input cost is calculated from the total cost of seed and breed, fertiliser and feed, pesticide-herbi- cide-medicine cost, hired machinery, hired labour, energy, small tools, and other costs. This input cost of farm house- holds in Vietnam is 26.81 million VND. The South Eastern Area and Mekong River Delta are two regions that have the highest expenditure for agricultural inputs, at 43.72 and 42.49 million VND, respectively. The cost of fertiliser and feed is the most important input in production process of farm household which constitutes around a half of the total cost of inputs. The average farmland held by households is about 0.86 hectares. However, in the Red River Delta, households have on average only 0.27 hectares of land for agricultural production, the smallest acreage in comparison
Table 2: Descriptive statistics of variables used by region.
Variables RRD MNM NCC CHL SEA MRD Whole
country Dependent variables (agricultural inputs variables)
Total input cost (million VND) 23.08 17.75 20.69 37.79 43.72 42.49 26.81
Seed and Breed cost (million VND) 4.23 4.15 3.74 2.40 4.62 6.98 4.47
Fertiliser and Feed cost (million VND) 13.59 10.54 9.33 21.93 24.56 17.89 13.77
Herbicide_Pesticide_Medicine cost (million VND) 0.96 0.60 0.73 2.03 2.69 5.01 1.71
Hired Machinery cost (million VND) 1.39 0.44 1.28 1.47 1.39 4.22 1.65
Hired Labour cost (million VND) 1.21 0.54 2.21 5.79 7.10 4.02 2.42
Household socio-economic characteristics variables
Head’s gender (male = 1, female = 0) 0.82 0.88 0.83 0.83 0.81 0.78 0.83
Head’s age (year) 51.63 44.39 50.29 45.24 50.59 50.94 48.92
Head’s education (Completed years of schooling) 8.26 6.13 7.27 5.84 6.05 5.24 6.68
Household size (Number of household members) 3.64 4.33 3.96 4.38 3.96 4.15 4.04
Ethnicity (Kinh ethnicity = 1, other minor ethnicities = 0) 0.98 0.31 0.87 0.53 0.89 0.92 0.74 Male labour (Number of male workers of households) 1.12 1.28 1.18 1.26 1.36 1.28 1.22 Female labour (Number of female workers of households) 1.42 1.46 1.38 1.35 1.37 1.50 1.43
Land
Farmland (hectare) 0.27 1.16 0.74 1.45 1.50 0.89 0.86
Non-farm variable
Non-farm income (million VND) 58.9 29.84 40.28 21.41 49.73 40.62 40.94
Instrumental variables Factory/manufacture location
(The factory or manufactory or traditional occupation
village is located near the commune. Yes = 1, no = 0.) 0.81 0.41 0.66 0.49 0.84 0.78 0.65 Time_Town (The time distance from the commune
to the nearest town (minute)) 18.10 50.50 27.87 33.97 27.50 28.86 31.79
Time_City (The time distance from the commune
to the nearest city (minute)) 50.46 128.11 87.40 102.56 80.37 68.99 86.58
Number of observations 1,058 1,159 1,145 364 229 868 4,823
1) Source: VHLSS (2012).
2) VND is Vietnam’s currency (Vietnamese Dong).
3) RRD: Red River Delta, MNM: Midland and Northern Mountainous, NCC: Northern and Coastal Central, CHL: Central Highland, SEA: South Eastern Area, MRD: Mekong River Delta.
4) 1 million VND = 47.62 US$ in 2012 (calculated based on tradingeconomics.com).
to the remaining regions. Two regions have relatively large farmland per household, which are the Central Highland region and South Eastern Area, at 1.45 and 1.5 hectares, respectively.
The household socio-economic characteristics variables are included head of household’s gender, age and education, household size, ethnicity, and number of male and female workers. The head of farm household in most cases is male in Vietnam: this was true for 83% of the total sample. The average age of the head household is about 49 years. The education level of the head household is 6.68 years on aver- age - this education level is highest in the Red River Delta (8.26 years) and lowest in the Central Highland and Mekong River Delta regions (5.84 and 5.24 years, respectively). The statistics of ethnicity variable indicates the ratio of Kinh eth- nicity to rule the sample – 74% of household heads are of Kinh ethnicity. The farm households in the Red River Delta and Mekong River Delta regions are almost exclusively of Kinh ethnicity, at 98% and 92%, respectively. However, this ratio is low in the Midland regions and Northern Mountain- ous Area, at only 31%.
The instrumental variables are used in the analysis to address the endogeneity problem introduced by the non- farm income variable. The results of the statistics of those variables by region also imply the difference in the opportu- nities as well as the convenience for engaging in non-farm jobs across developed regions and less developed regions.
The factory/manufacture location variable indicates that a factory, manufacturing or traditional occupation village is located near the commune where household members can commute from daily. In the Red River Delta and South East- ern Area, the share of households that are located near the factory or place of manufacture are large (81% and 84%, respectively) compared to the total number of rural house- holds that are found in these regions. However, these fig- ures do not hold for the remaining regions - in Midland and Northern Mountainous and Central Highland, for instance, only 41% and 49% hold, respectively. The time distance from the commune to the nearest town and the nearest city are calculated by minute. From Table 2, we can see that the average time from the commune to the nearest town and the nearest city are the lowest in the Red River Delta region and South Eastern Area, while the travel time from communes to towns and cities of other areas is higher, especially in the Midland and Northern Mountainous and Central Highland regions.
Results and Discussion
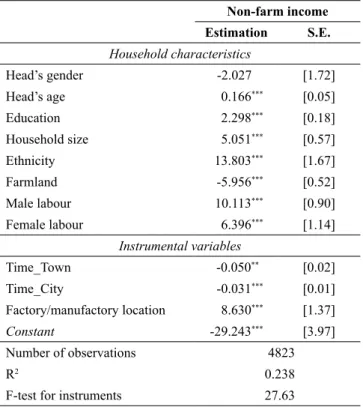
The first stage regression on participation in non-farm activities is presented in Table 3. The estimation shows that the gender of the head household appears to be unrelated to non-farm income, while the age of head household had a positive correlation with non-farm income. The result for education indicates a positive relationship between educa- tion and non-farm income. This result also implies that edu- cation plays a role in determining levels of participation in rural non-farm activities. The significant and positive coef- ficient of the ethnicity variable shows that the major ethnic-
ity (Kinh ethnicity) participated in non-farm activities more than the minorities. The results for male and female labour are similar, indicating that an increase in male or female labour induces greater non-farm earning. The farmland size is negative, which indicates that farm households with large amounts of land are less likely to participate in non-farm activities compared to those owning only small amounts as the family labour supply cannot meet the needs of a large amount of farmland.
The results of three instrumental variables (Time_Town, Time_City, and factory/manufactory location) are highly significant. As expected, the time distances from the com- mune to the nearest town and city have a negative impact on non-farm income. The location of a factory or place of manufacture near the commune is positively associated with non-farm income. The F-test demonstrates the relevance condition of all instruments. The result of this test is 27.63 (greater than 10) which indicates that these instruments are strong instrumental variables and satisfy the relevance con- dition.
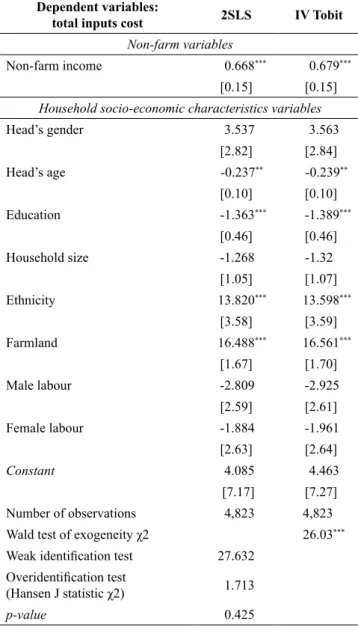
The estimation results of the influence of non-farm activities on total agricultural inputs cost of the whole coun- try are shown in Table 4. We apply both Two Stage Least Square (2SLS) and IV Tobit models for the whole sample, to compare the two models and test the validity of instruments.
For the IV Tobit model, the parameter presented conditional on the censoring of the data. The parameters of independent variables of both 2SLS and IV Tobit are equivalent or not very different. The result of non-farm income variable indi- cates a positive relationship between non-farm activities and agricultural inputs cost. This finding of the paper is consist- ent with studies of Pfeiffer et al. (2009), Oseni and Winters
Table 3: First stage regression results.
Non-farm income Estimation S.E.
Household characteristics
Head’s gender -2.027 [1.72]
Head’s age 0.166*** [0.05]
Education 2.298*** [0.18]
Household size 5.051*** [0.57]
Ethnicity 13.803*** [1.67]
Farmland -5.956*** [0.52]
Male labour 10.113*** [0.90]
Female labour 6.396*** [1.14]
Instrumental variables
Time_Town -0.050** [0.02]
Time_City -0.031*** [0.01]
Factory/manufactory location 8.630*** [1.37]
Constant -29.243*** [3.97]
Number of observations 4823
R2 0.238
F-test for instruments 27.63
Note: * P < 0.05, ** P < 0.01, and *** P < 0.001.
Values in parentheses indicate standard errors.
Source: Authors’ estimation
(2009) and Hertz (2009) who indicated the role played by non-farm income in loosening credit constraints in agricul- tural production. However, this result contradicts the studies of Kilic et al. (2009), Mathenge et al. (2015), and Huang et al. (2009), showing that non-farm activities have a nega- tive, or else no, effect on farm input expenditure.
The Wald test was applied on the Chi-squared of the instrumental variables performed on IV Tobit regressions.
The null hypothesis is the absence of endogeneity in the esti- mation. The result of the Wald test is significant at the 1%
level. This means that the null hypothesis is rejected, that is, non-farm income is an endogenous variable. Thus, our estimation based on IVs to treat the endogeneity problem is adequate.
The validity of instruments is performed in the 2SLS model. The value of weak identification test statistics is 27.63 (greater than 10). From this result, we consider the null hypothesis of weak identification is almost rejected and
Table 4: Effect of non-farm activities on agricultural input costs in Vietnam.
Dependent variables:
total inputs cost 2SLS IV Tobit Non-farm variables
Non-farm income 0.668*** 0.679***
[0.15] [0.15]
Household socio-economic characteristics variables
Head’s gender 3.537 3.563
[2.82] [2.84]
Head’s age -0.237** -0.239**
[0.10] [0.10]
Education -1.363*** -1.389***
[0.46] [0.46]
Household size -1.268 -1.32
[1.05] [1.07]
Ethnicity 13.820*** 13.598***
[3.58] [3.59]
Farmland 16.488*** 16.561***
[1.67] [1.70]
Male labour -2.809 -2.925
[2.59] [2.61]
Female labour -1.884 -1.961
[2.63] [2.64]
Constant 4.085 4.463
[7.17] [7.27]
Number of observations 4,823 4,823
Wald test of exogeneity χ2 26.03***
Weak identification test 27.632 Overidentification test
(Hansen J statistic χ2) 1.713
p-value 0.425
Note: * P < 0.05, ** P < 0.01, and *** P < 0.001.
Values in parentheses indicate the robust standard errors clustered at the commune level.
Instrumental variables: Factory/manufacture location, Time_Town, Time_City.
Source: Author’s estimation
the relevance condition of instrumental variables is satisfied.
The over-identification test Hansen J statistic is 1.713 with p-value 0.425. Thus, the joint null hypothesis that the instru- ments are valid is not rejected.
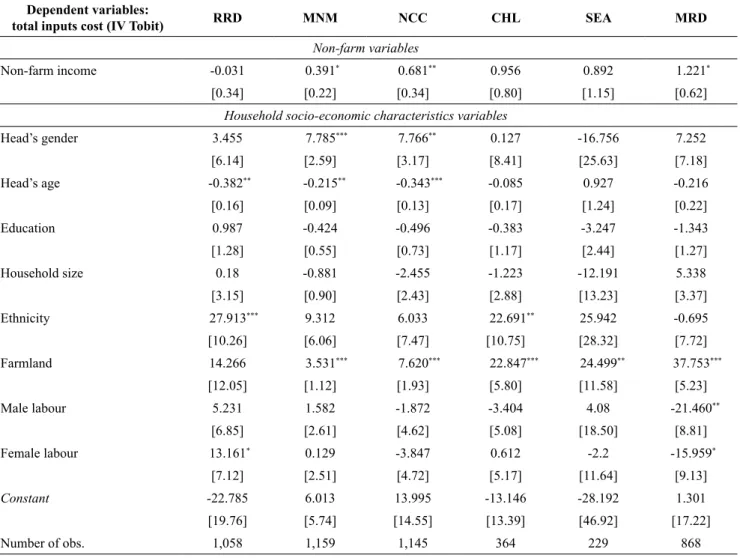
The opportunity to participate in non-farm activities differs across the six regions because of geographical dif- ferences. The investment of inputs into agricultural produc- tion shows significant differences across regions. Given the marked difference across the country, it leads to questioning whether the relationship between farm and non-farm sectors is different across the six regions. Table 5 reports the results for the IV Tobit for each of the regions.
Results indicate that the effect of non-farm income on total agricultural inputs cost in the Midland and Northern Mountainous (MNM), Northern and Coastal Central (NCC) and Mekong River Delta (MRD) regions are significantly positive. These regions are comparatively less developed areas in the country; and the participation rates of head or spouse household in the non-farm works are lowest at 63.77% for MNM, 71.57% for NCC and 74.47% for MRD (Table 1) in comparison to the other regions. For the less developed regions in Vietnam, when the opportunity of par- ticipation in the non-farm sector is low, the farm households still depend on agricultural income, and they also face the credit constraints in production. Therefore, the non-farm income can help farm households to overcome the lack of credit and improve their household agricultural income through investment.
The results of the statistical analysis of dependent vari- ables for the Red River Delta (RRD) and South Eastern Area (SEA) regions are not significant. This indicates that non- farm activities have no effect on the farm activities in both regions. They are the most developed regions in Vietnam with the two biggest cities, Hanoi City and Ho Chi Minh City. Thus, there exists a high level of opportunity for the farm labours to access the employment outside the farm.
Although the average of non-farm income and non-farm participation rate of the two regions are highest in compari- son with other regions (Table 1), but this relationship is not significant in these regions. Thus, for developed regions, the income sources from non-farm activities may be sufficient to guarantee for farm households’ living and investing more in the farm activities for them does not seem to be a necessity.
Similarly, the estimation results of Central Highland are also not statistically significant. However, the non-farm activities of this region are the less developed region than the two areas RRD and SEA, and the agricultural production is the main activity. The average non-farm income of farm household is lowest (only 21.4 million VND) as compared to other regions, while the average of farm income is 51.6 mil- lion VND. Earnings from non-farm work make up a small proportion (29.6%) of the total household income. There- fore, the income from the agricultural production of farm households can be used for consumption purposes, as well as re-invested in agricultural production. Indeed, the non- farm sector has no effect on farm production in this region.
The coefficients for some of other variables differ across the six regions as well. The head’s gender is posi- tive and significant related to total inputs cost even when controlling for non-farm income in Midland and Northern
Table 5: The effect of non-farm activities on total agricultural inputs cost by region.
Dependent variables:
total inputs cost (IV Tobit) RRD MNM NCC CHL SEA MRD
Non-farm variables
Non-farm income -0.031 0.391* 0.681** 0.956 0.892 1.221*
[0.34] [0.22] [0.34] [0.80] [1.15] [0.62]
Household socio-economic characteristics variables
Head’s gender 3.455 7.785*** 7.766** 0.127 -16.756 7.252
[6.14] [2.59] [3.17] [8.41] [25.63] [7.18]
Head’s age -0.382** -0.215** -0.343*** -0.085 0.927 -0.216
[0.16] [0.09] [0.13] [0.17] [1.24] [0.22]
Education 0.987 -0.424 -0.496 -0.383 -3.247 -1.343
[1.28] [0.55] [0.73] [1.17] [2.44] [1.27]
Household size 0.18 -0.881 -2.455 -1.223 -12.191 5.338
[3.15] [0.90] [2.43] [2.88] [13.23] [3.37]
Ethnicity 27.913*** 9.312 6.033 22.691** 25.942 -0.695
[10.26] [6.06] [7.47] [10.75] [28.32] [7.72]
Farmland 14.266 3.531*** 7.620*** 22.847*** 24.499** 37.753***
[12.05] [1.12] [1.93] [5.80] [11.58] [5.23]
Male labour 5.231 1.582 -1.872 -3.404 4.08 -21.460**
[6.85] [2.61] [4.62] [5.08] [18.50] [8.81]
Female labour 13.161* 0.129 -3.847 0.612 -2.2 -15.959*
[7.12] [2.51] [4.72] [5.17] [11.64] [9.13]
Constant -22.785 6.013 13.995 -13.146 -28.192 1.301
[19.76] [5.74] [14.55] [13.39] [46.92] [17.22]
Number of obs. 1,058 1,159 1,145 364 229 868
Note: * P < 0.05, ** P < 0.01, and *** P < 0.001.
RRD: Red River Delta, MNM: Midland and Northern Mountainous, NCC: Northern and Coastal Central, CHL: Central Highland, SEA: South Eastern Area, MRD: Mekong River Delta.
Values in parentheses indicate the robust standard errors clustered at the commune level.
Instrumental variables: Factory/manufacture location, Time_Town, Time_City.
Source: Authors’ estimation
Mountainous Areas (MNM) and Northern and Coastal Central (NCC). This suggests that having a male head is significant for the agricultural inputs expenditure in these two regions. The coefficients of head age are negatively sig- nificant in the Red River Delta (RRD), Midland and North- ern Mountainous Areas (MNM) and Northern and Coastal Central (NCC) regions. Younger heads tend to spend more on agricultural inputs compared to older households, indicat- ing a generational difference in the investment on farming in these regions. The result of the ethnicity variable show that it has a positive significance in Red River Delta (RRD) and Central Highland (CHL) regions. This means that Kinh households tend to spend more agricultural inputs for pro- duction than the other minorities in these two regions. In the Red River Delta (RRD) region, female labour is important for agricultural inputs expenses, while male and female labour are not important for the investment in agricultural inputs in the Mekong River Delta (MRD) region. This indicates that having a higher number of male and female family workers reduces the inputs cost in these regions.
The parameters of farmland are positively significant in all regions except Red River Delta, implying that agricultural
expenses increase when the cultivated land size increases.
The insignificant result of the Red River Delta region could be explained by the fact that average farmland of this region is too small compared to other regions (only 0.27 ha) and agricultural productivity largely relies on crop rotation. The other variables, such as education level and household size are not statistically significant.
Input costs can be analysed by individual categories as well. The purpose of such an analysis is to examine whether participation in non-farm activities is most likely to affect certain types of costs in agricultural production in different regions. A IV Tobit regression has been run, to deal with the zero dependent variables, and it has been conducted for each of the six regions separately. Results on the effect of participating non-farm activities on agricultural input costs categories following the regions are presented in Table 6. Of course, the results are statistically insignificant in all cases of input categories in the regions of Red River Delta, South Eastern Area and Central Highland. These estimation results are consistent with the analysis of the regions mentioned above, implying that participation in non-farm activities has no effect on the expenditures in agricultural production here.
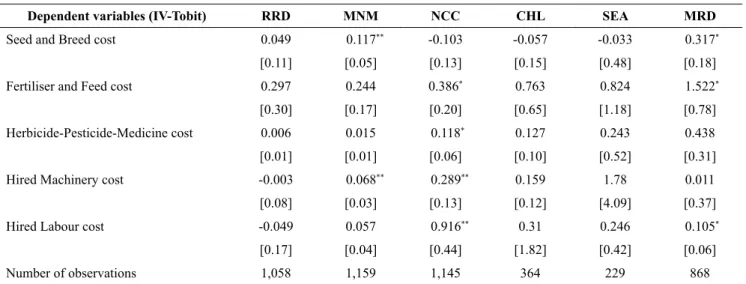
Results are positively and statistically significant in some cases in three regions: Midland and Northern Mountainous Areas, Northern and Coastal Central and Mekong River Delta. Specifically, in the Midland and Northern Mountain- ous Areas region, the coefficients of non-farm activities have positively significant in seed-breed expense and hired machinery cost models. This indicates that farm households use non-farm income to buy seed, breed and hire machin- ery for farm activity. However, in the Northern and Coastal Central region, the income source from non-farm activities seems to have a positive effect on many types of input costs in agricultural production. Farm households in this region tend to use non-farm income to invest in more fertiliser, feed, herbicide, pesticide, medicine and hired machinery for the production process as well as to hire labour possibly as a substitute for family labour lost through the non-farm mar- ket. In the Mekong River Delta region, the estimation results indicate that this income source contribute to an important role in purchasing seed, breed, fertiliser, feed, and hire labour for agricultural production. Consequently, the role of non-farm income in spending agricultural inputs is different region by region. Due to the difference in geographical loca- tion, land type, weather conditions and types of agriculture between regions, the tendency to use inputs in agricultural production is also not alike.
Our findings are consistent with the findings from pre- vious studies of Oseni and Winters (2009) and De Brauw (2010) who found the difference in the relationship between non-farm activities and agricultural inputs expenses among regions. However, the paper of Oseni and Winters (2009) only pointed out the difference in the results but did not explain the reason. De Brauw (2010) also studied the rela- tionship between migration and agricultural production in Vietnam and indicated the regional differences between the north and the south. The author explained that the effects of migration on input demand in rice production differs between the north and south due to the difference in the
Table 6: The effect of non-farm activities on agricultural input cost categories by region.
Dependent variables (IV-Tobit) RRD MNM NCC CHL SEA MRD
Seed and Breed cost 0.049 0.117** -0.103 -0.057 -0.033 0.317*
[0.11] [0.05] [0.13] [0.15] [0.48] [0.18]
Fertiliser and Feed cost 0.297 0.244 0.386* 0.763 0.824 1.522*
[0.30] [0.17] [0.20] [0.65] [1.18] [0.78]
Herbicide-Pesticide-Medicine cost 0.006 0.015 0.118* 0.127 0.243 0.438
[0.01] [0.01] [0.06] [0.10] [0.52] [0.31]
Hired Machinery cost -0.003 0.068** 0.289** 0.159 1.78 0.011
[0.08] [0.03] [0.13] [0.12] [4.09] [0.37]
Hired Labour cost -0.049 0.057 0.916** 0.31 0.246 0.105*
[0.17] [0.04] [0.44] [1.82] [0.42] [0.06]
Number of observations 1,058 1,159 1,145 364 229 868
Note: * P < 0.05, ** P < 0.01, and *** P < 0.001.
RRD: Red River Delta, MNM: Midland and Northern Mountainous, NCC: Northern and Coastal Central, CHL: Central Highland, SEA: South Eastern Area, MRD: Mekong River Delta.
Values in parentheses indicate the robust standard errors clustered at the commune level.
Instrumental variables: Factory/manufacture location, Time_Town, Time_City.
Source: Authors’ estimation
production process of the two regions. Our paper not only indicates that the difference in this relationship across six regions is due to the geographical characteristics of each region but is also based on the theoretical framework of the agricultural household model (Singh et al., 1986), when the markets are imperfect and farm households always face credit constraints. The income from the non-farm activities can provide cash which may be used to purchase inputs or otherwise invest in agricultural production and can also be sued to hire labour to replace the farm labour lost. However, when farm households increase their participation in jobs outside of farm production activities, there is less household labour available for on-farm work. This family labour lost due to the shifting labour from farm to non-farm activities cannot be fully substituted by hired labour because of the imperfection of the labour market. Thus, in turn, this could limit the demand for credit to invest in agricultural pro- duction (Key, 2020). Indeed, the regions/households that have high non-farm income/ participation appear to be less credit-constrained, and as a result, non-farm income has no effect on investment in agricultural inputs in the developed regions. However, if farmers engage in non-farm activities at such a level that they can guarantee their family labour for farm activity and use non-farm income to hire labour to compensate for the loss of family labour, non-farm income has a positive effect in loosening credit constraints for them.
Therefore, in the case of less developed regions, despite hav- ing a relatively lower chance of joining in non-farm activi- ties, farmers who had this income source generally used it to purchase agricultural inputs.
Conclusions
In the context of incomplete credit markets, seeking an alternative income source could help farmers to overcome the credit constraint. The first contribution of the paper is