The effect of grain size, surface roughness, and joint compressive strength on shear strength along discontinuities of Hungarian sandstones
Alina Vattai*, Nikoletta Rozgonyi-Boissinot
Department of Engineering Geology and Geotechnics, Budapest University of Technology and Economics, Budapest, Hungary
Received: August 3, 2017; accepted: December 15, 2017
In this study, the joint shear strength of low-strength Hungarian sandstones of different grain size and surface roughness was investigated. The direct shear tests along discontinuities were performed under constant normal load. Previously, the direct shear test basic rock mechanic parameters of the investigated intact rocks were determined, such as the UCS value. The goal of the investigation is to determine the effect of the surface properties, such as surface roughness, grain size, and surface quality, on the joint shear strength of Hungarian sandstones. The failure curves derived from the experimental results of direct shear tests under laboratory conditions, and the empirical results according to Barton and Choubey (1977) were compared.
Keywords:failure criterion, grain size, Hungarian sandstone, joint compressive strength, joint roughness coefficient, shear strength along discontinuities, uniaxial compressive strength
Introduction
Knowledge of shear strength along discontinuities in rock mass is essential for the design process of underground structures, such as tunnels (Borbély et al. 2015), foundations, and rock slope stability assessment (Török et al. 2016) of a quarry during
*Corresponding author: Alina Vattai; Department of Engineering Geology and Geotechnics, Budapest University of Technology and Economics, Muegyetem rkp. 3, Budapest H-1111, Hungary
E-mail:vattai.alina@epito.bme.hu
This is an open-access article distributed under the terms of theCreative Commons Attribution-NonCommercial 4.0 International License, which permits unrestricted use, distribution, and reproduction in any medium for non- commercial purposes, provided the original author and source are credited, a link to the CC License is provided, and changes–if any–are indicated.
DOI: 10.1556/24.61.2018.03 First published online February 14, 2018
and after the excavation phase. The correct value can be predicted theoretically and empirically. The most common empirical models developed in the 20th century are based on the Mohr–Coulomb theory, where shear strength is calculated as multipli- cation of normal stress and tangent of friction angle. These models are by Patton (1966), which is developed with angle of saw tooth of the surface of discontinuity; by Ladanyi and Archambault (1970), in which the value of the shear strength of discontinuity is estimated in an energetic way; by Jaeger (1971), where shear stress comes from both friction and failure; and by that of Barton and Choubey (1977). The latter one derives shear strength from normal stress (σn), joint compressive strength (JCS), friction angle (φ), and joint roughness coefficient (JRC). JRC can be estimated by numerous methods: (a) the comparison of the measured profiles of the specimens with standard ones (Barton and Choubey 1977), (b) estimating the value of JRC as a function of amplitude of joint roughness of the surfaces (Barton and Bandis 1982), (c) the use of fractal dimensions (Sanei et al. 2015), (d) 3D scanning (Buocz et al. 2017a), and (e) 3D image processing (Krupa et al. 2013). The accurate value of JRC is normally evaluated from the geometry of the surface of the joint or the discontinuity. One of the most common methods is given by Barton and Choubey, which is based on visual comparison with the standard profiles and can be accomplished very simply but quite subjectively, bothin situand in laboratory conditions. The value of JCS can be evaluated in different ways. It was originally estimated by Schmidt hammer, which is used for measuring hardness of the surface, but in the case of small specimens, the results of Schmidt hammer measuring are not appropriated. Barton (1976) recommended the application of uniaxial compressive strength (UCS) of intact rock as JCS in the event of a fresh joint surface and a quarter of UCS when the surface is weathered. One of the aims of this study is to analyze the effect of changing the JRC value determined by the (quite subjective) visual comparison. The other aim is to compare the results evaluated by the method of Barton and Choubey, supposing fresh and weathered joint surface, with the results of direct shear tests in laboratory conditions on Hungarian sandstone samples.
Materials and methods
Materials
In this study, core samples from boreholes situated in the area of Sopron near the western border of Hungary (Fig. 1) were analyzed. Samples are classified as fine- grained (0.125–0.25 mm) sandstone (Fig. 2a), medium-grained sandstone (matrix 0.25–0.5 mm) with 1–5 mm gravel (Fig. 2b), coarse-grained sandstone (matrix 0.5– 1 mm) with 5–15 mm gravel (Fig.2c), and very coarse-grained sandstone (1–2 mm) with 5–15 mm gravel (Fig. 2d). The fine- and medium-grained samples are from sandstone layers 30 m beneath the surface, whereas coarse- and very coarse-grained ones are from the depth of 20 m.
Fig. 1
Location of the samples (Google Earth)
Fig. 2
Texture offine (a), medium (b), coarse (c), and very coarse-grained sandstone samples (d)
Methods
In this study, the empirical failure criterion developed by Barton and Choubey is used:
τ=σn×tg
φr +JRC×log10
JCS
σn
: (1)
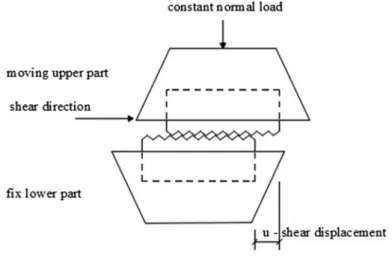
According to this model, shear strength along discontinuities (τ) is defined as a function of normal stress (σn), JRC, JCS, and friction angle (φr). The most common method for the shear testing of discontinuities is the direct shear test, carried out in the field asin situshear testing or under laboratory conditions. In both cases, the shear tests are carried out with constant normal load or constant normal stiffness. In this paper, the results of direct shear tests on discontinuities under laboratory conditions at constant normal loads were analyzed. Normal stress ranged between 0.08 and 0.86 MPa. The applied geometry of the specimens is presented in Table1. Concrete was used forfixing both the lower and the upper parts of the specimen inside the shear test equipment.
During the test process, the lower part of the shear box wasfixed in all directions and the upper part can move in the direction of shearing (Fig.3). The parallelism of the surface of the specimen and the direction of shearing are very important after the encapsulation of the rock sample (Buocz et al. 2017b). During the process, shear displacements, normal load, and shear load were detected continuously. A graph of shear stresses and normal stresses versus shear displacements was calculated.
The effect of joint roughness is represented in the Barton and Choubey’s formula (Eq. 1) by JRC, which is quite subjective and difficult to estimate accurately. Many methods have been developed for estimating the value of JRC. One of the most common ways of assessment is measuring the profiles of joint surface with a special profilometer. This method is based on a visual comparison with 10 standard profiles (each profile represents three values, e.g., 18–20) established by Barton and Choubey (1977). It is simple to use, but it is quite difficult to estimate the correct average JRC value of the joint surface because visual comparison is subjective and three values are associated with each profile.
In this study, two profiles of the upper part and two profiles of the lower part of samples were measured, as the very coarse-grained sandstone specimen 37 shown in Fig.4. One of the intervals of the 10 standard profiles was assigned to each sandstone profile, and integer JRC values between the probable minimal and maximal average of each sample were applied during further analysis, instead of applying the simple average of the four profiles. Figure4shows the four profiles of sample 37 with JRC intervals of 8–10, 8–10, 12–14, and 8–10, respectively. The applied 9–11 average interval of sample 37 and values of all samples are in Table1.
Furthermore, results of uniaxial compressive tests were applied. Failure curves based on Barton and Choubey’s empirical formula were compared with results of direct shear tests in laboratory conditions.
Table1 PropertiesofsandstonesamplesandappliedvaluesofparametersinthemodelofBartonandChoubey(1977) SpecimenGrainsizeof sandstoneFormSize(mm2)Jointroughness coefficient Jointcompressive strength(MPa) Residual friction angle(°) Uniaxial compressive strength(MPa)
Uniaxial compressive strength/4(MPa) 59FineSemi-square4,6037–99.612.4040 27MediumSemicircle3,2877–936.229.6032 23CoarseSquare9,31817–1918.054.5138 21VerycoarseSquare7,82916–184.961.2448 37VerycoarseSemi-square5,2059–1114.773.6941
Fig. 3 Direct shear test
Fig. 4
The two profiles of the upper part of sample 37 (a and b) and of the lower part of the sample 37 (c and d)
Since the determination of the weathering state of joint surface is quite inaccurate, values of UCS and UCS/4 were applied to every single sample representing the JCS of fresh and weathered joint surfaces. The UCS results were from uniaxial compressive tests carried out according to ISRM 2007 procedures and regulations on UCS samples (Bieniawski and Bernede 2007) from the same sandstone layers as direct shear test samples. Thefit between empirical failure curves and curves based on the results of direct shear tests was analyzed.
The value of the residual friction angle was obtained from the slope of the graph of shear stresses versus normal stresses under laboratory conditions. Differences between the characteristics of failure curves were plotted using Barton and Choubey’s model, and the curve derived from experimental data pairs of shear stresses and normal stresses demonstrated how the subjective detection of roughness (JRC) and weathering (UCS vs. UCS/4) can change the range of the interval between the curves based on the empirical method and those based on experimental results. The applied values of parameters in the model of Barton and Choubey are shown in Table1.
Results
In this study, shear strength along discontinuities of sandstone samples of different grain sizes was estimated by linear regression on data pairs of direct shear tests under laboratory conditions and using the empirical method of Barton and Choubey (1977).
Besides analyzing thefit between the curves of the two different processes, the aim of this study was to examine the effects of JRC and JCS on shear strengths based on the formula of Barton and Choubey. Three empirical failure curves with three different JRC values between the probable minimal and maximal average JRC of each sample were plotted using UCS as JCS; so were three others by using UCS/4 as JCS. UCS/4 represents the weathering of the joint surfaces according to Barton (1976). The curves of each specimen (σnmax=0.9 MPa) can be seen in Figs5–9. The differences between empirical failure curves with average values of JRC and failure curves derived by experimental data pairs are presented in Table2.
Assuming fresh joint surfaces (JCS is equal to UCS), the three empirical failure curves of each sample, based on the method of Barton and Choubey, are parallel to each other in the linear sections. Differences of shear stresses between neighboring curves are less than 0.04 MPa in the case offine-grained sandstone (Fig.5), less than 0.05 MPa in the case of medium-grained (Fig.6) and very coarse-grained sandstone (Figs8and9), and less than 0.09 MPa in the case of coarse-grained sandstone (Fig.7).
It can be seen in Table2that in the case offine- and medium-grained sandstone in the range ofσ3=0.3–0.9 MPa, the values of failure curves of experimental data are lower than the values of empirical failure curves with the maximum differences of 0.133 and 0.210 MPa, respectively. Whenσ3is less than 0.3 MPa, curves based on experimental data are above them. In the case of coarse- and very coarse-grained sandstone in the entire range ofσ3=0.15–0.9 MPa, curves of experimental data pairs
Fig. 5
Results of direct shear tests in laboratory conditions and failure curves based on formula of Barton and Choubey (1977) onfine-grained sandstone (sample 59)
Fig. 6
Results of direct shear tests in laboratory conditions and failure curves based on formula of Barton and Choubey (1977) on medium-grained sandstone (sample 27)
Fig. 7
Results of direct shear tests in laboratory conditions and failure curves based on formula of Barton and Choubey (1977) on coarse-grained sandstone (sample 23)
Fig. 8
Results of direct shear tests in laboratory conditions and failure curves based on formula of Barton and Choubey (1977) on very coarse-grained sandstone (sample 21)
are beneath the empirical failure curves with the maximum differences of 0.832, 0.549, and 0.399 MPa, respectively.
Assuming weathered joint surfaces (JCS is equal to UCS/4), differences between neighboring failure curves average 0.01–0.03 MPa in the parallel sections of each sample, as shown in Figs 5–8. The differences between the values of empirical failure curves and curves derived by experimental data are included in Table 2.
Curves of experimental data are above the empirical failure curve of fine and medium-grained sandstone in the range ofσ3=0.15–0.45 MPa. From within this range, experimental curves are lower, with a maximum difference of 0.066 MPa. In the case of coarse- and very coarse-grained sandstone, failure curves indicate higher values of shear strength, with the maximum differences of 0.275, 0.039, and 0.168 MPa.
In the case offine-grained sandstone, as shown in Table3, the average differences between the three empirical failure curves, assuming fresh joint surfaces, and the three assuming weathered joint surfaces are less than 0.2 MPa (maximum 0.156 MPa); in the case of medium-grained sandstone, they are less than 0.15 MPa (maximum 0.144 MPa). More significant differences can be recognized in the parallel sections for coarse-grained (maximum 0.558 MPa) and very coarse-grained sandstone (maximum 0.511 and 0.231 MPa). It can be seen in Table 3that greater differences in shear strength (maximum 0.558 and 0.511 MPa) are associated with higher values of JRC (17–18) and are not associated with higher values of JCS (UCS).
Fig. 9
Results of direct shear tests in laboratory conditions and failure curves based on formula of Barton and Choubey (1977) on very coarse-grained sandstone (sample 37)
Table2 ShearstrengthdifferencesbetweentheempiricalfailurecurveswiththeaveragevalueofJRCandcurvesderivedbyexperimentaldata SpecimenGrainsizeof sandstone Joint roughness coefficient (average) Uniaxial compressive strength (MPa) Uniaxial compressive strength/4 (MPa)
Normalstress(MPa) 0.150.30.450.60.750.9 Shearstrengthbasedonexperimentaldataofdirectsheartests(MPa) Shearstrengthbasedonempiricalfailurecurves(MPa) Differencesbetweenthetwovaluesofshearstrength(MPa) 59Fine89.610.2380.3650.4930.6200.7480.875 0.2100.3850.5490.7060.8591.008 −0.0280.0200.0560.0860.1110.133 2.400.2380.3650.4930.6200.7480.875 0.1760.3240.4630.5960.7250.851 −0.061−0.041−0.029−0.024−0.022−0.024 27Medium836.220.2450.3390.4340.5280.6230.717 0.1920.3530.5040.6490.7900.927 −0.0520.0140.0710.1210.1670.210 9.060.2450.3390.4340.5280.6230.717 0.1620.2980.4260.5480.6670.783 −0.082−0.041−0.0080.0200.0450.066
Table2(Continued) SpecimenGrainsizeof sandstone Joint roughness coefficient (average) Uniaxial compressive strength (MPa) Uniaxial compressive strength/4 (MPa)
Normalstress(MPa) 0.150.30.450.60.750.9 Shearstrengthbasedonexperimentaldataofdirectsheartests(MPa) Shearstrengthbasedonempiricalfailurecurves(MPa) Differencesbetweenthetwovaluesofshearstrength(MPa) 23Coarse1818.050.2290.3470.4660.5840.7030.821 0.5780.8261.0531.2641.4631.653 0.3490.4790.5870.6800.7610.832 4.510.2290.3470.4660.5840.7030.821 0.3160.5030.6680.8190.9611.096 0.0880.1560.2020.2350.2580.275 21Verycoarse174.960.2080.3760.5440.7120.8801.048 0.5170.7700.9981.2081.4071.597 0.3090.3940.4540.4960.5270.549 1.240.2080.3760.5440.7120.8801.048 0.3020.4890.6540.8070.9501.087 0.0940.1130.1100.0950.0700.039 (Continued)
Table2(Continued) SpecimenGrainsizeof sandstone Joint roughness coefficient (average) Uniaxial compressive strength (MPa) Uniaxial compressive strength/4 (MPa)
Normalstress(MPa) 0.150.30.450.60.750.9 Shearstrengthbasedonexperimentaldataofdirectsheartests(MPa) Shearstrengthbasedonempiricalfailurecurves(MPa) Differencesbetweenthetwovaluesofshearstrength(MPa) 37Verycoarse1014.770.1420.2740.4060.5380.6700.802 0.2700.4790.6710.8541.0301.201 0.1280.2050.2650.3160.3600.399 3.690.1420.2740.4060.5380.6700.802 0.2140.3830.5390.6880.8310.970 0.0720.1090.1330.1500.1610.168
Table3 ShearstrengthdifferencesbetweentheempiricalfailurecurveswithaveragevaluesofJRCassumingfreshandweatheredjointsurfaces SpecimenGrainesize ofsandstone Joint roughness coefficient (average) Uniaxial compressive strength (MPa) Uniaxial compressive strength/4 (MPa)
Normalstress(MPa) 0.150.30.450.60.750.9 Shearstrengthbasedonempiricalfailurecurves(fresh)(MPa) Shearstrengthbasedonempiricalfailurecurves(weathered)(MPa) Differencesbetweenthetwovaluesofshearstrength(MPa) 59Fine89.610.2100.3850.5490.7060.8591.008 2.400.1760.3240.4630.5960.7250.851 0.0330.0600.0850.1100.1330.156 27Medium836.220.1920.3530.5040.6490.7900.927 9.060.1620.2980.4260.5480.6670.783 0.0300.0550.0780.1010.1220.144 23Coarse1818.050.5780.8261.0531.2641.4631.653 4.510.3160.5030.6680.8190.9611.096 0.2620.3220.3850.4450.5030.558 21Verycoarse174.960.5170.7700.9981.2081.4071.597 1.240.3020.4890.6540.8070.9501.087 0.2150.2810.3430.4020.4570.511 37Verycoarse1014.770.2700.4790.6710.8541.0301.201 3.690.2140.3830.5390.6880.8310.970 0.0560.0960.1320.1670.1990.231
It is worth noting that, in studying the equations of the regression curves derived by experimental data pairs (Figs5–9) in the cases offine-, medium-, and coarse-grained sandstone, the values of apparent cohesion (c=0.11, 0.15, 0.11 MPa, respectively) are higher than in the case of very coarse-grained sandstone (c=0.04 and 0.01 MPa).
Rounded gravel in very coarse-grained sandstones (gravel size of 5–15 mm) can cause almost zero apparent cohesion, because during shearing tests, they roll on each other instead of shearing.
Discussion
There are several methods for estimating shear strength along discontinuities, and one of the most common ones, developed by Barton and Choubey (1977), is based on normal stress (σnand JRC), JCS, and friction angle (φ). Assessment of the values of JCS in this method can be normally accomplished using the Schmidt hammer, but Barton (1976) recommended using UCS value in the case of fresh joint surfaces and one quarter of UCS in the case of weathered joint surfaces. When examining sandstone samples in this study, curves with UCS/4 show a betterfit to the curve of experimental data, just like in the work of Özvan et al. (2013) who examined granite samples from Turkey.
JRC can be estimated by numerous methods, and the most commonly used one was developed by Barton and Choubey (1977), which is based on visual comparison. This method is one of the easiest for estimation but quite subjective. Evaluation of the accurate value is very important because, as the results of this study show, in the case of joint surfaces with higher JRC values, small inaccuracies in the detection of JRC can cause significantly higher shear strength differences. According to this study, the grade of JRC values has a greater effect on shear strength than the grade of JCS (UCS).
Conclusions
The results of this study demonstrate that the differences between the failure curves based on Barton and Choubey’s (1977) model and the curves derived from experi- mental data are small in the case of joint surfaces with low values of JRC (fine, medium, and one of the very coarse-grained sandstone samples). Furthermore, the higher values of JRC measured on the surface of a sandstone sample (coarse and one of the very coarse-grained samples) show greater differences between empirical failure curves of fresh and weathered surfaces (Table3), although differences between the failure curves with the same values of UCS or UCS/4 are not significant. Results of the empirical method, assuming weathered joint surfaces (JCS=UCS/4), show a betterfit with the experimental results than those assuming fresh joint surfaces (JCS=UCS), although scale of JRC has a greater effect on the shear strength than the scale of JCS (UCS). It is worth noting that besides the size, how the shape of the sand and gravel affects experimental shear strength.
References
Barton, N. 1976: The shear strength of rock and rock joints.–International Journal of Rock Mechanics and Mining Sciences & Geomechanics Abstracts, 13/9, pp. 255–279.
Barton, N., S.C. Bandis 1982: Effects of block size on the shear behaviour of jointed rock.–Proceedings of the 23rd U.S. Symposium on Rock Mechanics, Berkeley, pp. 739–760.
Barton, N., V. Choubey 1977: The shear strength of rock joints in theory and practice.–Rock Mechanics, 10, pp. 1–54.
Bieniawski, Z.T., M.J. Bernede 2007: Suggested methods for determining the uniaxial compressive strength and deformability of rock materials.–In: Ulusay, R., J.A. Hudson (Eds): The Complete ISRM Suggested Methods for Rock Characterization, Testing and Monitoring: 1974–2006. ISRM Turkish National Group, Ankara, pp. 151–156.
Borbély, D., T. Megyeri, P. Görög 2015: Significance of joint pattern on modelling of a drill and blast tunnel in crystalline rock.–In: Lollino, G., D. Giordan, K. Thuro, C. Carranza-Torres, F. Wu, P. Marinos, C.
Delgado (Eds): Engineering Geology for Society and Territory. Springer International Publishing, Cham, 6, pp. 905–908.
Buocz, I., N. Rozgonyi-Boissinot, Á. Török 2017a: Influence of discontinuity inclination on the shear strength of Mont Terry Opalinus claystones.–Periodica Polytechnica Civil Engineering, 61/3, pp. 447– 453,https://doi.org/10.3311/PPci.10017.
Buocz, I., N. Rozgonyi-Boissinot, Á. Török 2017b: The angle between the sample surface and the shear plane: Its influence on the direct shear strength of jointed granitic rocks and Opalinus claystone.– Procedia Engineering, 191, pp. 1008–1014.
Jaeger, J.C. 1971: Friction of rocks and stability of rock slopes.–Géotechnique, 21, pp. 148–158.
Krupa, Á., F. Deák, P. Görög, I. Buocz, Á. Török 2013: Qualitative roughness profiling of fracture surfaces of granitic host rock of a radioactive waste disposal site.–In: Kwasniewski, M., D. Lydzba (Eds): Rock Mechanics for Resources, Energy and Environment: Eurock 2013. Taylor and Francis Group, London, pp. 609–614.
Ladanyi, B., G. Archambault 1970: Simulation of shear behaviour of a jointed rock mass.–Proceedings of the 11th Symposium on Rock Mechanics, AIME, New York, pp. 105–125.
Özvan, A., I. Dincer, A. Acar, B. Özvan 2013: The effects of discontinuity surface roughness on the shear strength of weathered granite joints.–Bulletin of Engineering Geology and the Environment, 73/3, pp.
801–813.
Patton, F.D. 1966: Multiple modes of shear failure in rock.– Proceedings of the 1st Congress of the International Society for Rock Mechanics, Lisbon, pp. 509–513.
Sanei, M., L. Faramarzi, A. Fahimifar, S. Goli, A. Mehinrad, A. Rahmati 2015: Shear strength of discontinuities in sedimentary rock masses based on direct shear tests.–International Journal of Rock Mechanics and Mining Sciences, 75, pp. 119–131.
Török, Á., Gy. Bögöly, B. Czinder, P. Görög, B. Kleb, B. Vásárhelyi, T. Lovas, Á. Barsi, B. Molnár, Z.
Koppányi, J.Á. Somogyi 2016: Terrestrial laser scanner aided survey and stability analyses of rhyolite tuff cliff faces with potential rock-fall hazards, an example from Hungary.–In: Ulusay, R., O. Aydan, H.
Gercek, M.A. Hindistan, E. Tuncay (Eds): Rock Mechanics and Rock Engineering: From the Past to the Future: Eurock 2016. Taylor and Francis Group, London, pp. 877–881.