How to cite:
Berács J., Gyulavári, T., Heslop, L.A., Papadopoulos, N. (2000): An Exploratory Study on the Role of Familiarity in Product Evaluations. In: Berend Wierenga, Ale Smidts, Gerrit Antoniedes (ed.): Proceedings of the 29th EMAC conference, Rotterdam 23-26 May. pp. 1-9.
Rotterdam: Erasmus University Press. (ISBN: 90-5892-003-8)
An Exploratory Study on the Role of Familiarity in Product Evaluations
József Berács a
Tamás Gyulavári a
Louise A. Heslop b
Nicolas Papadopoulos b
a. Budapest University of Economic Sciences, Budapest, Hungary
b. Carleton University, Ottawa, Canada
Track
Consumer Behavior or
Marketing Communication and Brand Management
An Exploratory Study on the Role of Familiarity in Product Evaluations
Abstract
There is growing interest among researchers working in the areas of product-country image effects, and more generally international consumer behavior, in the potential relat ionship between consumers’ familiarity with, and evaluation of, products from various countries. We use data from a consumer survey in Hungary to attempt an initial exploration of this relationship. The data support findings from earlier similar studies but also suggest that affective considerations may be playing a considerable role in the evaluations of domestic products, and that the relationship of familiarity with product evaluations may vary significantly from country to country and may not be as strong as previously thought.
1. Background
The role of familiarity in product evaluations by consumers has been examined in a limited number of country of origin studies. Some results support the hypothesis that lower familiarity increases the importance of origin country image (Johansson 1989), since consumers are likely to need and use more extrinsic cues in purchase decisions in the absence of information about a product’s intrinsic characteristics. Cordell (1992) and Brisoux and Cheron (1990) suggest that this relationship may differ depending on the product category involved. Erickson, Johansson and Chao (1984) ascertained that product ownership, which suggests a high degree of familiarity, has no influence on attitudes. More recently, McWilliam and Ayrosa (1996) studied the familiarity-evaluation issue in the context of involvement theory. They suggest that there is a strong relationship between enduring involvement and the direction of the country of origin effect, but the former construct does not affect the strength of the latter.
2. Method and Objectives
This paper reports preliminary results from a Hungarian survey that was part of a large multinational study. The paper focuses on a preliminary examination of assumed relationships between familiarity and product beliefs, product evaluation, and purchase intentions, drawing partly from a product-country image model developed by Papadopoulos, Marshall, and Heslop (1988). Our expectation, based on earlier findings in Hungary (Papadopoulos, Heslop, and Beracs 1990) and elsewhere, was that respondents would report greater familiarity with
2
domestic than with foreign products in spite of the greater presence of foreign brands following the political and economic changes of a decade ago. Also in line with earlier research, we further expected that evaluations would be more positive for products from more developed countries, and vice-versa; that affective considerations would not figure prominently in product evaluations; and that familiarity would be strongly associated with product evaluations and buying intentions, and somewhat less so with product beliefs.
The survey utilized a standardized research instrument developed for the multinational study, which was managed and coordinated centrally but with input from research collaborators in each country to ensure compatibility with local conditions. The questionnaire was translated for the fieldwork using the back-translation technique. Consumers were asked to assess the products of five countries – the U.S., Japan, Canada, Sweden, and their own.
Two sections are of interest in this paper. One consisted of a 20- item, 7-point bipolar adjective scale that focused on respondent evaluations of each country’s products (the positive-negative ends of the items were randomly assigned to the left or right of the scale to prevent response routinization, and the responses were recoded after data inputting so that 7=positive). The other focused on top-of- mind awareness (TOMA), asking respondents to note the first four brands or products which they associate with each of the countries.
The survey was carried out in Hungary’s capital city, Budapest. The drop-off/pick-up technique was utilized for the fieldwork, resulting in a high response rate of 71% and a total of 303 usable questionnaires. The final sample included almost equal numbers of males and females and represents the population well, except for a slight skewness toward opinion leaders (individuals with somewhat higher education and income levels, and somewhat younger age on average, than the norm), who are particularly relevant to this type of research.
3. Preliminary Results and Discussion
3.1. Familiarity
The means and ranks for three scale items related to familiarity are shown in Table 1. The results were tested using repeated measures MANOVA (details not shown here due to lack of space; differences of 0.3 or more between means are sta tistically significant at 0.01). They confirm that, in line with our expectation, Hungarian consumers feel they know significantly more about domestic products, and can find them more easily in the marketplace than foreign products. However, respondents also acknowledge the superiority of Japan and the U.S. in
marketing highly recognizeable brands. Canada, a highly developed country but one that is less known for consumer goods, received the lowest mean scores on all three variables.
Table 1. Familiarity with the Countries’ Products
Variable Canada Japan Sweden U.S. Hungary
mean rank mean rank mean rank mean rank mean rank Know a lot about 2.2 5 5.2 2 3.7 4 4.5 3 6.3 1
Easy to find 2.9 5 5.5 2 3.5 4 4.6 3 6.3 1
Recognizeable brands 4.1 5 6.1 1 5.0 4 5.5 2 5.0 3
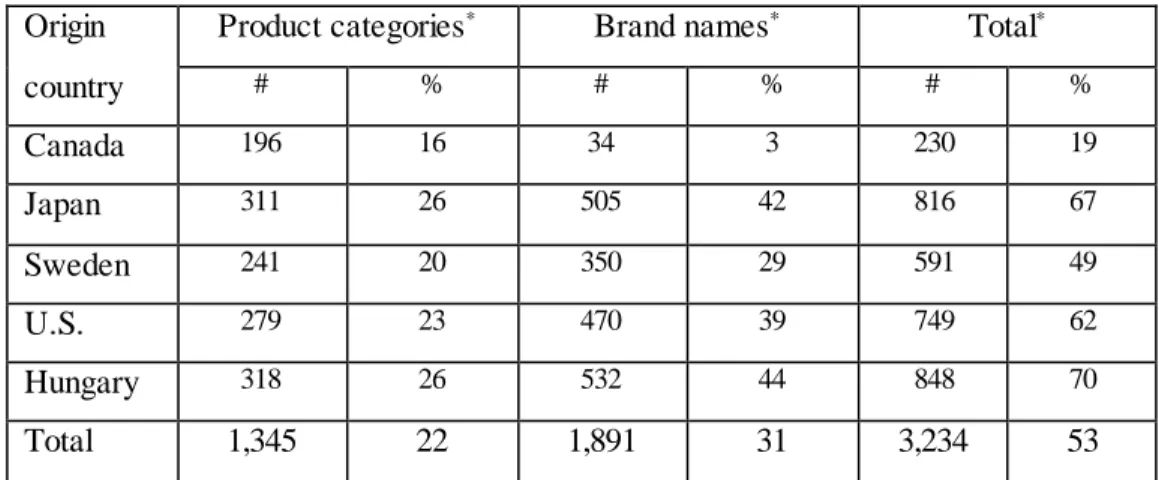
The analysis of responses in the TOMA section underscores and adds further insights to the mean ratings for familiarity. The verbatim responses were coded by sector, product category, and whether the responded offered a brand name or generic product category. Results from the latter classification are shown in Table 2. The maximum number of possible mentions per country is 1,212 (four mentions X 303 respondents). The “Total” column shows that respondents had the greatest difficulty recalling Canadian produc ts (1,212-230=982 missing values) and the least difficulty with Hungary (848 mentions). Canada is also the only country for which respondents mentioned more generic products than brands, with Japan and the U.S.
rivalling Hungary in brand name mentions in spite of the naturally stronger presence of local products in the domestic market.
Table 2. Top-of-mind Awareness: Brand vs. Generic Category responses
Origin Product categories* Brand names* Total*
country # % # % # %
Canada 196 16 34 3 230 19
Japan 311 26 505 42 816 67
Sweden 241 20 350 29 591 49
U.S. 279 23 470 39 749 62
Hungary 318 26 532 44 848 70
Total 1,345 22 1,891 31 3,234 53
* The percentages are by rows (proportions of respondents who cited products and brand names for each country, from the maximum possible of 1,212 mentions).
4
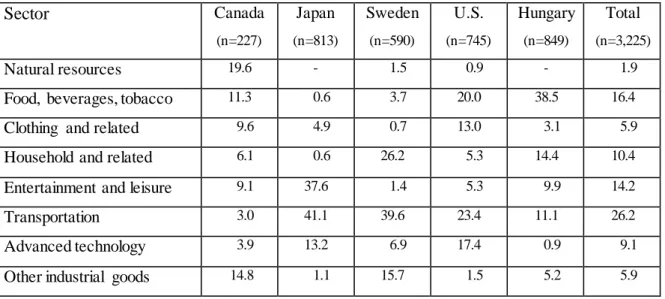
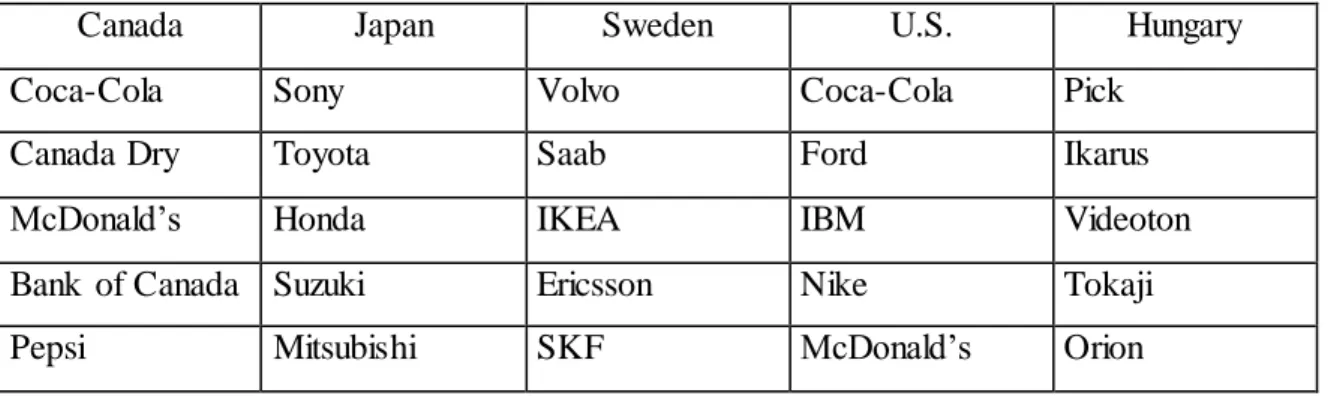
The sectors represented by the products or brands recalled by respondents for each country, which may be assumed to be at the core of the overall country image, also offer additional insights to consumers’ familiarity with and evaluation of the various countries’ products. The results are summarized in Table 3, and Table 4 shows the five most frequently mentioned brand names for each country. Means of transport clearly represent t he greatest proportion of responses overall (26.2%) and are particularly important for some countries, particularly Japan and Sweden. The image of Japan is essentially reflected in its cars and audio-video products (41.1% and 37.6%, or a total of 79% of all mentions); Sweden is represented mostly by cars and household and related products (66%); the U.S. by cars, packaged or “fast” foods, and technology (61%); Canada’s image depends heavily on its natural resources, agriculture, and industrial products (51%); and, given the structure of the domestic market, the predominant category for Hungary is food products followed by household items (53%).
It is interesting to note that, in the case of Canada, only five brand names were mentioned more than one time and four of these were wrongly attributed to that country (Canada Dry is a U.S. brand; Bank of Canada was the only correct mention). Also of interest is the fact that Suzuki cars, which are the first to be assembled in Hungary after the political changes, are important to the domestic economy, and are promoted with a national message (“Suzuki, the car of ours”), were mentioned under “Hungary” by only one percent of the respondents and much more frequently (fourth among the top-5 brands) under the brand’s original home country, Japan.
Table 3. Top-of-mind Awareness: Responses by Sector (%)
Sector Canada
(n=227)
Japan (n=813)
Sweden (n=590)
U.S.
(n=745)
Hungary (n=849)
Total (n=3,225)
Natural resources 19.6 - 1.5 0.9 - 1.9
Food, beverages, tobacco 11.3 0.6 3.7 20.0 38.5 16.4 Clothing and related 9.6 4.9 0.7 13.0 3.1 5.9 Household and related 6.1 0.6 26.2 5.3 14.4 10.4 Entertainment and leisure 9.1 37.6 1.4 5.3 9.9 14.2
Transportation 3.0 41.1 39.6 23.4 11.1 26.2
Advanced technology 3.9 13.2 6.9 17.4 0.9 9.1 Other industrial goods 14.8 1.1 15.7 1.5 5.2 5.9
Services and miscellaneous 5.7 0.6 1.2 12.4 5.8 5.2 Agriculture, fishing 17.0 0.2 3.0 0.8 11.2 4.9
Total 100.0 100.0 100.0 100.0 100.0 100.0
Table 4. Top-of-mind Awareness: Most Frequently Mentioned Brands
Canada Japan Sweden U.S. Hungary
Coca-Cola Sony Volvo Coca-Cola Pick
Canada Dry Toyota Saab Ford Ikarus
McDonald’s Honda IKEA IBM Videoton
Bank of Canada Suzuki Ericsson Nike Tokaji
Pepsi Mitsubishi SKF McDonald’s Orion
3. 2. Product Evaluation
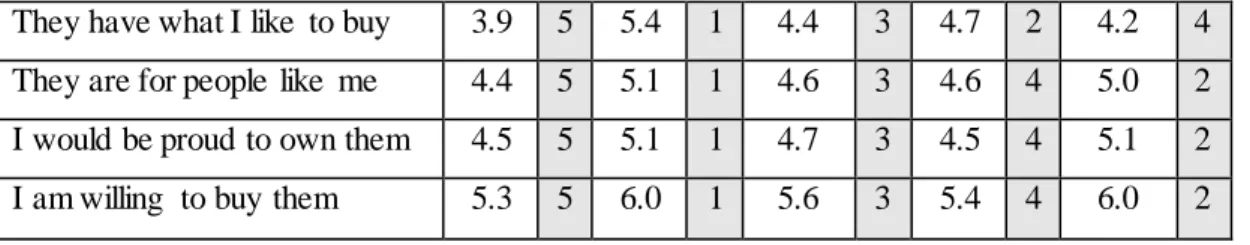
The research instrument included a number of statements concerning product beliefs (e.g., workmanship, reliability, innovativeness) and overall product e valuations. Due to lack of space and the focus of this paper, only results for the latter are shown in Table 5 below.
Drawing from the findings of earlier studies as well as from the scores by Hungarian respondents on the various scale items, the variables can be divided into cognitive (first four) and affective (last three) ones. Respondents evaluated Hungary significantly higher on the affective items, which may mediate the overall evaluation of domestic goods into a more positive direction, and the reverse is true for foreign products (e.g., mean of 5.1 on “proud to own” versus 4.3 on “satisfied” for Hungarian goods, but, respectively, 4.5 and 5.1 for the U.S.; all differences significant based on the MANOVA tests). In other words, contrary to our expectation, affective components may be closely correlated with product evaluations in the case of Hungary.
Table 5. Product Evaluations
Variable Canada Japan Sweden U.S. Hungary
Good overall products 5.3 4 6.3 1 5.8 2 5.4 3 4.5 5 I am satisfied with them 4.7 4 5.9 1 5.4 2 5.1 3 4.3 5 Good value for money 4.4 4 5.7 1 4.8 2 4.7 3 4.3 5
6
They have what I like to buy 3.9 5 5.4 1 4.4 3 4.7 2 4.2 4 They are for people like me 4.4 5 5.1 1 4.6 3 4.6 4 5.0 2 I would be proud to own them 4.5 5 5.1 1 4.7 3 4.5 4 5.1 2 I am willing to buy them 5.3 5 6.0 1 5.6 3 5.4 4 6.0 2
3. 3. Relationship between familiarity and product evaluation
Figure 1. Product-Country Image Model
The model in Figure 1 was drawn using constructs developed as part of a broader LISREL model, tested by Papadopoulos, Heslop, and Marshall (1988), which included additional dimensions for measuring product-country image effects and supported the beliefs to evaluation to buying intent paths. The constructs and the relationships between them were used for this paper only as a guide for preliminary testing of the relationship between familiarity and product beliefs, product evaluation, and intent to buy.
The potential relationships were tested with correlations (Table 6). The findings generally support the relationships between beliefs-evaluation and evaluation-buying intent, in line with the original LISREL model, with re latively high coefficients in most cases. The product moment correlations between familiarity and evaluation appear to be relatively weak but signify borderline medium- strength relationships in the social sciences research context.
All the significant associations were positive, that is, the more familiar respondents are with a country’s products, the more positively they evaluate them, suggesting that higher familiarity may be associated with lower quality expectations and/or increased perceived value of a country’s products. We further tested the associations using one-order partial correlation, to separately control for the effects of two dimensions that are related to both familiarity and
Buying Intent Product
Evaluation
Product Familiarity Product
Beliefs
evaluation. The results suggest that the associations may be spurious in the case of Sweden, and potentially Canada, and considerably weaker for the other three countries.
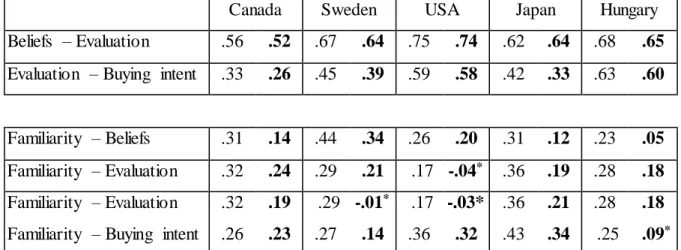
Table 6. Product Moment and One-order Partial Correlations
Canada Sweden USA Japan Hungary
Beliefs – Evaluation .56 .52 .67 .64 .75 .74 .62 .64 .68 .65 Evaluation – Buying intent .33 .26 .45 .39 .59 .58 .42 .33 .63 .60
Familiarity – Beliefs .31 .14 .44 .34 .26 .20 .31 .12 .23 .05 Familiarity – Evaluation .32 .24 .29 .21 .17 -.04* .36 .19 .28 .18 Familiarity – Evaluation .32 .19 .29 -.01* .17 -.03* .36 .21 .28 .18 Familiarity – Buying intent .26 .23 .27 .14 .36 .32 .43 .34 .25 .09* Coefficients: plain text – product moment correlations, bold – one-order partial correlations.
* These coefficients do not differ significantly from zero (p=0.05).
4. Conclusion
Some of these preliminary findings, drawn from our first exploration of the data, were in line with our expectations while others were not. Products from highly developed countries that are perceived to be more technologically advanced than others (e.g., Japan vs. Canada) were rated more highly, developed countries were generally evaluated more highly than Hungary, but affective components appear to mediate the evaluation of domestic goods by Hungarian respondents. The data from this new study support the beliefs-evaluation- intent paths of the earlier model, but the strength of the relationship between familiarity and product evaluation varies among countries, and in one case may be spurious, and the correlations between familiarity and beliefs, and familiarity and intent to buy, are not strong. These results may be influenced by the definitions of the relevant constructs, suggesting the need for further testing using factor and other analyses, and for comparisons between the Hungarian data with the findings from the other countries in the larger research study, in preparation for specifying and testing a model of origin effects.
Reference
Brisoux, J.E. and E.J. Cheron (1990), “Brand Categorization and Product Involvement”, Advances in Consumer Research, 17, 101-109.
8
Cordell, V.V. (1992), “Effects of Consumer Preferences for Foreign Sourced Products”, Journal of International Business Studies, 2, 251-269.
Erickson, G.M., J.K. Johansson, and P. Chao (1984), “Image Variables in Multi-attribute Product Evaluation: Country of Origin Effects”, Journal of Consumer Research, 11, 694-699.
Johansson, J.K. (1989), “Determinants and Effect of the Use of ‘Made in’ Labels”, International Marketing Review, 6, 47-58.
McWilliam, G. and E. Ayrosa (1996), “Involvement: An Integrating Framework for Country-of-Origin Research”, Marketing for an Expanded Europe, Proceedings of the European Marketing Academy (Budapest, May), 773-791.
Papadopoulos, N., L.A. Heslop, and J. Berács (1990), “National Stereotypes and Product Evaluations in a Socialist Country”, International Marketing Review, 7, 32-47.
Papadopoulos, N., J.J. Marshall, and L.A. Heslop (1988), "Strategic Implications of Product and Country Images: A Modelling Approach", in Marketing Productivity, Proceedings of the European Society for Opinion and Marketing Research (Lisbon, September), 69-90.