© 2018. Published by The Company of Biologists Ltd.
Mitochondrial cAMP exerts positive feedback on mitochondrial Ca
2+uptake via the recruitment of Epac
Gergő Szanda1,2*, Éva Wisniewski1, Anikó Rajki2, András Spät1,2*
1Department of Physiology, Semmelweis University Medical School, Budapest, Hungary and
2MTA-SE Laboratory of Molecular Physiology, Semmelweis University and Hungarian Academy of Sciences, Budapest, Hungary
*Corresponding authors: András Spät (spat.andras@med.semmelweis-univ.hu) and Gergő Szanda (szanda.gergo@med.semmelweis-univ.hu).
Summary statement
The Ca2+-dependent formation of intramitochondrial cAMP by the matrix soluble adenylyl cyclase intensifies further Ca2+ uptake into the organelle and this convergence of signalling pathways supports steroidogenesis.
Journal of Cell Science • Accepted manuscript
Abbreviations
2-OHE, 2-hydroxy-estradiol; 8CPT-Me-cAMP, 8-pCPT-2’-O-Me-cAMP; AII, angiotensin II;
[Ca2+]c, cytosolic [Ca2+]; [Ca2+]m, mitochondrial [Ca2+]; EHNA, erythro-9-(2-hydroxy-3- nonyl)adenine; FCCP, Carbonyl cyanide-4-(trifluoromethoxy)phenylhydrazone; H89, N-[2- [[3-(4-Bromophenyl)-2-propenyl]amino]ethyl]-5-isoquinolinesulfonamide; IBMX, 3- isobutyl-1-methylxanthine; IMM, inner mitochondrial membrane; IMS: intermembrane space; MCU, mitochondrial Ca2+ uniporter; mRFP, monomeric Red Fluorescent Protein; mt- cAMP, mitochondrial cAMP; mt-sAC, mitochondrial soluble adenylyl cyclase; NCLX, mitochondrial Na+/Ca2+ exchanger; PDE2, phosphodiesterase 2; PKA, protein kinase A; sAC, soluble adenylyl cyclase; t-sAC, truncated (48 kDa), active form of sAC; TMRM, tetramethyl rhodamin methylester; WT, wild type; ΔΨm, mitochondrial membrane potential
Abstract
We have previously demonstrated in H295R adrenocortical cells that the Ca2+-dependent production of intramitochondrial cAMP (mt-cAMP) by the matrix soluble adenylyl cyclase (sAC) is associated with enhanced aldosterone production. Now we examined whether mitochondrial sAC and mt-cAMP fine-tune mitochondrial Ca2+ metabolism to support steroidogenesis. Reduction of mt-cAMP formation resulted in decelerated mitochondrial Ca2+
accumulation in intact cells during K+-induced Ca2+ signalling and also in permeabilised cells exposed to elevated perimitochondrial [Ca2+]. Conversely, the membrane-permeable 8-Br- cAMP, inhibition of phosphodiesterase 2 and overexpression of sAC in the mitochondrial matrix all intensified Ca2+ uptake into the organelle. Identical mt-cAMP dependence of mitochondrial Ca2+ uptake was observed in HeLa cells as well. Importantly, the enhancing effect of mt-cAMP on Ca2+ uptake was independent from both the mitochondrial membrane potential and Ca2+ efflux but was reduced by Epac1 blockade both in intact and in permeabilised cells. Finally, overexpression of sAC in the mitochondrial matrix potentiated aldosterone production implying that the observed positive feedback mechanism of mt-cAMP on mitochondrial Ca2+ accumulation may have a role in the rapid initiation of steroidogenesis.
Keywords: mitochondria, cAMP, Ca2+ signal, soluble adenylyl cyclase, Epac, aldosterone
INTRODUCTION
Aldosterone, secreted by adrenal glomerulosa cells, is the principal regulator of salt-water balance. As such it plays a significant role in the control of blood pressure and participates in the pathogenesis of cardiovascular, inflammatory and renal diseases (Briet and Schiffrin, 2010; De Mello, 2017; Prabhu and Frangogiannis, 2016; Rossier et al., 2017; Zhang and Lerman, 2017). The most important physiological stimuli of aldosterone secretion are angiotensin II (AII) and extracellular K+, their actions are mediated chiefly by cytosolic Ca2+
signal (Hattangady et al., 2012; Spät and Hunyady, 2004). Cytosolic Ca2+, beside inducing and activating StAR, the steroidogenic acute regulatory protein that transports cholesterol to the inner mitochondrial membrane (IMM) (Cherradi et al., 1997), evokes mitochondrial Ca2+
signalling (Pitter et al., 2002; Spät and Pitter, 2004) resulting in enhanced reduction of pyridine nucleotides (Pralong et al., 1992; Rohács et al., 1997) and production of ATP (Tarasov et al., 2012). Moreover, the mitochondrial Ca2+ signal and NAD(P)H formation within mitochondria are essential for the hypersecretion of aldosterone (Spät et al., 2012;
Wiederkehr et al., 2011).
The soluble adenylyl cyclase (sAC, encoded by ADCY10), a cAMP generating enzyme activated by HCO3- (Chen et al., 2000; Lefkimmiatis et al., 2013; Steegborn et al., 2005b) and Ca2+ (Jaiswal and Conti, 2003), is present in the mitochondrial matrix (Acin-Perez et al., 2009b). Mitochondrial Ca2+ signals result in the enhanced formation of cAMP by sAC within the mitochondrial matrix of HeLa cells, rat cardiomyocytes (Di Benedetto et al., 2014; Di Benedetto et al., 2013) as well as of human adrenocortical H295R cells (Katona et al., 2015).
In addition to the increased formation of ATP (Acin-Perez et al., 2009b; Di Benedetto et al., 2013; Wang et al., 2016), mitochondrial cAMP (mt-cAMP) may have cell type specific roles as exemplified by the reduced aldosterone production in adrenocortical cells after the knock- down of sAC (Katona et al., 2015). Mitochondrial Ca2+ is one of the key regulators of aldosterone synthesis (Wiederkehr et al., 2011) and it also boosts pyridine nucleotide reduction which may also favour steroid production (Pralong et al., 1992; Spät et al., 2012).
Therefore in the present study we examined whether the hormone secretion promoting action of mt-cAMP reflects an effect on mitochondrial Ca2+ handling itself. We show that mt-cAMP enhances mitochondrial Ca2+ uptake and boosts subsequent hormonal response in H295R human adrenocortical cells. The effect of mt-cAMP on mitochondrial Ca2+ handling is not mediated by changes of the mitochondrial membrane potential (ΔΨm) or Ca2+ efflux but requires the cAMP-regulated guanine nucleotide exchange factor Epac1. Importantly, this
feedback mechanism was detected also in HeLa cells, showing that it is not confined to steroid producing cells.
RESULTS
Inhibition of mt-cAMP formation attenuates mitochondrial Ca2+ accumulation during Ca2+ signalling in intact H295R cells
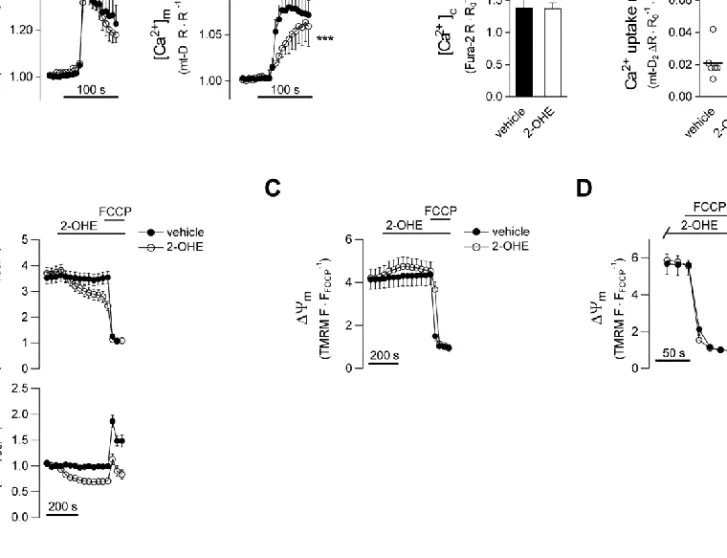
First we examined the effects of 2-OHE, a membrane permeable sAC inhibitor (Steegborn et al., 2005a), on Ca2+ signalling in AII-stimulated H295R cells. The drug significantly reduced mitochondrial Ca2+ uptake rate without a similar effect on the cytosolic response (Fig. S1A).
Further experiments, however, revealed that 2-OHE reduces the fluorescence of the membrane potential sensitive dye TMRM both in the mitochondria and the nuclei (Fig. S1B).
2-OHE failed to influence m in permeabilised cells (Fig. S1C,D) suggesting that the reduction of TMRM fluorescence in intact cells was due to plasma membrane depolarisation.
Nevertheless, we regarded the results obtained with 2-OHE in AII-stimulated intact cells inconclusive.
H295R cells produce voltage-dependent Ca2+ influx with ensuing mitochondrial Ca2+
signal when stimulated with K+ (Szanda et al., 2006). Knocking down sAC with a verified siRNA sequence (MR2 (Di Benedetto et al., 2013; Katona et al., 2015) and Fig. S2D) significantly reduced net mitochondrial Ca2+ uptake rate without any effect on cytosolic Ca2+
response in K+-stimulated cells (Fig. 1A,B). Importantly, knock-down of sAC slightly hyperpolarised mitochondria both under resting conditions and during Ca2+ signalling as compared to control cells (Fig. 1C). Since hyperpolarisation of the mitochondria would increase rather than decrease mitochondrial Ca2+ uptake rate, these findings strongly suggest that attenuating mt-cAMP formation impedes mitochondrial Ca2+ uptake in a ΔΨm
independent manner.
Manipulation of the mt-cAMP system in permeabilised cells influences mitochondrial Ca2+ accumulation independently of ΔΨm
With the aim of minimizing the effect of extramitochondrial factors, next we analysed the mt- cAMP dependence of mitochondrial Ca2+ uptake in permeabilised cells in which perimitochondrial [Ca2+] can be adjusted. 2-OHE was used to inhibit sAC and erythro-9-(2- hydoxy-3-nonyl)adenine (EHNA), a selective inhibitor of PDE2A (Acin-Perez et al., 2011) and as such an enhancer of mt-cAMP formation in H295R (Katona et al., 2015) and HeLa
cells (Di Benedetto et al., 2013), was applied to increase [mt-cAMP]. Ca2+ accumulation was significantly dampened by 2-OHE (Fig. 2A) and EHNA markedly accelerated the uptake (Fig. 2B). These observations were corroborated by the finding that the knock-down of sAC reduced mitochondrial Ca2+ uptake into the mitochondria of permeabilised H295R cells (Fig.
2C) and we observed a similar reduction of Ca2+ uptake in permeabilised sAC-silenced HeLa cells (Fig. 2D).
The sAC – Ca2+ interplay was further investigated by combining a cAMP analogue and sAC silencing. The membrane permeable cAMP analogue 8-Br-cAMP strongly intensified mitochondrial Ca2+ accumulation (Fig. 3A) without any measurable effect on ΔΨm (Fig. 3B) supporting the notion that mt-cAMP enhances mitochondrial Ca2+ accumulation independently of ΔΨm. Moreover, 8-Br-cAMP increased mitochondrial Ca2+ uptake to comparable levels in both the control and sAC silenced permeabilised H295R cells (Fig. 3C) implying that cAMP is the downstream effector of sAC.
Overexpression of sAC in the mitochondrial matrix accelerates mitochondrial Ca2+
uptake and intensifies aldosterone secretion
In order to study the effect of increased intramitochondrial cAMP formation on Ca2+
handling, we generated wild-type (WT) and enzymatically inactive, mitochondrially targeted versions of the sAC. H295R cells express the truncated (~48 kDa) form of sAC which localizes predominantly to the particulate fraction (Katona et al., 2015). Although the full- length sAC mRNA (NM_018417.5; 4832 bp CDS) could be found in these cells (Fig. S2A), for our mitochondria-targeted constructs we used the sequence of the physiologically occurring, enzymatically enhanced truncated version of sAC (Buck et al. 1999; Steegborn, 2014) (Figs. S2B, S3 and S4). Interestingly, two sAC isoforms were consistently amplified from H29R cells; one corresponding to the canonical sequence and the other lacking a short section (Δ215-276; Fig. S5A) from the C1-C2 region which links the two catalytic domains (Steegborn, 2014).
In order to obtain functionally compromised mutants, two amino acid changes were introduced (Fig. S2B). In the double mutant sAC the D99A mutation aims to eliminate Mg2+
binding and the N412A to abolish ribose binding (Steegborn, 2014). As expected, HeLa cells expressing double mutant mt-sAC exhibited significantly reduced mt-cAMP production during Ca2+ signalling or when stimulated with HCO3‒
, the direct activator of sAC (Chen et al.; Steegborn, 2014) (Fig. S2C).
If mt-cAMP intensifies mitochondrial Ca2+ uptake then one could expect a reduced Ca2+
accumulation when an enzymatically inactive sAC is overexpressed in mitochondria. This was indeed the case as the overexpression of the double mutant mt-sAC markedly reduced the rate of mitochondrial Ca2+ accumulation in both permeabilised H295R and HeLa cells as compared to the overexpression of the wild-type cyclase (Figs 4A,B). (We obtained identical results with the adrenocortical isoforms of sAC (Fig. S5B) strongly suggesting that the linker region is indeed dispensable for the enzymatic activity.) Moreover, the difference in Ca2+
uptake rate between WT and mutant sAC was preserved also in the presence of the NCLX blocker CGP-37157 (Fig. S6). In order to test the effect of mt-cAMP-dependent enhancement of Ca2+ uptake on the biological response of adrenocortical cells, that is steroid synthesis, we measured 2 h basal and AII-stimulated aldosterone production in cells transfected with WT or mutant mt-sAC (Fig. 4C). Cells expressing mutant mt-sAC exhibited blunted steroidogenesis (as compared to WT mt-sAC expressing counterparts) highlighting the contribution of mt- cAMP to the hormonal response.
The role of Epac-1 and protein kinase A in mediating mt-cAMP effect on Ca2+ uptake Next we studied the involvement of recognized cAMP effectors, protein kinase A (PKA) and the guanine nucleotide exchange factor Epac, in conveying the enhancing effect of mt-cAMP on Ca2+ uptake. ESI-09, a pan-Epac inhibitor (Almahariq et al., 2013) reduced mitochondrial Ca2+ uptake rate in permeabilised H295R cells (Fig. 5A). In view of data confirming (Zhu et al., 2015) or challenging the specificity of ESI-09 (Rehmann, 2013), we also examined the effect of the structurally unrelated Epac-1 inhibitor CE3F4 (Courilleau et al., 2012). This drug also decelerated mitochondrial Ca2+ uptake in permeabilised as well as in AII-stimulated intact H295R cells without affecting the cytosolic Ca2+ signal (Fig. 5B,C). Importantly, the conventional PKA inhibitor H-89 failed to affect Ca2+ uptake rate but decreased steady-state [Ca2+]m in permeabilised cells (Fig. 5B). And finally, the enhancing effect of mt-sAC overexpression on Ca2+ uptake was lost if Epac-1 was inhibited with CE3F4 (Fig. 5D) strongly suggesting that Epac is downstream of mt-sAC and mt-cAMP. Altogether, these data strongly suggest that Epac has an essential role in the control of initial Ca2+ uptake whereas PKA, acting with a longer lag-time, may contribute to maintaining elevated [Ca2+]m.
DISCUSSION
Calcium uptake into mitochondria occurs by diffusion through the voltage dependent anion channels (VDACs) in the outer mitochondrial membrane followed by the transport through the IMM by the Mitochondrial Ca2+ Uniporter (MCU) multiprotein complex, the structure of which has been recently elucidated (MCU: (Baughman et al., 2011; De Stefani et al., 2011), MCUb: (Raffaello et al., 2013), MICU1: (Perocchi et al., 2010), MICU2: (Plovanich et al., 2013), EMRE: (Sancak et al., 2013), for reviews see e.g. (De Stefani et al., 2016; Mammucari et al., 2016)). The transport is driven by the 150-180 mV (inside negative) mitochondrial membrane potential. The ensuing mitochondrial Ca2+ signal modulates such substantial mitochondrial processes as pyridine nucleotide reduction (McCormack et al., 1990), ATP synthesis (Jouaville et al., 1999), apoptosis (Hajnóczky et al., 2000) and even cell type specific functions including insulin and aldosterone production (Wiederkehr et al.). However, the short-term control of Ca2+ uptake under physiologically relevant conditions has remained elusive (De Stefani et al., 2016). In the present study we reveal a hitherto unrecognized mechanism of this control, specifically that mt-cAMP enhances mitochondrial Ca2+ uptake.
Ca2+ influx into the mitochondrial matrix activates mt-sAC which, in turn, produces mt- cAMP, a process first described in HeLa cells and cultured cardiac myocytes (Di Benedetto et al., 2013). In our previous study on H295R adrenocortical cells (Katona et al., 2015), we observed that the inhibition or the knockdown of sAC as well as the buffering of mitochondrial Ca2+ by the targeted expression of a Ca2+ binding protein (S100G) significantly reduced AII-elicited mt-cAMP signalling whereas the inhibition of mitochondrial PDE2A with EHNA (Acin-Perez et al., 2011) enhanced cAMP production within the organelle. The biological significance of mt-cAMP signalling was demonstrated by the reduced aldosterone production after the inhibition or knockdown of sAC. Since [Ca2+]m is one of the key factors regulating aldosterone secretion (Spät et al., 2012), in the present study we examined whether the secretagogue effect of mt-cAMP could be mediated by an action of this messenger on mitochondrial Ca2+ uptake itself. Moreover, we extended our study of mitochondrial Ca2+
handling to HeLa cells so as to assess whether the mt-cAMP – Ca2+ interplay is unique to endocrine cells or is a more general phenomenon.
Applying experimental approaches that manipulate mt-cAMP signalling we found that 1) knock-down of sAC resulted in decelerated mitochondrial Ca2+ uptake in intact H295R cells;
2) increasing the intramitochondrial cAMP activity by the inhibition of PDE2A, with the cAMP analogue 8-Br-cAMP or with the overexpression of mitochondrial sAC all accelerated Ca2+ uptake in permeabilised H295R and HeLa cells; 3) mt-cAMP dependent changes in mitochondrial Ca2+ uptake were not dependent on changes in ΔΨm or Ca2+ efflux; 4) the augmenting effect of mt-cAMP on mitochondrial Ca2+ accumulation was sensitive to the inhibition of the Rap-GEF Epac-1; 5) overexpressing WT sAC within mitochondria intensified aldosterone production as compared to the enzymatically compromised sAC mutant.
Knock-down of sAC decelerated mitochondrial Ca2+ accumulation during Ca2+ signalling in K+-stimulated intact H295R cells. Although sAC in H295R cells locates predominantly to the particulate fraction (Katona et al., 2015), by studying mitochondrial Ca2+ uptake in permeabilised cells one may minimize the influence of extramitochondrial factors (Bernardi et al., 1999) and cytosolic cAMP (and quite possibly cytosolic sAC) are also lost under such conditions. Importantly, data obtained in permeabilised cells confirmed the findings in intact cells as both inhibition and knock-down of sAC impeded Ca2+ uptake in H295R and HeLa cells. Moreover, overexpression of WT sAC in the mitochondrial matrix accelerated Ca2+
accumulation into the organelle in both cell types.
We found that H295R cells, besides the canonical sAC variant, also express an isoform lacking amino acids 215-276 within the linker region of the enzyme. This adrenocortical isoform had identical effects on mitochondrial Ca2+ uptake as the canonical 48-kD version, confirming the notion that the linker region is dispensable for enzymatic activity (Steegborn, 2014). (The deletion in this delta mutant respects exon-intron boundaries and thus the Δ215- 276 sAC isoform may probably be regarded as a naturally occurring variant.)
Theoretically, accelerated mitochondrial Ca2+ accumulation may reflect increased Ca2+
conductance via the MCU, inhibited Ca2+ efflux through NCLX, larger driving force and, naturally, the combination thereof. The maximal rate of mitochondrial Ca2+ uptake far exceeds that of Ca2+ efflux in H295R cells (A.S. and G.S., unpublished observation) rendering the Na+/Ca2+ exchanger (NCLX) an unlikely target of mt-cAMP. Nevertheless, the possibility that mt-cAMP inhibits NCLX, and thereby accelerates Ca2+ accumulation, had to be considered. The enhanced Ca2+ uptake in sAC-overexpressing cells was preserved in the presence of CGP-37157, a conventional inhibitor of NCLX. As to the driving force, the membrane-permeable cAMP analogue 8-Br-cAMP increased mitochondrial Ca2+ uptake rate
but failed to influence ΔΨm. Moreover, knock-down of sAC slightly hyperpolarized mitochondria yet it reduced the rate of Ca2+ accumulation. Altogether, changes in ΔΨm or Ca2+ efflux are not required for the mt-cAMP dependent modulation of mitochondrial Ca2+
handling.
Apart from cyclic nucleotide-activated cation channels of the plasma membrane two downstream signalling pathways of cyclic AMP are generally accepted: activation of protein kinase A and of the Rap1 exchange factor Epac (Seino and Shibasaki, 2005). The location of PKA within the mitochondrial matrix is not sufficiently elucidated. Due to binding of PKA to several anchoring proteins in the OMM and possibly also to the outer surface of the IMM (see (Di Benedetto et al., 2013; Lefkimmiatis et al., 2013)), data on the exact location of PKA in the „inner” mitochondria (Sardanelli et al., 2006; Schwoch et al., 1990) are not conclusive and reports on the location of PKA within the matrix are also conflicting (Acin-Perez et al., 2011; Monterisi et al., 2017). There is also no agreement whether PKA activates the electron transport chain and ATP production (Acin-Perez et al., 2009a; Di Benedetto et al., 2013;
Lefkimmiatis et al., 2013). In our present study, the conventional PKA inhibitor H89 failed to exert a significant effect on initial mitochondrial Ca2+ uptake. Nevertheless, with some delay H89 decreased steady-state [Ca2+]m. The real biological significance of this latter effect warrants further studies but the reported side-effects of H89 should also be kept in mind (Lochner and Moolman, 2006).
Besides PKA, the cAMP-activated guanylyl nucleotide exchange factors Epac1 and 2 are possible mediators of the mt-cAMP effect on mitochondrial Ca2+ uptake. The presence of Epac1 in mitochondria (Qiao et al., 2002), in mitoplasts (Wang et al., 2016), in the IMM and also in the matrix (Fazal et al., 2017) has already been documented and an N-terminal mitochondrial target sequence on Epac1 has been identified (Fazal et al., 2017). As to the role of Epac on mitochondrial Ca2+ metabolism, we are aware of two reports on myocardial cells.
However, the data are conflicting inasmuch as those of Wang and co-workers (Wang et al., 2016) indicate an inhibitory whereas those of Fazal et al. (Fazal et al., 2017) show a stimulatory effect for Epac. It should be emphasized that non-physiological conditions were applied in these experiments: mitochondria were isolated from hypertrophic rat hearts (Wang et al., 2016) and mitochondrial Ca2+ accumulation in murine cardiac cells was observed in the presence of supraphysiological (50 M) extramitochondrial Ca2+ (without data on uptake rate) (Fazal et al., 2017). In our experiments a pan-Epac inhibitor or a specific Epac1 inhibitor reduced mitochondrial Ca2+ accumulation in intact H295R and also in permeabilised
H295R and HeLa cells. Moreover, the overexpression of mt-sAC failed to accelerate the mitochondrial Ca2+ response in the presence of Epac inhibitors indicating that this Rap-GEF is the downstream effector of mt-cAMP in this respect. Taken together, whereas the data on cardiac cells (Fazal et al., 2017; Wang et al., 2016) contribute to our knowledge on Epac- dependent cell death, our experiments show that intramitochondrial cAMP and Epac signalling support mitochondrial Ca2+ accumulation also at physiological Ca2+
concentrations.
Only few data are available about the role of Epac in the adrenal cortex. The report that only about 60 % of the cAMP-mediated effects of ACTH on transcription were dependent on PKA in Y1 mouse adrenal cells (Schimmer et al., 2006) gave rise to the idea that the PKA- independent actions were mediated by Epac (Lewis et al., 2016). In murine Y1 cells the expression of Epac2 could be detected with immunocytochemistry, yet the cell-permeable Epac activator 8-pCPT-2’-O-Me-cAMP failed to simulate the effect of cAMP either on the expression of steroidogenic factors or on 24-hr steroid secretion (Aumo et al., 2010). In bovine glomerulosa cells both 8-pCPT-2’-O-Me-cAMP and AII activated the Epac substrate Rap1 but neither of them stimulated 1-hour aldosterone production (Gambaryan et al., 2006).
Considering that 8-pCPT-2’-O-Me-cAMP is not PDE-resistant (Laxman et al., 2006), its breakdown during cell incubation cannot be ruled out. Due to well-known species differences in the control of aldosterone secretion (Spät and Hunyady, 2004; Spät et al., 2016) these data should not be extrapolated to human cells. Indeed, our findings that knock-down of sAC inhibits (Katona et al., 2015) whereas overexpression of mt-sAC augments aldosterone production, together with the observation that mt-sAC fails to affect mitochondrial Ca2+
uptake in the presence of Epac inhibitors, strongly suggest that intramitochondrial Epac is involved in the regulation of the steroidogenic response in the human adrenal cortex.
CONCLUSION
The combination of work described here and in past studies (Katona et al., 2015) reveals a positive feedback loop controlling mitochondrial Ca2+ handling: Ca2+ triggers the formation of mt-cAMP which, in turn, recruits Epac and enhances Ca2+ uptake (Fig. 6). This positive feedback is a new example for the convergence of Ca2+ and cAMP signalling (Spät et al., 2016). Although excessive function of this system may lead to cell death, it may also have great significance in situations of emergency, especially when rapid cellular response is required. Changes in basal mt-cAMP metabolism modified mitochondrial Ca2+ uptake rate without detectable delay suggesting that even basal mt-sAC activity has a role in triggering the biological response. In case of glomerulosa cells it may be assumed that during severe salt-water loss (e.g. haemorrhage, diarrhoea, strenuous physical exercise in hot environment) aldosterone secretion is triggered by the simultaneous actions of AII and corticotrophin (Spät and Hunyady, 2004) and is enhanced by the here described Ca2+ ‒ mt-cAMP ‒ Ca2+ positive feedback system. In addition, given that mt-cAMP enhances mitochondrial Ca2+ uptake in HeLa cells as well, the present observations may be of broader cell physiological significance.
MATERIALS AND METHODS Materials
OPTI-MEM, Lipofectamine LTX, RNAiMax, Fluo-4 AM, Rhod-2 AM, tetramethyl rhodamine methylester (TMRM) and Mitotracker Deep Red as well as the BCA assay kit were purchased from Invitrogen (Thermo Fisher Scientific, Waltham, MA), Fura-2 AM from Tocris (Elliswille, MO), Ultra-MEM from Lonza (Basle, Switzerland). UltroSer G was from Bio-Sepra (Cergy-Saint-Christophe, France). siRNA for silencing sAC (MR2, (Di Benedetto et al., 2013)) and Control siRNA (Universal Negative Control, SIC001) were obtained from Sigma-Aldrich (St. Louis, MO, USA). 4mt-H30 was constructed by G. Di Benedetto and T.
Pozzan, as described (Cano Abad et al., 2013). Mt-inverse Pericam was gifted by Prof. A.
Miyawaki (Saitama, Japan). 4mt-D2 was prepared as described (Fülöp et al., 2011). CE3F4 and 8-Br-cAMP was obtained from Cayman (Ann Arobor, MI), other chemicals were obtained from Sigma-Aldrich.
Cell culture and transfection
H295R and HeLa cells were cultured as previously described (Fülöp et al., 2011). Briefly, H295R cells (CRL-2128, ATCC, Manassas, VA) were cultured in DMEM/Ham’s F12 (1:1 v/v) completed with 1% ITS+, 2% UltroSer G, 100 U ml-1 penicillin and 100 µg ml-1 streptomycin. HeLa cells (CLL-2, ATCC) were grown in DMEM containing 10% heat- inactivated FBS, 100 U ml-1 penicillin and 100 µg ml-1 streptomycin. Passages numbered 3- 20 were used. Before experiments, H295R cells were serum-starved overnight (14-16 h) and HeLa cells for 3-5 h. Incubation conditions for aldosterone experiments are described below.
Cells (2.5-5x10⁴ H295R or 2-5x10⁴ HeLa cells) were plated onto 25-mm diameter circular glass coverslips on day 1 and transfected on day 2 with plasmid DNA (0.5 μg/coverslip but HeLa cells were transfected with 1 μg/coverslip 4-mt-H30 DNA) using Lipofectamine LTX (H295R) or Fugene HD (HeLa) according to the manufacturer’s protocol. For silencing sAC, on day 2, cells were transfected with 50 pmol MR2 siRNA or control RNA in Ultra-MEM using lipofectamine RNAiMax. If H295R cells were co-transfected with plasmid DNA and siRNA, RNAiMax was used as reagent. Experiments were conducted on day 4 or, in case of mt-cAMP measurements, on day 5.
RNA isolation, cDNA preparation and qPCR
RNA isolation and cDNA synthesis were performed as described (Ella et al., 2016). For the determination of GAPDH expression by quantitative real-time PCR (qPCR) the LightCycler 480 system (Roche) with the FastStart DNA Master SYBR Green (Roche) was used. Primers:
forward: 5’– AAGGTGAAGGTCGGAGTCAACG –3’; reverse: 5’–
GACGGTGCCATGGAATTTGC –3’.
Confocal microscopy
A Zeiss LSM710 confocal laser scanning microscope (operated with ZEN 11.0 software) and a 40*/1.3 water immersion objective (Plan-Apochromat, Zeiss) were used. For monitoring cytosolic and mitochondrial Ca2+ signals, the cells were preloaded with Fluo-4 and Rhod-2 or transfected with mitochondria targeted inverse Pericam (mt-i-Pericam), as specified in the figure legends. Fluorescence was monitored in multitrack mode while excitation and emission detection wavelengths were set as described previously (Fülöp et al., 2011; Katona et al., 2015). The optical slice was 5 m in the cytosolic and 3 m in the mitochondrial
channels but the latter was 1.5 m in the colocalisation studies (Fig. S2 and S3). In kinetic studies fluorescence intensity was normalized to the average 20-60-s intensity measured before stimulation (FO). The linear section of the normalized Ca2+ curves was regarded as rate of Ca2+ uptake. Uptake rate was expressed as (F/F0)/t for Rhod-2 or (F0/ F)/t in case of mt-i-Pericam.
For the measurement of mitochondrial membrane potential (ΔΨm), TMRM was used.
TMRM (15-25 nM) was present throughout the entire experiment including drug pre- incubation periods. At the end of each run, ΔΨm was dissipated with 10 μM FCCP + 8 μg ml-
1 oligomycin and TMRM fluorescence was normalized to that measured after FCCP + oligomycin addition (FFCCP). Excitation and emission were achieved as described previously (Fülöp et al., 2011).
Measurements with fluorescent wide-field microscopy
An inverted microscope (Axio Observer D1, Zeiss) equipped with a 40x1.4 Plan-Apochromat oil immersion objective (Zeiss) and a Cascade II camera (Photometrics) were used for epifluorescence measurements. Mitochondrial [Ca2+] ([Ca2+]m) and cytosolic [Ca2+] ([Ca2+]c) in intact cells were monitored using 4mt-D2-cpV (4mt-D2) and Fura-2, resp., and [Ca2+]m in permeabilised cells with mt-i-Pericam. Mitochondrial Ca2+ uptake rate was calculated as described previously (Fülöp et al., 2011). cAMP level in the mitochondrial matrix was monitored by means of fluorescence resonance energy transfer (FRET), using 4mt-H30 as described earlier (Katona et al., 2015).
Superfusion
Microscopic experiments were carried out at room temperature. For kinetic studies in intact cells the coverslips were superfused with a modified Krebs-Ringer solution containing 140 mM Na+, 4.5 mM K+, 1.2 mM Ca2+, 0.5 mM Mg2+, 5 mM Hepes and 2 mM HCO3 (pH 7.4).
Cells were permeabilised with 25 μg ml-1 digitonin in Ca2+-free cytosol-like medium (see below) for 6 minutes. For superfusion of permeabilised cells a pH 7.1 cytosol-like solution was used containing 129 mM K+, 10 mM Na+, 1.13 mM Mg2+, 120 mM HEPES, 2 mM EGTA, 2 mM ADP, 2 mM pyruvate and 2 mM malate (for H295R) or succinate (for HeLa).
To adjust the [Ca2+] and [Mg2+] of the cytosol-like media, EGTA, HEDTA, Ca2+ and Mg2+
were added as calculated by the chelator software (Fabiato, 1988). The flow rate of
superfusions was ~ 1 ml·min-1. The solutions were applied with a solenoid valve-equipped, gravity-driven superfusion system, terminating at ~2 mm from the selected cells!
Aldosterone measurements
Cells were transfected with the appropriate sAC constructs by means of electroporation (2x10⁶ cells in 100 μl resuspension buffer, 1600 V 20 ms; Neon Transfection System, Thermo Fisher Scientific) and plated onto 24-well plates (5x10⁵ cells/well) on day one.
Following incubation in the complete medium (Section Cell culture and transfection), on day 3 the medium was changed to one with 0.1% UltroSer G content for overnight incubation. On day 4, after a 30-min preincubation in serum-free medium (supplemented with 0.01% BSA) the cells were incubated at 37oC for 2 hours in a similar medium, with or without angiotensin II. Aldosterone content of the supernatant and cellular protein amount were determined with DERCW100 RIA kit (Demeditec (Kiel, Germany)) and BCA assay (Thermo Fisher Scientific, Waltham, MA), respectively.
DNA constructs
To create the 5mt-sAC-mRFP constructs, the truncated version of soluble adenylate cyclase (t-sAC, 1-469 amino acids) was amplified from serum deprived human adrenocortical H295R cell cDNA. The following primers were used: forward, 5’ –
ATATGTCGACGATGAACACTCCAAAAGAAGAATTCC – 3’; reverse, 5’–
ATATACCGGTCCTGCTCCGACTTTCTCAGTACGGCCC – 3’. PCR products were digested and cloned into the pmRFP-N1 vector at SalI and AgeI sites. Five consecutive mitochondrial target signals of the human cytochrome c oxidase VIII (5mt) were subcloned at the N-terminal end of sAC. V5- and His-tagged constructs were generated by amplifying the 5mt-sAC section from the above plasmid and cloning into the pcDNA3.1/V5-His TOPO vector (Thermo Fisher Scientific, Waltham, MA USA). Amino acid changes (D99A, N412A) were introduced by site-directed mutagenesis using the following primers: sAC_D99A forward: 5’ – GCAGGTGCTGCACTGCTAGCC – 3’; sAC_D99A reverse 5’ – GCAGTGCAGCACCTGCAAATTTCAGG – 3’; sAC_N412A forward 5’ – GTCGCCTTAGCTGCCAGGATGATGATGTACTACC -3’; sAC_N412A reverse 5’ – GGCAGCTAAGGCGACTTTTTGACCAATGACTG – 3’. Every construct was verified by sequencing (Microsynth, Balgach, Switzerland).
STATISTICS
Means + s.e.m. are shown unless otherwise specified. In some experiments, in cases of high impact outliers, minimal and maximal values have been uniformly excluded in all groups (trimmed mean). In some cases, for better visibility, mean + or ‒ s.e.m. are shown and in microscopic experiments with 1Hz < acquisition frequency, only every 2nd or 3rd data points are marked by actual symbols. For estimating significance of differences, Student’s unpaired t-test, Mann-Whitney and Kolmogorov-Smirnov test, one and two-way ANOVA and post- hoc tests were used, as appropriate. Data were analysed with Statistica 13, Microsoft Excel 2016 and with GraphPad Prism 5 software.
Acknowledgements
We gratefully acknowledge the valuable discussions with Professors Erzsébet Ligeti, László Tretter and Miklós Geiszt; the excellent technical help of Miss Ágnes Südy and Miss Laura Szalai in the qPCR measurements is highly appreciated.
Competing interests
No competing interests declared.
Author contribution
A.S. and G.S. conceived, designed, performed and evaluated the experiments and wrote the manuscript; G.S. and É.W. performed the molecular biological works; A.R. performed cell culture and chemical works.
Funding
This work was supported by the following grants: National Research, Development and Innovation Office grant (NKFI-6/FK_124038); Hungarian Scientific Research Fund grants (108382 and K116954). The work was also funded by the Hungarian Academy of Sciences.
G. Szanda was supported by the János Bólyai Research Scholarship of the Hungarian Academy of Sciences.
Reference List
Acin-Perez, R., Russwurm, M., Gunnewig, K., Gertz, M., Zoidl, G., Ramos, L., Buck, J., Levin, L. R., Rassow, J., Manfredi, G. et al. (2011). A phosphodiesterase 2A isoform localized to mitochondria regulates respiration. J Biol Chem 286, 30423-30432.
Acin-Perez, R., Salazar, E., Brosel, S., Yang, H., Schon, E. A. and Manfredi, G. (2009a). Modulation of mitochondrial protein phosphorylation by soluble adenylyl cyclase ameliorates cytochrome oxidase defects. EMBO Mol. Med 1, 392-406.
Acin-Perez, R., Salazar, E., Kamenetsky, M., Buck, J., Levin, L. R. and Manfredi, G. (2009b). Cyclic AMP produced inside mitochondria regulates oxidative phosphorylation. Cell Metab 9, 265-276.
Almahariq, M., Tsalkova, T., Mei, F. C., Chen, H., Zhou, J., Sastry, S. K., Schwede, F. and Cheng, X.
(2013). A novel EPAC-specific inhibitor suppresses pancreatic cancer cell migration and invasion. Mol Pharmacol 83, 122-8.
Aumo, L., Rusten, M., Mellgren, G., Bakke, M. and Lewis, A. E. (2010). Functional roles of protein kinase A (PKA) and exchange protein directly activated by 3',5'-cyclic adenosine 5'-monophosphate (cAMP) 2 (EPAC2) in cAMP-mediated actions in adrenocortical cells. Endocrinology 151, 2151-61.
Baughman, J. M., Perocchi, F., Girgis, H. S., Plovanich, M., Belcher-Timme, C. A., Sancak, Y., Bao, X.
R., Strittmatter, L., Goldberger, O., Bogorad, R. L. et al. (2011). Integrative genomics identifies MCU as an essential component of the mitochondrial calcium uniporter. Nature 476, 341-345.
Bernardi, P., Scorrano, L., Colonna, R., Petronilli, V. and Di Lisa, F. (1999). Mitochondria and cell death. Mechanistic aspects and methodological issues [published erratum appears in Eur J Biochem 1999 Oct;265(2):847]. European Journal of Biochemistry 264, 687-701.
Briet, M. and Schiffrin, E. L. (2010). Aldosterone: effects on the kidney and cardiovascular system.
Nat. Rev. Nephrol 6, 261-273.
Buck, J., Sinclair, M. L., Schapal, L., Cann, M. J. and Levin, L. R. (1999). Cytosolic adenylyl cyclase defines a unique signaling molecule in mammals. Proc. Natl. Acad. Sci U. S. A 96, 79-84.
Chen, Y., Cann, M. J., Litvin, T. N., Iourgenko, V., Sinclair, M. L., Levin, L. R. and Buck, J. (2000).
Soluble adenylyl cyclase as an evolutionarily conserved bicarbonate sensor. Science 289, 625-628.
Cherradi, N., Rossier, M. F., Vallotton, M. B., Timberg, R., Friedberg, I., Orly, J., Wang, X. J., Stocco, D. M. and Capponi, A. M. (1997). Submitochondrial distribution of three key steroidogenic proteins (steroidogenic acute regulatory protein and cytochrome p450scc and 3á-hydroxysteroid
dehydrogenase isomerase enzymes) upon stimulation by intracellular calcium in adrenal glomerulosa cells. Journal of Biological Chemistry 272, 7899-7907.
Courilleau, D., Bisserier, M., Jullian, J. C., Lucas, A., Bouyssou, P., Fischmeister, R., Blondeau, J. P.
and Lezoualc'h, F. (2012). Identification of a tetrahydroquinoline analog as a pharmacological inhibitor of the cAMP-binding protein Epac. J Biol Chem 287, 44192-202.
De Mello, W. C. (2017). Local Renin Angiotensin Aldosterone Systems and Cardiovascular Diseases.
Med Clin North Am 101, 117-127.
De Stefani, D., Raffaello, A., Teardo, E., Szabo, I. and Rizzuto, R. (2011). A forty-kilodalton protein of the inner membrane is the mitochondrial calcium uniporter. Nature 476, 336-340.
De Stefani, D., Rizzuto, R. and Pozzan, T. (2016). Enjoy the Trip: Calcium in Mitochondria Back and Forth. Annu Rev Biochem 85, 161-92.
Di Benedetto, G., Pendin, D., Greotti, E., Pizzo, P. and Pozzan, T. (2014). Ca2+ and cAMP cross-talk in mitochondria. J. Physiol 592, 305-312.
Di Benedetto, G., Scalzotto, E., Mongillo, M. and Pozzan, T. (2013). Mitochondrial Ca2+ Uptake Induces Cyclic AMP Generation in the Matrix and Modulates Organelle ATP Levels. Cell Metab 17, 965-975.
Ella, K., Csepanyi-Komi, R. and Kaldi, K. (2016). Circadian regulation of human peripheral neutrophils. Brain Behav Immun 57, 209-21.
Fabiato, A. (1988). Computer programs for calculating total from specified free or free from specified total ionic concentrations in aqueous solutions containing multiple metals and ligands.
Methods Enzymol 157, 378-417.
Fazal, L., Laudette, M., Paula-Gomes, S., Pons, S., Conte, C., Tortosa, F., Sicard, P., Sainte-Marie, Y., Bisserier, M., Lairez, O. et al. (2017). Multifunctional Mitochondrial Epac1 Controls Myocardial Cell Death. Circ Res 120, 645-657.
Fülöp, L., Szanda, G., Enyedi, B., Várnai, P. and Spät, A. (2011). The effect of OPA1 on mitochondrial Ca2+ signaling. PLoS. One 6, e25199.
Gambaryan, S., Butt, E., Tas, P., Smolenski, A., Allolio, B. and Walter, U. (2006). Regulation of aldosterone production from zona glomerulosa cells by ANG II and cAMP: evidence for PKA- independent activation of CaMK by cAMP. Am J Physiol Endocrinol Metab 290, E423-E433.
Hajnóczky, G., Csord s, G., Madesh, M. and Pacher, P. (2000). Control of apoptosis by IP(3) and ryanodine receptor driven calcium signals. Cell Calcium 28, 349-363.
Hattangady, N. G., Olala, L. O., Bollag, W. B. and Rainey, W. E. (2012). Acute and chronic regulation of aldosterone production. Mol. Cell Endocrinol 350, 151-162.
Jaiswal, B. S. and Conti, M. (2003). Calcium regulation of the soluble adenylyl cyclase expressed in mammalian spermatozoa. Proc. Natl. Acad. Sci U. S. A 100, 10676-10681.
Jouaville, L. S., Pinton, P., Bastianutto, C., Rutter, G. A. and Rizzuto, R. (1999). Regulation of mitochondrial ATP synthesis by calcium: Evidence for a long-term metabolic priming. Proceedings of the National Academy of Sciences of the United States of America 96, 13807-13812.
Katona, D., Rajki, A., Di, B. G., Pozzan, T. and Spät, A. (2015). Calcium-dependent mitochondrial cAMP production enhances aldosterone secretion. Mol. Cell Endocrinol 412, 196-204.
Laxman, S., Riechers, A., Sadilek, M., Schwede, F. and Beavo, J. A. (2006). Hydrolysis products of cAMP analogs cause transformation of Trypanosoma brucei from slender to stumpy-like forms. Proc Natl Acad Sci U S A 103, 19194-9.
Lefkimmiatis, K., Leronni, D. and Hofer, A. M. (2013). The inner and outer compartments of mitochondria are sites of distinct cAMP/PKA signaling dynamics. J Cell Biol 202, 453-462.
Lewis, A. E., Aesoy, R. and Bakke, M. (2016). Role of EPAC in cAMP-Mediated Actions in Adrenocortical Cells. Front Endocrinol (Lausanne) 7, 63.
Lochner, A. and Moolman, J. A. (2006). The many faces of H89: a review. Cardiovasc Drug Rev 24, 261-74.
Mammucari, C., Raffaello, A., Reane, D. V. and Rizzuto, R. (2016). Molecular structure and pathophysiological roles of the Mitochondrial Calcium Uniporter. Biochim. Biophys. Acta.
McCormack, J. G., Halestrap, A. P. and Denton, R. M. (1990). Role of calcium ions in regulation of mammalian intramitochondrial metabolism. Physiological Reviews 70, 391-425.
Monterisi, S., Lobo, M. J., Livie, C., Castle, J. C., Weinberger, M., Baillie, G., Surdo, N. C., Musheshe, N., Stangherlin, A., Gottlieb, E. et al. (2017). PDE2A2 regulates mitochondria morphology and apoptotic cell death via local modulation of cAMP/PKA signalling. Elife 6.
Perocchi, F., Gohil, V. M., Girgis, H. S., Bao, X. R., McCombs, J. E., Palmer, A. E. and Mootha, V. K.
(2010). MICU1 encodes a mitochondrial EF hand protein required for Ca2+ uptake. Nature 467, 291- 296.
Pitter, J. G., Maechler, P., Wollheim, C. B. and Spät, A. (2002). Mitochondria respond to Ca2+ already in the submicromolar range: correlation with redox state. Cell Calcium 31, 97-104.
Plovanich, M., Bogorad, R. L., Sancak, Y., Kamer, K. J., Strittmatter, L., Li, A. A., Girgis, H. S., Kuchimanchi, S., De, G. J., Speciner, L. et al. (2013). MICU2, a Paralog of MICU1, Resides within the Mitochondrial Uniporter Complex to Regulate Calcium Handling. PLoS One 8, e55785.
Prabhu, S. D. and Frangogiannis, N. G. (2016). The Biological Basis for Cardiac Repair After Myocardial Infarction: From Inflammation to Fibrosis. Circ Res 119, 91-112.
Pralong, W. F., Hunyady, L., Várnai, P., Wollheim, C. B. and Spät, A. (1992). Pyridine nucleotide redox state parallels production of aldosterone in potassium-stimulated adrenal glomerulosa cells.
Proceedings of the National Academy of Sciences of the United States of America 89, 132-136.
Qiao, J., Mei, F. C., Popov, V. L., Vergara, L. A. and Cheng, X. (2002). Cell cycle-dependent subcellular localization of exchange factor directly activated by cAMP. J Biol Chem 277, 26581-6.
Raffaello, A., De, S. D., Sabbadin, D., Teardo, E., Merli, G., Picard, A., Checchetto, V., Moro, S., Szabo, I. and Rizzuto, R. (2013). The mitochondrial calcium uniporter is a multimer that can include a dominant-negative pore-forming subunit. EMBO J 32, 2362-2376.
Rehmann, H. (2013). Epac-inhibitors: facts and artefacts. Sci Rep 3, 3032.
Rohács, T., Nagy, G. and Spät, A. (1997). Cytoplasmic Ca2+ signalling and reduction of mitochondrial pyridine nucleotides in adrenal glomerulosa cells in response to K+, angiotensin II and vasopressin.
Biochem. J 322, 785-792.
Rossier, B. C., Bochud, M. and Devuyst, O. (2017). The Hypertension Pandemic: An Evolutionary Perspective. Physiology (Bethesda) 32, 112-125.
Sancak, Y., Markhard, A. L., Kitami, T., Kovacs-Bogdan, E., Kamer, K. J., Udeshi, N. D., Carr, S. A., Chaudhuri, D., Clapham, D. E., Li, A. A. et al. (2013). EMRE is an Essential Component of the Mitochondrial Calcium Uniporter Complex. Science.
Sardanelli, A. M., Signorile, A., Nuzzi, R., Rasmo, D. D., Technikova-Dobrova, Z., Drahota, Z., Occhiello, A., Pica, A. and Papa, S. (2006). Occurrence of A-kinase anchor protein and associated cAMP-dependent protein kinase in the inner compartment of mammalian mitochondria. FEBS Lett 580, 5690-5696.
Schimmer, B. P., Cordova, M., Cheng, H., Tsao, A., Goryachev, A. B., Schimmer, A. D. and Morris, Q.
(2006). Global profiles of gene expression induced by adrenocorticotropin in Y1 mouse adrenal cells.
Endocrinology 147, 2357-67.
Schwoch, G., Trinczek, B. and Bode, C. (1990). Localization of catalytic and regulatory subunits of cyclic AMP-dependent protein kinases in mitochondria from various rat tissues. Biochem J 270, 181- 188.
Seino, S. and Shibasaki, T. (2005). PKA-dependent and PKA-independent pathways for cAMP- regulated exocytosis. Physiol Rev 85, 1303-42.
Spät, A., Fülöp, L. and Szanda, G. (2012). The role of mitochondrial Ca2+ and NAD(P)H in the control of aldosterone secretion. Cell Calcium 52, 64-72.
Spät, A. and Hunyady, L. (2004). Control of aldosterone secretion: a model for convergence in cellular signaling pathways. Physiological Reviews 84, 489-539.
Spät, A., Hunyady, L. and Szanda, G. (2016). Signaling Interactions in the Adrenal Cortex. Front Endocrinol. (Lausanne) 7, 17.
Spät, A. and Pitter, J. G. (2004). The effect of cytoplasmic Ca2+ signal on the redox state of mitochondrial pyridine nucleotides. Molec. cell. Endocrin 215, 115-118.
Steegborn, C. (2014). Structure, mechanism, and regulation of soluble adenylyl cyclases - similarities and differences to transmembrane adenylyl cyclases. Biochim Biophys Acta 1842, 2535-47.
Steegborn, C., Litvin, T. N., Hess, K. C., Capper, A. B., Taussig, R., Buck, J., Levin, L. R. and Wu, H.
(2005a). A novel mechanism for adenylyl cyclase inhibition from the crystal structure of its complex with catechol estrogen. J Biol Chem 280, 31754-31759.
Steegborn, C., Litvin, T. N., Levin, L. R., Buck, J. and Wu, H. (2005b). Bicarbonate activation of adenylyl cyclase via promotion of catalytic active site closure and metal recruitment. Nat. Struct.
Mol. Biol 12, 32-37.
Szanda, G., Koncz, P., Várnai, P. and Spät, A. (2006). Mitochondrial Ca2+ uptake with and without the formation of high-Ca2+ microdomains. Cell Calcium 40, 527-538.
Tarasov, A. I., Griffiths, E. J. and Rutter, G. A. (2012). Regulation of ATP production by mitochondrial Ca(2+). Cell Calcium 52, 28-35.
Wang, Z., Liu, D., Varin, A., Nicolas, V., Courilleau, D., Mateo, P., Caubere, C., Rouet, P., Gomez, A.
M., Vandecasteele, G. et al. (2016). A cardiac mitochondrial cAMP signaling pathway regulates calcium accumulation, permeability transition and cell death. Cell Death Dis 7, e2198.
Wiederkehr, A., Szanda, G., Akhmedov, D., Mataki, C., Heizmann, C. W., Schoonjans, K., Pozzan, T., Spät, A. and Wollheim, C. B. (2011). Mitochondrial matrix calcium is an activating signal for
hormone secretion. Cell Metab 13, 601-611.
Zhang, X. and Lerman, L. O. (2017). The metabolic syndrome and chronic kidney disease. Transl Res 183, 14-25.
Zhu, Y., Chen, H., Boulton, S., Mei, F., Ye, N., Melacini, G., Zhou, J. and Cheng, X. (2015).
Biochemical and pharmacological characterizations of ESI-09 based EPAC inhibitors: defining the ESI- 09 "therapeutic window". Sci Rep 5, 9344.
Figures
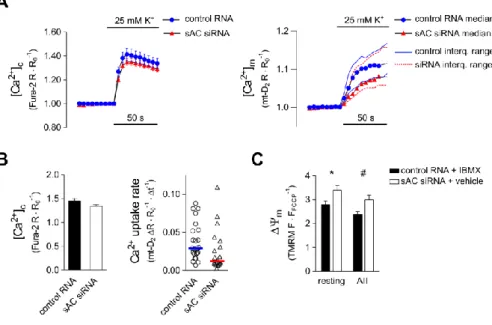
Figure 1. K+-evoked cytosolic and mitochondrial Ca2+ signals in sAC silenced H295R cells
(A) [Ca2+]c and [Ca2+]m in K+-stimulated control (blue circles) and sAC siRNA transfected cells (red triangles). Cells were transfected with the mitochondria-targeted ratiometric probe 4mt-D2-cpV (mt-D2) and with siRNA against sAC or control RNA (non-silencing dsRNA) and loaded with Fura-2 AM (100 or 500 nM) for 30 min. Fura-2 ([Ca2+]c) and mt-D2
([Ca2+]m) ratios (R) were normalized to baseline values (RO). Following a control superfusion period, the cells were stimulated with 25 mM K+. Mitochondrial Ca2+ uptake rate displayed non-Gaussian distribution and, accordingly, the mean and median of [Ca2+]m considerably deviated from one another (not shown). Therefore, right panel shows median values with interquartile range. For statistics see Panel B. (B) Statistical analysis of K+-evoked peak cytosolic Ca2+ signals (left) and mitochondrial Ca2+ uptake rates (right). Right graph shows individual data points and median value (horizontal lines); n = 24 and 20 for control and sAC siRNA treated cells, resp. *p = 0.028 (Kolmogorov-Smirnov test). (C) Mitochondrial membrane potential (ΔΨm) under resting conditions or Ca2+ signalling in cells with different mt-cAMP status. Control cells (elevated [mt-cAMP]) were transfected with non-silencing dsRNA and were exposed to the PDE inhibitor IBMX (100 μM, 30 min) whereas cells
transfected with sAC siRNA (reduced [mt-cAMP]) were exposed to solvent (0.1% DMSO, 30 min). Following a 2 min control period, cells were exposed to AII (10 nM) for an additional 2 min before ΔΨm was dissipated with FCCP + oligomycin. TMRM, IBMX or vehicle were present throughout the entire experiment. n = 37 control RNA and 39 sAC siRNA treated cells; *p = 0.0248 and #p = 0.0221 (two-way ANOVA and Sidak’s multiple comparison test).
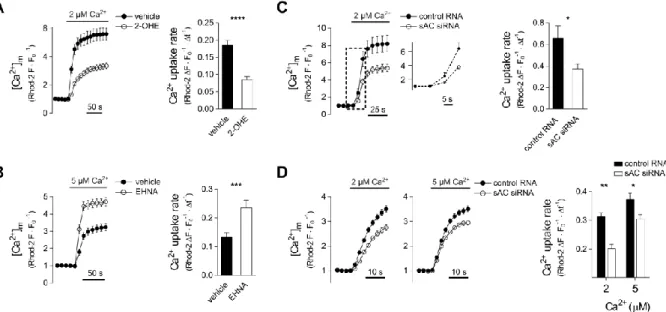
Figure 2. Effect of mt-cAMP on mitochondrial Ca2+ uptake in permeabilised cells
Ca2+ accumulation into mitochondria of permeabilised H295R cells in the presence of 2-OHE (A) or EHNA (B). Cells were loaded with 2 μM Rhod-2 AM for 30 min at 37 °C and then kept at room temperature for 15 min. Following permeabilisation, the cells were superfused with Ca2+-free cytosol-like medium and [Ca2+] was subsequently raised to 2 or 5 μM Ca2+ as indicated. Rhod-2 fluorescence data were measured by confocal microscopy and were normalized to control period (FO). Drugs were present throughout the entire experiment.
Column bar graphs show mean mitochondrial Ca2+ uptake rates. Panel A: n = 51 vehicle and 60 2-OHE (20 μM) treated cells; ****p < 0.0001, Mann-Whitney test. Panel B: n = 39 vehicle and 32 EHNA (10 µM) treated cells; ***p = 0.0002, Mann-Whitney test. (C) Mitochondrial Ca2+ uptake in sAC-silenced permeabilised H295R cells. Two days after co- transfection with sAC siRNA or control RNA and mitochondrially targeted GFP, dye loading, permeabilisation and confocal microscopy were carried out as described for Panel A.
After the control period [Ca2+] of the cytosol like medium was raised from 0 nM to 2 μM as indicated. Only GFP+ cells were regarded as RNA-transfected and used for statistics. Column bar graphs show mean mitochondrial Ca2+ uptake rate. n = 19 control and 18 sAC silenced cells; *p = 0.0279 (t-test with Welch’s correction). Inset magnifies the section indicated by the box (dashed lines). (D) Mitochondrial Ca2+ uptake in sAC-silenced permeabilised HeLa cells. Two days after transfection with control or sAC siRNA dye loading, permeabilisation and confocal microscopy were carried out as described for Panel C. [Ca2+] of the cytosol like
medium was raised from 100 nM to 2 or 5 μM as indicated. Column bar graphs show mean mitochondrial Ca2+ uptake rate. n = 40 control and 23 sAC-silenced cells at 2 μM [Ca2+] and 26 control and 40 sAC-silenced cells at 5 μM [Ca2+]; *p = 0.0067 and **p < 0.0001 (2-way ANOVA and Sidak’s post-hoc test).
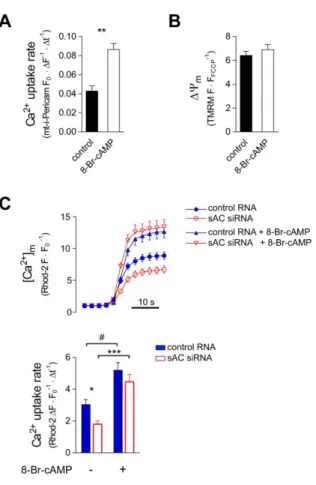
Figure 3. Mitochondrial Ca2+ uptake and ΔΨm in the presence of 8-Br-cAMP in H295R cells
(A) Effect of 8-Br-cAMP on mitochondrial Ca2+ uptake in permeabilised H295R cells. Cells expressing mt-i-Pericam were pre-incubated (37 °C) in the presence or absence of 1 mM 8- Br-cAMP for 60 min. Following permeabilisation, the cells were incubated with or without 1 mM 8-Br-cAMP for additional 15 min in a Ca2+-free cytosol like medium. After the control superfusion period, [Ca2+] was raised in the medium from 0 to 2 µM. Confocal and wide-field fluorescent microscopic measurements of i-Pericam (expressed as FO/F) gave identical results and therefore data were pooled. n = 36 control and 56 8-Br-cAMP treated cells; **p < 0.0001 (Mann-Whitney test). (B) The effect of 8-Br-cAMP on ΔΨm. Cells were incubated with 8-Br- cAMP, permeabilised and pre-incubated with 8-Br-cAMP again as described for Panel A. n = 123 control and 85 8-Br-cAMP treated. (p = 0.319, t-test.) (C) Effect of 8-Br-cAMP (triangles) on mitochondrial Ca2+ uptake in cells transfected with control RNA (full blue
symbols) or sAC siRNA (empty red symbols). Cells were co-transfected with sAC siRNA or control RNA and with mitochondrially targeted GFP. Rhod-2 loading, permeabilisation and microscopy were performed as described for Fig.2 A and, again, only GFP+ cells were regarded as RNA-transfected and used for statistics. After permeabilisation cells were incubated with 1 mM 8-Br-cAMP in Ca2+-free cytosol like medium for 15 min. Then, cells were superfused with Ca2+-free cytosol-like medium and perimitochondrial [Ca2+] was raised to 2 μM Ca2+. Upper panel shows mean curves (+ s.e.m.); lower panel shows mean mitochondrial Ca2+ uptake rate (+ s.e.m.). Number of observations: control RNA 28, control RNA + 8-Br-cAMP 30, sAC siRNA 18, sAC siRNA + 8-Br-cAMP 20. *p = 0.0487, #p = 0.0143 and ***p = 0.0001 (ANOVA followed by Dunn’s post-hoc test).
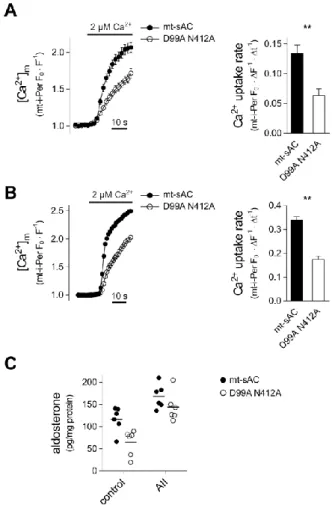
Figure 4. Effect of mt-sAC overexpression on mitochondrial Ca2+ accumulation and aldosterone production
(A) Mitochondrial Ca2+ uptake in permeabilised H295R cells expressing wild-type or mutant mitochondrially targeted sAC. Cells were co-transfected with a plasmid coding the mitochondria-targeted Ca2+ sensitive fluorescent protein inverse-Pericam (i-Pericam) together with mitochondrially targeted sAC (mt-sAC-mRFP) or the double mutant version (D99A N412A) thereof. Two days after transfection, the cells were permeabilised and superfused with a Ca2+ free cytosol-like medium before raising [Ca2+] to 2 μM Ca2+. Pericam fluorescence was measured by confocal microscopy and was normalized to the control period and expressed as FO/F; only mRFP positive cells were analysed. Column bar graphs show mean mitochondrial Ca2+ uptake rate. n = 23 mt-sAC and 19 D99A N412A expressing cells;
**p < 0.0001, Mann-Whitney test. (B) Mitochondrial Ca2+ uptake in permeabilised HeLa cells WT or mutant mt-sAC variants. Cells were co-transfected with mt-i-Pericam and WT or the double mutant (D99A N412A) mt-sAC-mRFP. For further details see Panel A. Right panel shows average mitochondrial Ca2+ uptake rate. n = 76 WT mt-sAC and 57 double
mutant sAC expressing cells; **p < 0.0001 (Mann-Whitney test). (C) Aldosterone production in H295R cells expressing wild-type or mutant mt-sAC. Cells were transfected with plasmids coding for WT or double mutant mt-sAC-V5 and basal and AII-stimulated 2h aldosterone production was measured as described in Methods. Horizontal lines show mean. p = 0.0045 for WT vs. double mutant, p < 0.0001 for the effect of AII and p = 0.35 for interaction; two- way ANOVA.
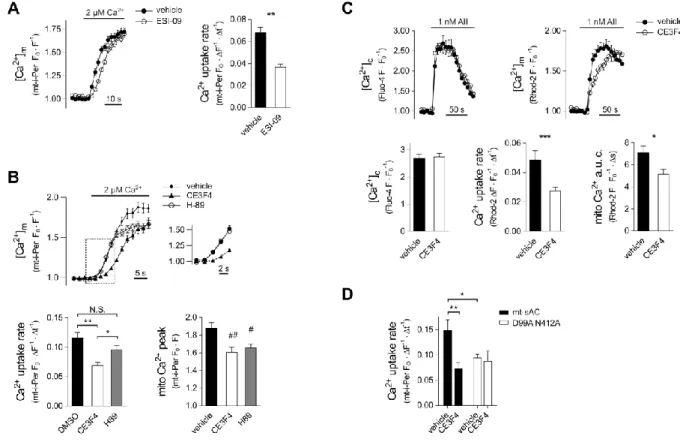
Figure 5. Role of Epac and PKA in the control of mitochondrial Ca2+ uptake
(A) Mitochondrial Ca2+ accumulation in permeabilised H295R cells exposed to the pan-Epac inhibitor ESI-09. Cells were pre-incubated with 20 μM ESI-09 or DMSO for 20 min in DMEM/F12 at 37 C°. After permeabilisation cells were incubated with 20 μM ESI-09 for further 10 min in a Ca2+ free cytosol like medium. Following a 30 s Ca2+-free control superfusion [Ca2+] was raised to 2 μM. Pericam fluorescence was measured with confocal microscope and expressed as FO/F. Column bar graphs display mean mitochondrial Ca2+
uptake rate. n = 35 vehicle and 28 ESI-09 treated cells; **p < 0.0001 (t-test). (B) Mitochondrial Ca2+ uptake in permeabilised H295R cells in the presence of PKA (H-89) or Epac-1 (CE3F4) inhibitors. Cells expressing mt-i-Pericam were pre-incubated with 20 μM CE3F4 or 20 μM H-89 or 0.04% DMSO for 1 h in DMEM/F12 at 37 C°. After permeabilisation cells were incubated with the appropriate drug for further 10 min in a Ca2+- free cytosol like medium. Following a 30 s Ca2+-free control superfusion [Ca2+] was raised to 2 μM. Pericam fluorescence was measured with confocal microscope and expressed as FO/F.
Inset magnifies the section indicated by the box (dashed lines). Lower left graph displays mean mitochondrial Ca2+ uptake rate whereas lower right graph shows mitochondrial Ca2+
peak. n = 25, 22 and 23 for vehicle, CE3F4 and H-89 treated cells, respectively. **p <
0.0001, *p = 0.0439; #p = 0.0228 for vehicle vs. H89 and ##p = 0.0045 for vehicle vs. CE3F4 (two separate ANOVA analysis both followed by Sidak’s post-hoc test). (C) Effect of Epac-1 inhibition on mitochondrial Ca2+ handling during AII-induced Ca2+ signalling in H295R cells.
For the simultaneous measurement of [Ca2+]m and [Ca2+]c cells were co-loaded with 2 μM Rhod-2 AM and 2 μM Fluo-4 AM. Then, cells were pre-incubated with 20 μM CE3F4 or vehicle (0.04% DMSO) for 10 min. After 30 s control superfusion, the cells were exposed to 1 nM AII. Fluorescence data were monitored by confocal microscopy and normalized to the 60 s control period. Lower left graph: maximal F/FO Fluo-4 value in the first 60 s of stimulation ([Ca2+]c peak); lower middle graph: the slope of the linear section of the [Ca2+]m
curves; lower right graph: area under the curve (a.u.c.) of the [Ca2+]m data integrated for the first 60 s of stimulation. n = 19 vehicle and 32 CE3F4 treated cells; ***p = 0.0046 (unpaired t-test), *p = 0.026 (Mann-Whitney test). (D) Effect of the Epac-1 inhibitor CE3F4 on Ca2+
uptake in permeabilised HeLa cells. The cells were treated as described for Panel B with the exception that following [Ca2+] was raised from 100 nM (rather than from 0 nM) to 5 μM. n = 19, 16 and 27, 11 for solvent or CE3F4 treated wild-type sAC transfected cells and solvent or CE3F4 treated double mutant (D99A N412A) mt-sAC transfected cells, respectively. **p = 0.0037, *p = 0.0215, (two-way ANOVA followed by Tukey’s post-hoc test).
Figure 6. Schematic illustration of the proposed mt-cAMP-dependent positive feedback control of mitochondrial Ca2+ uptake Red arrows represent activation. (Templates from the Servier medical art website (http://www.servier.com/Powerpoint-image-bank) were used for this figure.)