ASC-1 transporter-dependent amino acid uptake is
required for the efficient thermogenic response of human adipocytes to adrenergic stimulation
Rini Arianti1,2 , BoglarkaAgnes Vinnai 1, Beata B. Toth1, Abhirup Shaw1,2 ,Eva Cs} osz1 , Attila Vamos1,2, Ferenc Gy}ory3, Pamela Fischer-Posovszky4, Martin Wabitsch4, Endre Kristof1 and Laszlo Fes€us1
1 Department of Biochemistry and Molecular Biology, Faculty of Medicine, University of Debrecen, Hungary 2 Doctoral School of Molecular Cell and Immune Biology, University of Debrecen, Hungary
3 Department of Surgery, Faculty of Medicine, University of Debrecen, Hungary
4 Division of Pediatric Endocrinology and Diabetes, University Medical Center Ulm, Germany
Correspondence
E. Kristof and L. Fes€us, Department of Biochemistry and Molecular Biology, Faculty of Medicine, University of Debrecen, H-4032 Debrecen, Hungary Tel:+36 52 416 432
E-mail: kristof.endre@med.unideb.hu (E.K.);
fesus@med.unideb.hu (L.F.)
Endre Kristof and Laszlo F esus contributed€ equally to this work.
(Received 20 April 2021, revised 16 June 2021, accepted 28 June 2021, available online 23 July 2021)
doi:10.1002/1873-3468.14155 Edited by Peter Brzezinski
Brown and beige adipocytes dissipate energy by uncoupling protein 1 (UCP1)-dependent and UCP1-independent thermogenesis, which may be uti- lized to develop treatments against obesity. We have found that mRNA and protein expression of the alanine/serine/cysteine transporter-1 (ASC-1) was induced during adipocyte differentiation of human brown-prone deep neck and beige-competent subcutaneous neck progenitors, and SGBS preadipo- cytes. cAMP stimulation of differentiated adipocytes led to elevated uptake of serine, cysteine, and glycine, in parallel with increased oxygen consump- tion, augmented UCP1-dependent proton leak, increased creatine-driven sub- strate cycle-coupled respiration, and upregulation of thermogenesis marker genes and several respiratory complex subunits; these outcomes were impeded in the presence of the specific ASC-1 inhibitor, BMS-466442. Our data sug- gest that ASC-1-dependent consumption of serine, cysteine, and glycine is required for efficient thermogenic stimulation of human adipocytes.
Keywords:adipocytes; ASC-1 inhibition; gene expression; obesity; proton leak respiration; thermogenesis; uncoupling protein 1
The activation of nonshivering thermogenesis of brown and beige adipocytes located in either brown or white adipose tissue, respectively, dissipates energy sources to heat. Uncoupling protein 1 (UCP1) plays a major role in their heat generation by creating a proton leak in the inner membrane of mitochondria uncoupling the mitochondrial respiratory chain from ATP synthe- sis [1]. Both thermogenic adipocytes possess
multilocular lipid droplets, high expression of UCP1, and large amounts of mitochondria [2]. Recently, UCP1-independent thermogenesis in beige adipocytes has been described, including a creatine-driven sub- strate cycle[3,4].
In mice, brown and beige cells have different pro- genitors and locations exhibiting distinct gene expres- sion and functional signatures [5–8]. It has been
Abbreviations
ASC-1, alanine/serine/cysteine transporter-1; CKB, creatine kinase B; DN, deep neck; ECAR, extracellular acidification rate; FTO, fat mass and obesity-associated; GSH, glutathione; hASCs, human adipose-derived stromal cells; NADPH, nicotinamide adenine dinucleotide phos- phate; OCR, oxygen consumption; SC, subcutaneous; SGBS, Simpson-Golabi-Behmel syndrome; TCA, tricarboxylic acid; UCP1, Uncoupling protein 1.
reported that brown adipose tissue adipocytes are derived from myogenic precursors, while beige adipo- cytes have a common origin with white ones develop- ing from mesenchymal progenitors of white adipose tissue and activated in response to cold and b-adrenergic stimuli, physical exercise, and PPAR-c stimulation[9,10], which is often referred to as “adipo- cyte browning.” In humans, brown and variably
“brownable” adipose tissue depots are interspersed in several anatomical regions, including cervical deep neck (DN), supraclavicular, axillary, paraspinal, and mediastinal depots [11–13]. Unlike in rodents, there is no clear distinction regarding the origin and molecular signature of human brown adipocytes and adipose tis- sue. Several studies have reported that human brown adipocytes isolated from DN or supraclavicular area resemble murine beige adipocytes [14–17] while others proposed that they closely resemble classic murine brown fat but that some beige adipocytes might also be present in DN[18,19]. Using stromal vascular frac- tions from brown and white human adipose tissue depots and ex vivo brown and white differentiation protocols, adipocyte cultures with high and low pro- portion of thermogenesis competent cells can be obtained[20–23].
Emerging evidence suggests that beige adipocytes in white adipose tissue persist in a masked form possess- ing the morphology of white adipocytes[2]. Their acti- vation can quickly occur, usually through adrenergic stimulation, involving inhibition of ongoing mitophagy [23]. Genetic predisposition contributes to the size of the beige cell population; an intronic single nucleotide polymorphism of fat mass and obesity-associated (FTO) gene shifts the balance between white and beige progenitors toward the former [24]. We have recently reported that the FTO status strongly influences the thermogenic potential of neck area adipocytes regard- less of type of depot and differentiation protocol[22].
The enhancement of adipocyte thermogenesis can be a promising approach in treating obesity. Therefore, it is important to reveal all molecular elements of thermogenic regulation. Recently, we used high- throughput RNA sequencing technology to analyze global gene expression patterns of ex vivo differenti- ated human DN and subcutaneous (SC) adipocytes that had equal differentiation capacity [22]and found a set of differentially expressed genes when they were compared. One of these genes was SLC7A10 which showed higher expression in DN-derived adipocytes, particularly when they were differentiated according to a brown protocol. SLC7A10 encodes the alanine/
serine/cysteine transporter-1 (ASC-1) that facilitates the sodium-independent, bidirectional transport of
small neutral amino acids, including alanine, serine, cysteine, and glycine. ASC-1 is the main regulator of extracellular D-serine levels in synaptic systems [25].
The ASC-1 transporter was previously listed as a white adipocyte-specific cell surface marker [26]. It has been recently reported that mRNA expression of ASC-1 is high and induced in adipocytes freshly isolated from abdominal subcutaneous and omental white adipose tissue and shows strong inverse correlation with vis- ceral obesity and insulin resistance in humans[27], and it promotes mitochondrial respiration and insulin- stimulated glucose uptake.
Here, we report the induction of ASC-1 during white and brown differentiation of DN and SC- derived neck adipocytes and Simpson-Golabi-Behmel syndrome (SGBS) cells that model beige adipogenic differentiation[28–30]. The presence of a specific ASC- 1 inhibitor resulted in decreased serine, cysteine, and glycine consumption during cAMP stimulation of DN- derived white and brown adipocytes with the conse- quence of decreased UCP1-dependent and UCP1- independent respiration as well as reduced thermogenic gene inductions. cAMP-induced respiratory and gene expression changes could be also reduced by the ASC- 1 inhibitor in differentiated adipocytes of SC and SGBS cell origin. The results demonstrate an impor- tant role of ASC-1 in regulation of human adipocyte thermogenesis.
Materials and methods
Materials
All chemicals were from Sigma-Aldrich (Munich, Germany) unless stated otherwise.
Ethics statement and obtained tissue samples
Tissue collection was approved by the Medical Research Council of Hungary (20571-2/2017/EKU) followed by the EU Member States’ Directive 2004/23/EC on pre- sumed consent practice for tissue collection. All experi- ments were carried out in accordance with the guidelines of the Helsinki Declaration. Written informed consent was obtained from all participants before the surgical procedure. During thyroid surgeries, a pair of DN and SC adipose tissue samples was obtained to rule out interindividual variations. Patients with known diabetes, malignant tumor, or with abnormal thyroid hormone levels at the time of surgery were excluded.
Human adipose-derived stromal cells (hASCs) were iso- lated from SC and DN fat biopsies as described previ- ously [22,31].
Differentiation and treatment of hASCs and SGBS preadipocytes
White and brown adipocytes were differentiated from stro- mal vascular fraction of adipose tissue containing hASCs or SGBS preadipocytes according to described protocols [20,21]. Differentiated adipocytes were maintained in DMEM-F12-HAM medium and treated with a single bolus of 500µMdibutyryl-cAMP (cat#D0627) for 10 h to mimic in vivo cold-induced thermogenesis [23]. BMS-466442 (Aobious INC, Gloucester, MA, USA cat#AOB6567) was administered in 100 nMto inhibit ASC-1 transporter activ- ity[32].
Quantification of amino acids and calculation of their uptake by cells
Frozen cell culture supernatants were filtered using 3 kDa filters (Pall Corporation, Port Washington, NY, USA), and then, 10lL of filtrate was derivatized with AccQTag Ultra Derivatization Kit (Waters, Milford, MA, USA). Chro- matographic separation was carried out on H-class UPLC (Waters) using AccQTag Ultra Column (2.1 x 100 mm), AccQTag Eluent A and B, and gradient provided in the AccQTag Ultra Chemistry Kit (Waters). Detection of amino acid derivatives was performed at 260 nm in the PDA detector of the UPLC. Concentration of the amino acids was calculated with the Empower software (Waters) using a 7-point calibration curve.
Flux of amino acids into or from adipocytes was calcu- lated by comparing concentration differences measured at starting and end point of 10 h of dibutyryl-cAMP treat- ment with or without the presence of ASC-1 inhibitor. The number of cells in wells was calculated using KOVA glass- tic slide 10 with grids (Kova International Inc, Garden Grove, CA, USA, cat#K304680) as described (https://www.
kovaintl.com/downloads/DI-91064-17).
RNA isolation, RNA-seq analysis, and quantitative real-time PCR (RT-qPCR)
Cells were collected, total RNA was isolated, and RT- qPCR was performed as described previously[28,33]. Gene primers and probes were designed and supplied by Thermo Fisher Scientific (Waltham, MA, USA) as listed in TableS1. Global transcriptome analysis by high- throughput mRNA sequencing was performed on Illumina sequencing platform as detailed in our recent paper[22].
Immunoblotting and densitometry
Immunoblotting and densitometry were carried out as described previously[23]. Antibodies and working dilutions are listed in TableS2.
Oxygen consumption and extracellular acidification rate measurement
Oxygen consumption (OCR) and extracellular acidification rate (ECAR) were measured using an XF96 oximeter (Sea- horse Biosciences, North Billerica, MA, USA) as described previously[33]. After recording the baseline OCR, 500µM dibutyryl-cAMP, 100 nM BMS-466442, or combination of the two compounds was injected to the cells. Then, stimu- lated OCR was recorded every 30 min. The adipocytes were treated with the creatine analogue 2 mM b- guanidinopropionic acid (b-GPA) which interferes with creatine-driven substrate cycle [3,34]. Proton leak respira- tion was determined after injecting oligomycin at 2lMcon- centration. Cells received a single bolus of antimycin A at 10lM concentration for baseline correction (measuring nonmitochondrial respiration). The OCR was normalized to protein content.
Statistical analysis
The results are expressed as meanSD. Normality of the data was tested by Kolmogorov–Smirnov test. For multiple comparisons of groups, statistical significance was deter- mined by one-way analysis of variance followed by Tukey post hoc test. In comparison of two groups, two-tailed paired Student’s t-test was used. The data were visualized and analyzed by using GRAPHPAD PRISM8 (GraphPad Soft- ware, San Diego, CA, USA).
Results
Alanine/serine/cysteine transporter-1 is induced in human white and brown adipocytes
differentiated from deep neck and subcutaneous progenitors and SGBS cells
In an attempt to extend our knowledge about regula- tory mechanism of thermogenesis, we have started to study adipocyte populations differentiated to white and brown cells at the same extent from stromal vas- cular fraction of paired DN and SC adipose tissue sites of nine donors and compared their global gene expression patterns by global RNA sequencing [22].
We found that according to mRNA expression-based ProFAT and BATLAS scores [35,36], DN-derived brown and even white adipocytes had high browning potential probability compared with SC cells and pos- sessed elevated expression of brown-marker genes (e.g., UCP1, CKMT1A/B, CPT1A/B, CIDEA, PM20D1, DIO2, LEPR, FABP3); the expression pro- file of these genes showed a very similar pattern in the samples according to Pearson’s correlation analysis (Fig.S1). Looking for potential thermogenesis
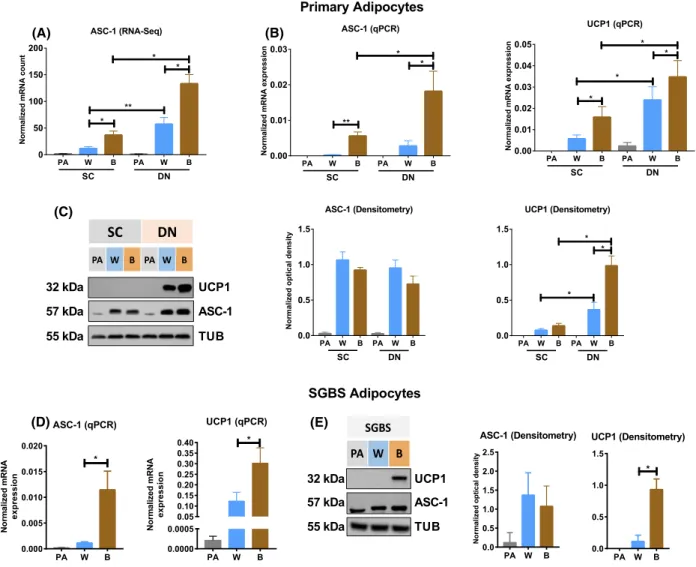
regulators, we found that UCP1 and the brown- marker genes were clustered with SLC7A10 which encodes the amino acid transporter ASC-1. SLC7A10 mRNA was elevated in DN as compared to SC adipo- cytes with higher levels in brown than in white cells (Fig.1A). The same expression pattern of ASC-1 and UCP1 was observed when we validated the RNA-seq data by RT-qPCR analysis in adipocytes obtained from a separate set of donors (Fig.1B). We noticed that the expression ofASC-1was low in both DN and SC preadipocytes and was induced during the brown and white differentiation process in parallel with vari- ous levels of UCP1induction. The transporter protein was present in the adipocytes after differentiation and neither the differentiation protocol nor the anatomical origin of the cells resulted in consistently different ASC-1 protein levels (Fig.1C) while UCP1 levels were higher in DN and brown cells compared with SC and white ones.
We have also investigated the expression of ASC-1 transporter in SGBS cells which can model beige dif- ferentiation [28]. It was induced in differentiating SGBS adipocytes (Fig.1D) and both white and brown cells contained ASC-1 protein with a higher level in the former (Fig.1E). In accordance with published results, SGBS beige adipocytes, obtained with brown differentiation protocol, showed higher level of UCP1 mRNA as well as protein expression[28].
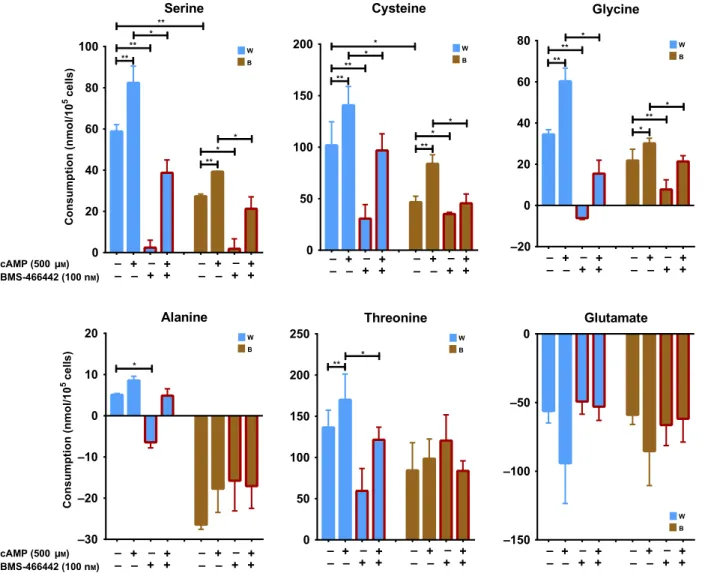
Facilitated serine, cysteine, and glycine uptake by adrenergic stimulation of DN adipocytes is decreased in the presence of ASC-1 inhibitor To learn the functional significance of ASC-1 in adipo- cytes, we calculated the consumption of alanine, serine, cysteine, and glycine by the differentiated brown and white DN adipocytes after their adrenergic stimulation by the cell-permeable dibutyryl-cAMP for 10 h. We found that serine, cysteine, glycine, and also the ASC- 1 substrate threonine were transported at a high basal rate into unstimulated brown and white adipocytes (significantly more serine and cysteine into white than into brown cells), which could be inhibited by the addition of the specific noncompetitive ASC-1 inhibi- tor, BMS-466442 (Fig.2), in a nanomolar concentra- tion which was effective in previous cellular experiments [32]. cAMP treatment led to significant facilitation of the uptake of these amino acids, and this was suppressed in the presence of the ASC-1 inhi- bitor. Interestingly, alanine uptake was low into white adipocytes and brown cells even transported alanine out both in resting and cAMP-stimulated conditions;
none of the latter were significantly influenced by the
inhibitor treatment. Alanine release may indicate that brown adipocytes degrade amino acids for fueling the tricarboxylic acid (TCA) cycle and convert nitrogen to pyruvate forming alanine as part of a possible glucose/
alanine cyclein vivo[37]. Since ASC-1 operates prefer- entially, although not exclusively, in an exchange mode [38], alanine release may allow uptake of more serine, cysteine, and glycine. In this context, we also observed significant release of glutamate which can be trans- ported by ASC-1.
ASC-1 inhibition hinders UCP1-dependent and UCP1-independent oxygen consumption upon cAMP stimulation
Next, we investigated the importance of ASC-1 in ther- mogenic activation of adipocytes by monitoring oxygen consumption rate and blocking ASC-1 transporter activity by adding the inhibitor, BMS-466442 during short-term adrenergic stimulation. Of note, the inhibitor did not influence mRNA and protein expression of ASC-1 in either the primary or SGBS adipocyte (Fig. S2). As expected, OCR was elevated immediately upon cAMP addition to white and brown DN adipo- cytes (Fig. 3A) which preserve their thermogenesis potential during differentiation. The respiratory response of the brown adipocytes compared with white ones was higher in accordance with higher expression of UCP1 and other thermogenesis-related genes[22]. The ASC-1 inhibitor significantly reduced cAMP-stimulated oxygen consumption in both types of adipocytes (Fig. 3A). Basal respiration was not affected by ASC-1 inhibition in spite of the decreased uptake of serine, cys- teine, and glycine in resting adipocytes (Fig. 2), showing that the transporter plays a respiration facilitating role during thermogenic activation of adipocytes. To deter- mine the effect of the inhibitor on UCP1-dependent portion of cellular respiration, we injected oligomycin that blocks ATP-synthase activity and makes estimation of UCP1-dependent proton leak possible. This was reduced by the ASC-1 inhibitor in both white and brown cAMP-stimulated DN adipocytes (Fig.3A) pointing to a significant influence of ASC-1 transported amino acids on mitochondrial proton gradient genera- tion and its uncoupling. Contribution of a UCP1- independent creatine-driven substrate cycle to the stim- ulated respiration was estimated by applying the cre- atine analogue,b-GPA, and calculating the consequent reduction in oxygen consumption [3,33]; b-GPA- inhibited portion of respiration was elevated following cAMP treatment, and it could be blunted by the ASC-1 inhibitor in both white and brown DN adipocytes. Non- mitochondrial respiration (Fig. 3A), basal, and cAMP-
stimulated ECAR (Fig.3B) were not influenced by inhi- bition of ASC-1.
As we observed UCP1 protein expression in white and brown SC and SGBS adipocytes, we also investigated the respiratory response in these cells. The basal respiration of brown SC and SGBS adipocytes was higher than of white ones (Fig.S3A-B). cAMP increased oxygen con- sumption in both white and brown SC and SGBS adipo- cytes. ASC-1 inhibition significantly decreased cAMP- stimulated UCP1-dependent and UCP1-independent (b-GPA-inhibited) oxygen consumption in both white and brown SC and SGBS adipocytes, but did not affect the basal and nonmitochondrial respiration (Fig.S3A-B).
The basal and cAMP-stimulated ECARs of SC and SGBS adipocytes were not affected by ASC-1 inhibitor (Fig.S3C). These data suggest that SC neck and SGBS adipocytes also possess thermogenic potential and ASC- 1-mediated amino acid transport is needed for its efficient activation.
Inhibition of ASC-1 abrogates the upregulation of thermogenic markers and mitochondrial
complexes upon cAMP stimulation
Based on the observed effect of ASC-1 transporter inhi- bition on cAMP-stimulated respiration of adipocytes,
PA W B PA W B
0 50 100 150 200
ASC-1 (RNA-Seq)
NormalizedmRNAcount
SC DN
*
**
*
*
(D)
PA W B PA W B
0.00 0.01 0.02 0.03
ASC-1 (qPCR)
NormalizedmRNAexpression
**
*
*
SC DN
PA W B PA W B
0.0 0.5 1.0 1.5
UCP1 (Densitometry)
*
*
*
SC DN
PA W B PA W B
0.0 0.5 1.0 1.5
ASC-1 (Densitometry)
Normalizedopticaldensity
SC DN
(A) (B)
(C)
PA W B
0.0000 0.0005 0.05 0.10 0.15 0.20 0.25 0.30 0.35 0.40
UCP1 (qPCR)
NormalizedmRNA expression
*
PA W B
0.0 0.5 1.0 1.5
UCP1 (Densitometry)
*
PA W B
0.0 0.5 1.0 1.5 2.0 2.5
ASC-1 (Densitometry)
Normalizedopticaldensity
PA W B PA W B
0.00 0.01 0.02 0.03 0.04 0.05
UCP1 (qPCR)
NormalizedmRNAexpression *
*
SC DN
*
*
32 kDa 57 kDa 55 kDa
UCP1 ASC-1 TUB (E)
Primary Adipocytes
SGBS Adipocytes
PA W B
0.000 0.005 0.010 0.015 0.020
ASC-1 (qPCR)
NormalizedmRNA expression
*
32 kDa 57 kDa 55 kDa
UCP1 ASC-1 TUB
SGBS PA W B
SC DN
PA W B PA W B
Fig. 1.mRNA and protein expression of alanine/serine/cysteine transporter-1 (ASC-1) in human neck area and Simpson-Golabi-Behmel syndrome (SGBS) adipocytes. (A) ASC-1 mRNA expression determined by RNA-seq.n=9 for all groups. Statistical analysis was performed by one-way ANOVA with the option "each row represents matched, or repeated measures, data." (B) Validation of ASC-1 mRNA expression by RT-qPCR. n=6 for all groups. (C) Detection and quantification of ASC-1 and uncoupling protein 1 (UCP1) by immunoblotting and densitometry.n=7 for all groups. (D) mRNA and (E) protein expression of ASC-1 and UCP1; n=5 for all groups. PA, preadipocytes;
W, white; B, brown differentiation. Unless indicated, statistical analysis was performed by pairedt-test,*P<0.05,**P<0.01.
we presumed that induction of thermogenic genes was also affected. DN adipocytes had the tendency to express PGC1a, UCP1, and CKMT2 browning markers at a higher extent than the SC ones (Fig.4A) as reported previously[22]. As anticipated, cAMP elevated the mRNA and protein expression of these genes in both white and brown SC and DN adipocytes, with some exceptions in white SC cells (Fig.4B). Inhibition of ASC-1 resulted in reduced cAMP-dependent upregu- lation of PGC1a, CKMT2, and UCP1 mRNA and pro- tein expression. cAMP could also increase the mRNA and protein expression of the three thermogenic genes in white and brown SGBS adipocytes in most cases and this was also prevented in the presence of the ASC-1 inhibitor (Fig.4C,D).
We also investigated the effect of ASC-1 inhibitor on other brown/beige adipocyte markers in primary adipocytes. cAMP increased the mRNA expression of PM20D1[39],CKMT1A/B[3],ELOVL3[40],CITED1 [15], DIO2 [41], and TBX1 [16] which was blunted by ASC-1 inhibition (Fig. S4).
In addition to thermogenic markers, we also investi- gated the effect of ASC-1 transporter inhibitor on pro- tein expression of mitochondrial complex subunits.
cAMP treatment elevated the expression of complex I and II subunits in DN (except in some brown cells with already high levels) and partially in SC adipo- cytes. The elevated levels could be reduced by the addition of the ASC-1 inhibitor (Fig.5A-C,E). The amount of mitochondrial complex III and V subunits 0
20 40 60 80 100
Serine
Consumption(nmol/105cells)
**
**
*
**
*
*
**
– –
+ + – – +
+ – –
+ + – – +
+ cAMP (500 µM)
BMS-466442 (100 nM)
W B
0 50 100 150 200
Cysteine
**
**
*
**
*
*
* W
B
– – +
+ – – +
+ – –
+ + – – +
+
–20 0 20 40 60 80
Glycine
**
**
*
*
**
*
– – +
+ – – +
+ – –
+ + – – +
+
W B
–30 –20 –10 0 10 20
Alanine
*
W B
– –
+ + – – +
+ – –
+ + –
– + + cAMP (500 µM)
BMS-466442 (100 nM) Consumption(nmol/105cells)
0 50 100 150 200 250
Threonine
**
– – +
+ – – +
+ – –
+ + – – +
+
W
* B
–150 –100 –50 0
Glutamate
– – +
+ – – +
+ – –
+ + – – +
+
W B
Fig. 2.Effect of 10 h of thermogenic induction and ASC-1 inhibitor (BMS-466442) treatment on serine, cysteine, glycine, alanine, threonine, and glutamate consumption by human deep neck area-derived adipocytes. W, white; B, brown differentiation;n=3 for all groups. Statistical analysis was performed by pairedt-test,*P<0.05,**P<0.01.
was not affected by either cAMP or the inhibitor while complex IV levels in DN cells were decreased by the latter (Fig.5D,F). cAMP stimulation did not lead to significant increase in mitochondrial complex subunits in either white or brown SGBS adipocyte and ASC-1 inhibition did not have pronounced effects (Fig.S5).
Discussion
SLC transporters act as metabolic gates for the cells and facilitate the transport of important biomole- cules such as glucose, amino acids, fatty acids, vita- mins, and ions [42]. Thermogenic brown and beige adipocytes utilize glucose and fatty acids in a
0 100 200 300 400 500 600 0
10 20 30
660 DN W
Time (min) OCR(pmolesO2/min*µgprotein)
Untreated cAMP BMS-466442 cAMP+BMS-466442 β-GPA
cAMP BMS-466442
cAMP+BMS-466442 Oligomycin
Antimycin A
0 100 200 300 400 500 600 0
10 20 30 40 50
660 DN B
Time (min) OCR(pmolesO2/min*µgprotein)
Untreated cAMP BMS-466442 cAMP+BMS-466442 β-GPA
cAMP BMS-466442
cAMP+BMS-466442 Oligomycin
Antimycin A
0 20 40 60
OCR(pmolO2/min*µgprotein)
* *
* * *
*
Basal Maximal Stimulation β-GPA Inhibted –
– +
+ –
– + + cAMP (500 μM)
BMS-466442 (100 nM)
– –
+
+ –
– + +
Proton Leak – – +
+ –
– + +
Non-mitochondrial Respiration – – +
+ –
– + +
0 20 40 60
OCR(pmolO2/min*µgprotein)
* *
* *
* *
Basal Maximal Stimulation β-GPA Inhibted –
– +
+ –
– + + cAMP (500μM)
BMS-466442 (100 nM)
– –
+
+ –
– + +
Proton Leak – – +
+ –
– + +
Non-mitochondrial Respiration – – +
+ –
– + +
0 5 10 15 20 25
ECAR(mpH/min)
Basal Maximal Stimulation
*
– –
+
+ –
– + + cAMP (500μM)
BMS-466442 (100 nM)
0 5 10 15 20 25
Basal
*
Maximal Stimulation –
– +
+ –
– + +
(A)
(B)
Fig. 3.Effect of ASC-1 inhibitor (BMS-466442) on cAMP-stimulated oxygen consumption rate (OCR) and extracellular acidification rate (ECAR) in human deep neck (DN) white and brown adipocytes. (A) OCR of adipocytes was detected for 10 h following cAMP stimulation without and with ASC-1 inhibition; representative curves of four measurements (left panels). OCR at basal, maximal stimulation, afterb-GPA inhibition, oligomycin, and antimycin A addition (right panels) was quantified in adipocytes derived from four independent donors. (B) ECARs of DN white and brown at basal and maximal stimulation;n=4 for all groups. W, white; B, brown differentiation. Statistical analysis was performed by pairedt-test,*P<0.05,**P<0.01.
significant proportion as fuels to generate heat and SLC transporters mediate their uptake via the glu- cose transporter-4, encoded by SLC2A4, and the fatty acid transporter-1, encoded by SLC27A1 [43,44]. Brown adipose tissue can actively oxidize branched-chain amino acids during cold-induced thermogenesis [45]; however, the role of amino acid influx in the metabolism and regulation of thermo- genic adipocytes has not been fully investigated so far. The data presented here have revealed the importance of the alanine, serine, cysteine, glycine
transporter ASC-1 (encoded by SLC7A10), induced during adipocyte differentiation, in stimulated ther- mogenesis of human adipocytes. Inhibition of ASC-1 during cAMP treatment prevented efficient response of highly thermogenic DN-derived brown and white adipocytes (with a mixed population of brown and beige cells) as well as lower thermogenesis competent adipocyte populations of subcutaneous origin which contain beige cells.
ASC-1 mRNA was induced and expressed at a greater extent in DN and SC brown adipocytes as
0.00 0.05 0.10 0.15
UCP1 (qPCR)
NormalizedmRNAexpression
SC DN
W B
*
*
*
– – + – – + + + – – + – – + + + – – + – – + + + – – + – – + + +
*
*
* *
0.00 0.05 0.10 0.15
CKMT2 (qPCR)
SC DN
W B
* *
– – + – – + + + – – + – – + + + – – + – – + + + – – + – – + + +
*
NormalizedmRNAexpression
0.00 0.02 0.04 0.06 0.08 0.10
PGC1α (qPCR)
SC DN
W B
– – + – – + + + – – + – – + + + – – + – – + + + – – + – – + + +
NormalizedmRNAexpression
cAMP (500 µM) BMS-466442 (100 nM)
**
*
**
* *
* *
0.0 0.5 1.0 1.5
2.0 UCP1 (Densitometry)
SC DN
– – + – – + + + – – + – – + + + – – + – – + + + – – + – – + + +
*
* * * *
* W B
*
*
0.0 0.2 0.4 0.6
0.8 CKMT2 (Densitometry)
SC DN
– – + – – + + + – – + – – + + + – – + – – + + + – – + – – + + +
*
*
* W
B
*
0.0 0.5 1.0
1.5 PGC1α (Densitometry)
Normalizedopticaldensity
SC DN
– – + – – + + + – – + – – + + + – – + – – + + + – – + – – + + +
* *
* * W
B
*
(A)
0.00 0.05 0.10 0.15
NormalizedmRNAexpression
– – + – – + + + – – + – – + + +
*
*
cAMP (500 µM) BMS-466442 (100 nM)
W B
PGC1α (qPCR)
0.00 0.02 0.04 0.06 0.08
NormalizedmRNAexpression
– – + – – + + + – – + – – + + +
*
* W B
CKMT2 (qPCR)
0.00 0.05 0.10 0.15
NormalizedmRNAexpression
– – + – – + + + – – + – – + + +
*
*
** * W B
UCP1 (qPCR)
0.0 0.5 1.0 1.5
PGC1α (Densitometry)
Normalizedopticaldensity
– – + – – + + + – – + – – + + +
*
* W B
0 1 2 3
CKMT2 (Densitometry)
– – + – – + + + – – + – – + + +
**
* W B
0.0 0.5 1.0 1.5
UCP1 (Densitometry)
– – + – – + + + – – + – – + + +
* *
*
* W B
(B)
(C)
(D)
Primary Adipocytes
SGBS Adipocytes
– – + –
– +
+ + –
+ –
+ + +
– – –
– + –
+ + + –
+ –
+ + + – cAMP (500 µM)
BMS-466442 (100 nM)
CKMT2 32 kDa
55 kDa
UCP1 TUB 47 kDa
PGC1a 91 kDa
– –
SGBS Adipocytes
W B
32 kDa 55 kDa 47 kDa 91 kDa
CKMT2 UCP1 TUB PGC1a
– – + –
– +
+ + –
+ –
+ + +
– –
cAMP (500 µM) BMS-466442 (100 nM)
SC DN
W B W B
Fig. 4.Effect of ASC-1 inhibitor on the expression of thermogenic marker genes in human primary SC, DN, and SGBS adipocytes. (A-B) mRNA and protein expression of peroxisome proliferator-activated receptor gamma coactivator 1-alpha (PCG1a), creatine kinase, mitochondrial 2 (CKMT2), and uncoupling protein 1 (UCP1) detected by RT-qPCR and immunoblotting in human neck adipocytes.n=3 for all groups. (C–D) mRNA and protein expression of PCG1a, CKMT2, and UCP1 detected by RT-qPCR and immunoblotting in SGBS adipocytes. n=3 for all groups. W, white; B, brown differentiation. Statistical analysis was performed by paired t-test, *P<0.05,
**P<0.01.
compared to white ones, similarly to UCP1 (Fig.1A, B). At the protein level, ASC-1 expression was either not different or moderately higher in white as com- pared to brown adipocytes of DN and SC origin (Fig.1C). ASC-1 was described earlier as a cell surface marker of white adipocytes in humans and mice
[26,46]. In mice, its presence in a subpopulation of subcutaneous preadipocytes of adolescent adipose tis- sue and in differentiating preadipocyte cell lines could even inhibit beige differentiation [47]. In a human study, slightly more ASC-1 mRNA was detected in SC white tissue samples obtained by needle biopsies from
0.0 0.5 1.0 1.5
Complex I (Densitometry)
Normalizedopticaldensity
SC DN
cAMP (500µM) BMS-466442 (100 nM)
– –
+ –
– + + +
– –
+ –
– + + +
– –
+ –
– +
+ +
– –
+ –
– +
+ + W
B
*
*
*
*
*
*
*
*
0.0 0.2 0.4 0.6
Complex II (Densitometry)
SC DN
– –
+ –
– +
+ +
– –
+ –
– +
+ + – –
+ –
– +
+ +
– –
+ – – +
+ + W
B
*
*
*
*
*
*
*
BMS-466442 (100 nM) cAMP (500µM)
Normalizedopticaldensity
0.0 0.5 1.0 1.5
Complex IV (Densitometry)
SC DN
– –
+ –
– +
+ +
– –
+ –
– +
+ + – –
+ –
– +
+ +
– –
+ – – +
+ + W
B
*
*
*
*
*
*
*
BMS-466442 (100 nM) cAMP (500µM)
Normalizedopticaldensity
0.0 0.5 1.0 1.5
Complex III (Densitometry)
SC DN
– –
+ – – +
+ +
– –
+ – – +
+ + – –
+ –
– +
+ +
– –
+ –
– +
+ + W
B
0.0 0.5 1.0 1.5 2.0
Complex V (Densitometry)
SC DN
– –
+ –
– + + +
– –
+ –
– + + +
– –
+ –
– +
+ +
– –
+ –
– + + + W
B
(A) (B)
(C) (D)
(E) (F )
29 kDa
55 kDa
II–SDHB
TUB III–UQCRC2 48 kDa
V–ATP5A 54 kDa
IV–COX II I–NDUFB8 18 kDa
22 kDa
SC DN
W B W B
– + –
+ + +
cAMP (500 µM) –
BMS-466442 (100 nM)
– –
+ –
+ + +
– –
– + –
+ + +
– –
– + –
+ + +
– –
Fig. 5.Effect of ASC-1 inhibitor on the protein expression of mitochondrial complex subunits in primary SC and DN adipocytes. (A) Expression of mitochondrial complex subunits detected by immunoblotting. (B-F) Quantification of complex I-V immunoblotting by densitometry;n=3. W, white; B, brown differentiation. Statistical analysis was performed by pairedt-test,*P<0.05