IMAGING VIGNETTE
On-Line Visualization of
Ischemic Burden During Repetitive Ischemia/Reperfusion
Noemi Pavo, MD, MSC,*Maximilian Y. Emmert, MD, PHD,yzZoltán Giricz, MD,xZoltán V. Varga, MD,x Hendrik Jan Ankersmit, MD,jjGerald Maurer, MD,*Simon P. Hoerstrup, MD, PHD,yz
Péter Ferdinandy, MD, PHD,x{Joseph C. Wu, MD, PHD,#Mariann Gyöngyösi, MD, PHD*
ISCHEMIA/REPERFUSION (I/R) INJURY-INDUCED ALTERATIONS IN SARCOLEMMAL AND SARCOPLASMIC RETICULAR ION TRANSPORTresult in typical changes in the electrical activity of myocardial cells that are manifested in surface and intracardiac electrocardiograms. Myocardial ischemia results in a progressive loss of the amplitude of the monophasic action potential, as evidenced by decreased endocardial unipolar voltage. To carry out in vivo on-line visualization, quantification, and explorative analysis of I/R injury and ischemic conditioning of the heart (1), we measured endomyocardial unipolar voltage with an endocardial mapping catheter (NOGA STAR, Johnson & Johnson, New Brunswick, New Jersey) (2) during 3 cycles of 10-min coronary occlusion/reperfusion in a closed chest I/R model in swine. Our goal was to simulate the ischemic burden of the human myocardium during repetitive episodes of angina pectoris. Here we display on-line regional unipolar voltage maps of the ischemia-affected myocardium (area mapping) and demonstrate immediate changes in unipolar voltage values taken from a single endocardial location within the ischemic area (single location mapping) during I/R.
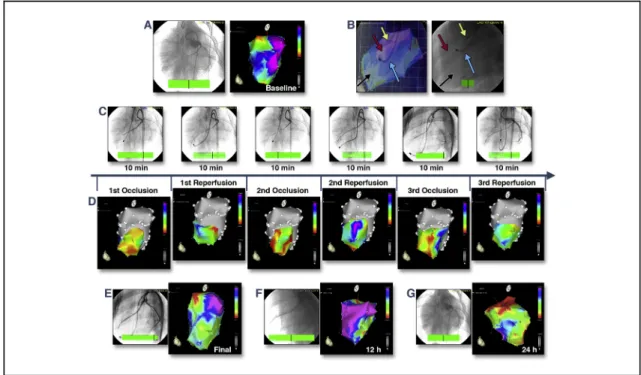
Domestic pigs (n¼5) underwent baseline electroanatomical mapping (Online Video 1) and cardiac cathe- terization (Figures 1A and 1B) followed by 3 cycles of 10-min I/R via percutaneous intracoronary balloon inflation/deflation of the mid-left anterior descending coronary artery (Figure 1C). All animal investigations conformed to the “Position of the American Heart Association on Research Animal Use,” adopted by the American Heart Association on November 11, 1984. After baseline mapping of the left ventricle, ischemic burden was displayed by moving the NOGA STAR catheter within the ischemia-affected mid-distal anteroseptal area between the 5th and 10th min of the ischemia or reperfusion (Figure 1C). The voltage values of the ischemic area immediately decreased during repetitive occlusion without normalizing during reperfusion; the ischemic burden persisted after thefinal reperfusion (Figure 1D), at 12 h (Figure 1E), and at 24 h (Figure 1F), despite the restoration of normal coronary bloodflow.
From the *Department of Cardiology, Medical University of Vienna, Vienna, Austria;ySwiss Center for Regenerative Medicine, University Hospital and University of Zurich, Zurich, Switzerland;zClinic for Cardiovascular Surgery, University Hospital Zurich, Zurich, Switzerland; xDepartment of Pharmacology and Pharmacotherapy, Semmelweis University, Budapest, Hungary;
jjDepartment of Surgery, Medical University of Vienna, Vienna, Austria;{Pharmahungary Group, Szeged, Hungary; and the
#Stanford Cardiovascular Institute and Department of Medicine, Division of Cardiology, Stanford University School of Medicine, Stanford, California. All animal investigation conformed to the“Position of the American Heart Association on Research Animal Use,”adopted by the American Heart Association on November 11, 1984. This work was supported by funding from the Ludwig Boltzmann Institute, Cluster for Cardiovascular Research, and by National Institutes of Health grants HL093172 and HL095571 (Dr. Wu). Dr. Ferdinandy is the owner of Pharmahungary. All other authors have reported that they have no relationships relevant to the contents of this paper to disclose.
J A C C : C A R D I O V A S C U L A R I M A G I N G V O L . 7 , N O . 9 , 2 0 1 4
ª2 0 1 4 B Y T H E A M E R I C A N C O L L E G E O F C A R D I O L O G Y F O U N D A T I O N I S S N 1 9 3 6 - 8 7 8 X / $ 3 6 . 0 0 P U B L I S H E D B Y E L S E V I E R I N C . h t t p : / / d x . d o i . o r g / 1 0 . 1 0 1 6 / j . j c m g . 2 0 1 4 . 0 3 . 0 1 9
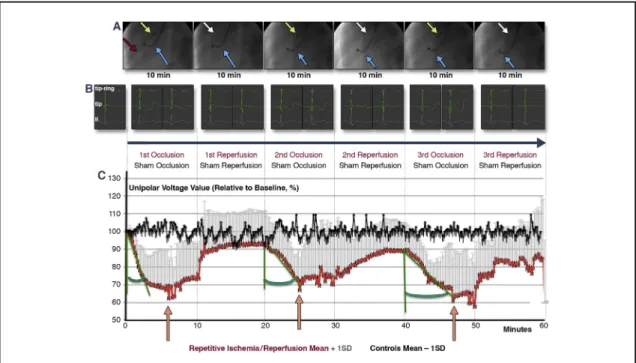
We recorded the unipolar voltage of a single stable distal anterior left ventricular location within the ischemic area during the I/R cycles without changing the location of the NOGA STAR catheter tip (n ¼7), and compared these data to measurements from sham-procedure animals (n ¼ 3) (Figure 2A). Surface and intracardiac electrocardiograms were continuously monitored (Figure 2B and Online Video 2). Due to the developing hypokinesia within the ischemic area, the amplitude of the endocardial catheter movement decreased, and the direction changed (Online Video 2). The unipolar voltage values of the stable myocardial location decreased rapidly during the first occlusion, while the second and third occlusions led to a less rapid decline in unipolar voltage (Figure 2C). By contrast, repetitive ischemia resulted in lower minimum unipolar voltage signals after the third ischemic attack. Interestingly, during permanent occlusion of the artery, unipolar voltage values increased slowly after approximately 5 min of ischemia.
In addition to providing basic scientific information on electrical signals of myocardium during ischemia and reperfusion, this method offers in vivo on-line visualization and immediate assessment of the extent of ischemic injury, as well as the efficacy of protective approaches against it, including pharmacological or ischemic conditioning, therapeutic hypothermia, and cardioplegia. Furthermore, this method allows for investigation of electrophysiologic state of the myocardium during pathological conditions affecting the heart (e.g., sepsis) in an animal model ready for clinical translation.
FIGURE 1 Real-Time In Vivo Visualization of Ischemic Burden During Myocardial I/R and at 12-h and 24-h Follow-Up
(A)Baseline coronary angiography(left)and NOGA unipolar voltage map before induction of ischemia(right). Normal areas appear inblue and purple; the mitral valve area appears as a normalred(Online Video 1).(B)Images from angiography and electroanatomical mapping (left oblique projection) are overlaid(left). The mapping catheter(blue arrow)was positioned in the left ventricle and measured actual unipolar voltage values of the ischemic anteroseptal area(black arrow). A guidewire(red arrow)and coronary balloon(yellow arrow)were placed in the mid-left anterior descending coronary artery(right).(C)Repetitive myocardial ischemia and reperfusion were caused by repetitive (310 min) inflation or deflation of the coronary balloon,(D)corresponding changes in the unipolar voltage of the ischemic mid-distal anteroseptal area during repetitive (310-min cycles) coronary occlusion and reperfusion.Red, low-voltage areas;yellow and green, reduced voltage;purple and blue, normal electrical activity. Occlusion of the coronary artery resulted in an immediate decrease of the voltage values of the ischemic area, without normalizing during reperfusion.(E to G)Unipolar voltage maps and coronary angiography 10 min afterfinal reperfusion(E), at 12 h(F), and at 24 h(G)show persistence of the ischemic burden despite an open coronary artery and normal bloodflow. I/R¼ischemia/
reperfusion.
J A C C : C A R D I O V A S C U L A R I M A G I N G , V O L . 7 , N O . 9 , 2 0 1 4 Pavoet al.
S E P T E M B E R 2 0 1 4 : 9 5 6–8 Real-Time Visualization of Ischemic Burden
957
REPRINT REQUESTS AND CORRESPONDENCE:Dr. Mariann Gyöngyösi, Department of Cardiology, Medical University of Vienna, Waehringer Guertel 18-20, A-1090, Vienna, Austria. E-mail: mariann.gyongyosi@
meduniwien.ac.at.
R E F E R E N C E S
1.Hausenloy DJ, Erik Bøtker H, Condorelli G, et al. Translating cardioprotection for patient benefit: position paper from the Working Group of Cellular Biology of the Heart of the European Society of Cardiology. Cardiovasc Res 2013;98:7–27.
2.Gyöngyösi M, Dib N. Diagnostic and prognostic value of 3D NOGA mapping in ischemic heart dis- ease. Nat Rev Cardiol 2011;8:393–404.
KEY WORDS electroanatomical mapping, ischemia/reperfusion injury, ischemic burden
APPENDIX For supplemental videos and their legends, please see the online version of this article.
FIGURE 2 Intracardiac Unipolar Voltage of a Single Stable Mapping Location During Repetitive I/R
(A)Repeated (310-min cycles) inflation(yellow arrow)and deflation(white arrow)of the coronary balloon catheter in the mid-left anterior descending coronary artery(red arrow: guidewire)and recording of unipolar voltage signals with an endocardial NOGA mapping catheter(blue arrow)placed in a stable endocardial location.(B)Intracardiac bipolar (tip-ring), unipolar (ring), and surface (lead II) electrocardiograms (ECGs) during repetitive ischemic/reperfusion (I/R) (recorded at 3 min and at the end of the corresponding cycle). Profound changes occurred in the intracardiac ECGs, with no obvious ischemic ECG signs in the surface ECGs (Online Video 2).(C)Unipolar voltage of a stable single location measured continuously within the ischemia-affected area, which was subjected to repetitive ischemia/reperfusion(red line), or at the same location in control animals(black line). The unipolar voltage values of the stable myocardial location decreased rapidly during thefirst oc- clusion, whereas the second and third occlusions led to a less rapid decline in unipolar voltage (increasinggreen angle). By contrast, repetitive ischemia resulted in lower minimum unipolar voltage signals after the third ischemic attack, whereas voltage increased after 6, 5, and 7 min of occlusion, respectively(pink arrows). Brief decreases in voltage occurred immediately after the start of the third reperfusion, suggesting reperfusion injury.
Pavoet al. J A C C : C A R D I O V A S C U L A R I M A G I N G , V O L . 7 , N O . 9 , 2 0 1 4
Real-Time Visualization of Ischemic Burden S E P T E M B E R 2 0 1 4 : 9 5 6–8
958