R E S E A R C H A R T I C L E
Plasma phospholipid profiling of a mouse model of anxiety disorder by hydrophilic interaction liquid chromatography coupled to high ‐ resolution mass spectrometry
Róbert Berkecz
1 |Tímea Körmöczi
1 |Ferenc Tömösi
1 |Viktor Szegedi
2 |János Horváth
2 |Nóra Kovács
1 |Tamás Janáky
11Department of Medical Chemistry, Faculty of Medicine, University of Szeged, Szeged, Hungary
2Department of Physiology, Anatomy and Neuroscience, University of Szeged, Szeged, Hungary
Correspondence
Róbert Berkecz, Department of Medical Chemistry, Faculty of Medicine, University of Szeged, Szeged, Hungary.
Email: berkecz.robert@med.u‐szeged.hu Funding information
EU‐funded Hungarian, Grant/Award Number:
EFOP‐3.6.1‐16‐2016‐00008; János Bolyai Research Scholarship of the Hungarian Acad- emy of Sciences
Abstract
Glycerophospholipids (PLs), as amphipathic small molecules and the main constituents of biolog- ical membranes, play an important role in several cellular processes, even though their accurate identification from complex biological samples remains a challenge. In this paper, we report a fast and comprehensive HILIC‐ESI‐MS method for the analysis of glycerophospholipid classes using high‐resolution mass spectrometry in negative mode. The final method enabled the quantitative analysis of 130 endogenous PL species in mouse plasma. The application of the method devel- oped was to find differences of plasma PL composition in a mouse model of anxiety disorder.
In the case of four PL classes and 35 PL species, significant differences were observed comparing low anxiety‐related behavior with high anxiety‐related behavior groups. The most characteristic trend was up‐regulation in both the PL classes and PL species, and decreases were only detected in two phosphatidylcholines among 35 species in mice having elevated anxiety.
K E Y W O R D S
anxiety disorder, chromatography, lipidomics, mass spectrometry, phospholipid, plasma
1
|I N T R O D U C T I O N
Lipidomics as a rapidly growing field of metabolomics aims at targeted or comprehensive analysis of lipid content of biological samples such as tissues, cells, plasma, etc. (Dennis, 2009; Hanash, 2003; Sandra, dos Santos Pereira, Vanhoenacker, David, & Sandra, 2010; Van der Greef et al., 2007). Lipids a main group of biomolecules owing to their essential physiological roles such as energy storage enzyme cofactors, emulsify- ing agents, vitamins, hormones, intercellular messengers and structural components of cell membranes (Fahy et al., 2005). Disturbances in lipid
metabolism can be related to a variety of diseases, for instance, obesity, diabetes, some cancer types, Alzheimer's disease (Cífková et al., 2017;
Forouhi et al., 2014; Goto‐Inoue et al., 2013; Kosicek & Hecimovic, 2013; Tania, Khan, & Song, 2010). Structurally, lipids have been classi- fied into eight categories: fatty acyls, glycerolipids, saccharolipids, polyketides, sterol lipids, prenol lipids, sphingolipids and glycerophospholipids (PLs). PLs are subdivided into different classes according to the head group: phosphatidylcholines (PCs), phosphatidyl- ethanolamines (PEs), phosphatidylinositols (PIs), phosphatidylserines (PSs), phosphatidyl‐glycerols (PGs) and phosphatidic acids (PAs). The phosphate group is bound to the glycerol backbone at thesn‐3 position.
Additional hydroxy groups of glycerol are esterified with the carboxyl groups of the two fatty acid chains at positionssn‐1 andsn‐2. However, in the case of lysophospholipids (LPLs), only one fatty acid chain is attached to glycerol backbone. The PL classes are further subdivided into three subclasses, phosphatidyl, plasmanyl and plasmenyl, corre- sponding to the ester, alkyl ether and vinyl ether linkages, respectively.
Nevertheless, the alkyl ether and vinyl ether linkages can be observed mainly in PC and PE classes (Fahy et al., 2005, 2009).
Abbreviations:AX, high anxiety‐related behavior; ESI, electrospray ionization;
HILIC, hydrophilic interaction liquid chromatography; LPC, lysophosphatidylcholine;
LPE, lysophosphatidylethanolamine; LPL, lysophospholipid; ME, matrix effect;
nAX, low anxiety‐related behavior; OPLS‐DA, orthogonal partial least square discriminant analysis; PA, phosphatidic acid; PC, phosphatidylcholine; PE, phosphatidylethanolamine; PEFF, process efficiency; PG, phosphatidyl glycerol;
PI, phosphatidylinositol; PL, glycerophospholipid; PS, phosphatidylserine; RE, extraction recovery; SM, sphingomyelin.
DOI: 10.1002/bmc.4202
Biomedical Chromatography. 2018;32:e4202.
https://doi.org/10.1002/bmc.4202
Copyright © 2018 John Wiley & Sons, Ltd.
wileyonlinelibrary.com/journal/bmc 1 of 9
Chromatographic methods such as gas chromatography (GC) and thin layer chromatography have been applied routinely for the detec- tion of PLs in decades. Nowadays, however, two basic strategies are used, namely mass spectrometry (MS) based analysis with direct infu- sion, called the ‘shotgun’ method, and liquid chromatography–mass spectrometry; (LC‐MS; Korte & Casey, 1982; Peterson & Cummings, 2006; Ahn, Kim, Chung, Kong, & Moon, 2008; Ivanova, Milne, Myers,
& Brown, 2009; Sandra et al., 2010; Harkewicz & Dennis, 2011; Pati, Nie, Arnold, & Cummings, 2016). In recent years, matrix‐assisted laser desorption/ionization mass spectrometry imaging has become a tool of choice for the analysis of endogenous lipids to explore their morpho- logical and/or pathological characteristics directly from tissue slices (Schubert, Weiland, Baune, & Hoffmann, 2016). Recently, the applica- tion of ultra‐high‐performance supercritical fluid chromatography coupled to mass spectrometry has also been an emerging hyphenated technique in the field of lipidomics (Lísa & Holčapek, 2015). LC sep- aration of lipids can be achieved by (a) reversed‐phase LC, which achieves the separation of lipid species according to the length and degree of unsaturation of the fatty acyl chain, and (b) normal‐phase LC and hydrophilic interaction liquid chromatography (HILIC), which enables the separation of lipid classes based on the hydrophilic func- tionalities of lipids. HILIC is considered to be a variant of normal‐ phase chromatography and allows the analysis of charged substances with an MS‐friendly reversed‐phase solvent system. The mobile phase with high organic content (>80%) applied in HILIC improves electrospray ionization (ESI) through a more efficient mobile phase desolvation and compound ionization. In lipidomics, the HILIC mode can provide an efficient tool for the qualitative and quantitative anal- ysis of lipids, in particular, PLs. The reason for this is that lipid species and the applied internal standard (IS) of the given lipid class are co‐ eluting or eluting within a narrow time window. Consequently, this method facilitates the identification of PLs and provides the most reliable quantification data because of the almost identical matrix effect during the ionization process (Cífková et al., 2012; Cífková, Hájek, Lísa, & Holčapek, 2016; Pati et al., 2016;Řezanka, Siristova, Matoulková, & Sigler, 2011).
Anxiety disorders are the most common form of mental illness with a prevalence of 1% in Western countries (Horváth, Barkóczi, Müller, & Szegedi, 2015). Animal models of anxiety usually involve a number of inbred strains, which significantly differ in their incidence of anxiety‐related behaviors. These are classified as high‐anxiety‐like, medium‐anxiety‐like or low‐anxiety‐like trait strains (Crawley, 2008).
Some strains were selectively bred for extremes in trait anxiety, resulting in two clearly distinct mouse lines even after six generations:
hyperanxious mice and hypoanxious mice (Ditzen et al., 2006). Two mouse lines with extremes in their anxiety‐related phenotype have been established by Géza Müller, ex‐head of the animal facility of Egis Pharmaceuticals using an intra‐strain and a selective bidirectional inbreeding approach that led to an accumulation of genetic material associated with the respective anxiety phenotype. The two lines–high anxiety‐related behavior (AX) and the low anxiety‐related behavior (nAX) mice–derived from an NMRI outbred strain were developed for other research lines. They have been established as animal models for extremes in locomotion‐independent trait anxiety using a number of behavioral paradigms, such as open‐field test, elevated plus maze
test and light–dark test (Horváth, Szögi, Müller, & Szegedi, 2013;
Szegőet al., 2010).
The goals of this study were the characterization of the plasma PL composition of the nAX and AX mouse strains using HILIC‐ESI‐MS methods and the identification of significant alterations in the plasma PL compositions.
2
|M A T E R I A L S A N D M E T H O D S 2.1
|Animals and plasma collection
Inbred mouse strains having either AX or nAX were bred in our animal facility. These strains were originally developed at EGIS Pharmaceuti- cals Co. (Budapest, Hungary) by bidirectional inbreeding based on anticipatory anxiety (Szegőet al., 2010). Male mice of 2.5–3 months were housed individually under a light/dark 12 h cycle (lights on at 08:00) at 24 ± 1°C temperature and givenad libitumfood and water.
For the experiments, 80–85th generations were used. For plasma collection, K3 EDTA‐containing 3 mL tubes (BD Vacutainer®, Becton Dickinson, Franklin Lakes, NJ, USA) were used to prevent coagulation (Argmann & Auwerx, 2006). The study was in compli- ance with EU directive 2010/63/EU and was approved by the regional Station for Animal Health and Food Control under Project License XXXI/2012.
2.2
|Chemicals and standards
Water, methanol, ammonium formate (all LC‐MS grade), n‐hexane and chloroform (HPLC grade) were purchased from VWR (Radnor, USA). GC‐MS grade acetone was purchased from Merck (Darmstadt, Germany); LC‐MS grade 2‐propanol was purchased from Fluka (Buchs, Switzerland). 1‐Heptadecanoyl‐2‐hydroxy‐sn‐ glycero‐3‐phosphate (sodium salt) (LPA 17:0), 1,2‐diheptadecanoyl‐ sn‐glycero‐3‐phosphate (sodium salt) (PA 17:0/17:0), N‐lauroyl‐D‐ erythro‐sphingosylphosphorylcholine (SM d18:1/12:0), 1‐myristoyl‐ 2‐hydroxy‐sn‐glycero‐3‐phospho‐(1′‐rac‐glycerol) (sodium salt) (LPG 14:0), 1,2‐diheptadecanoyl‐sn‐glycero‐3‐phospho‐(1′‐rac‐glyc- erol) (sodium salt) (PG 17:0/17:0), 1‐nonadecanoyl‐2‐hydroxy‐sn‐ glycero‐3‐phosphocholine (LPC 19:0), 1,2‐dimyristoyl‐sn‐glycero‐3‐ phosphocholine (PC 14:0/14:0), 1,2‐diheptadecanoyl‐sn‐glycero‐3‐ phospho‐L‐serine (sodium salt) (PS 17:0/17:0), N‐lauroyl‐D‐erythro‐ sphingosine (CER d18:1/12:0), 1‐myristoyl‐2‐hydroxy‐sn‐glycero‐3‐ phosphoethanolamine (LPE 14:0) and 1,2‐diheptadecanoyl‐sn‐ glycero‐3‐phosphoethanolamine (PE 17:0/17:0) as ISs were purchased from Avanti Polar Lipids (Alabaster, USA).
The lipid nomenclature and abbreviations follow the LIPID MAPS structure database system (Fahy et al., 2009; Liebisch et al., 2013).
2.3
|Sample preparation
Lipid extracts from mouse plasma were prepared according to a mod- ified Folch procedure (Folch, Lees, & Sloane Stanley, 1957). Prior to extraction of plasma, 10μL lipid standard mixture (125 pmol/μLPC 14:0/14:0, 125 pmol/μL LPC 19:0, 50 pmol/μL PE 17:0/17:0,
30 pmol/μLLPE 14:0, 2 pmol/μLPG 17:0/17:0, 5 pmol/μLLPG 14:0, 50 pmol/μL PA 17:0/17:0, 50 pmol/μL LPA 17:0, 50 pmol/μL PS 17:0/17:0, 125 pmol/μL SM d18:1/12and 15 pmol/μLCER d18:1/
12:0) was added to 10 μL of plasma sample. Briefly, after vortex mixing, 5μL of butylated hydroxytoluene (2 mg/mL in ethanol) and 450μL of chloroform–methanol (2:1, v/v) were added followed by vor- tex mixing and then the mixture was shaken for 15 min at room tem- perature. After addition of 115μL of ammonium formate (50 mM) the sample was vortexed for 20 s. Upon 5 min of incubation at room tem- perature, the sample was centrifuged at 1000gfor 10 min. A 200μL aliquot of the lower phase was collected and the upper phase was re‐extracted with 200μL of chloroform. After centrifugation, 300μL of the lower phase was combined with the first portion of organic phase and was dried under nitrogen at ambient temperature. For LC‐ MS measurements, the dried extracts were dissolved in 100μL of chlo- roform–methanol (2:1, v/v).
Matrix effect (ME), extraction recovery (RE) and process efficiency (PEFF) were evaluated by the experimental techniques described by Matuszewski, Constanzer, and Chavez‐Eng (2003) and Cappiello et al. (2008). All three parameters were evaluated with the above‐men- tioned lipid standard mixture in three replicates.
2.4
|LC ‐ MS conditions
LC‐MS analysis was performed using a Waters Acquity I‐Class UPLC™ (Waters, Manchester, UK) equipped with a binary solvent manager, autosampler and column manager. The UHPLC system was coupled to a Thermo Scientific Q Exactive Plus hybrid quadrupole–Orbitrap (Thermo Fisher Scientific, Waltham, MA, USA) mass spectrometer.
The final LC‐MS method for the analysis of phospholipids was the following: Kinetex HILIC column (150 × 2.1 mm, 2.6μm, 100 Å, Phenomenex, Torrance, CA, USA), injection volume 10μL and column temperature 50°C. Mobile phase A was ammonium formate (50 mM) and eluent B was acetone. The following gradient program was used:
0 min, 97% B; 7 min, 70% B; 8 min, 50% B; 10 min, 50% B; 11 min, 97% B; and 15 min, 97% B. The flow rate was 0.4 mL/min during the analysis. The injector needle was washed with a hexane–2‐propanol– water (2:2:0.1, v/v/v) mixture after each injection.
The mass spectrometer was operated in the negative‐ion mode using a heated ESI source with the following conditions: capillary tem- perature, 250°C; S‐Lens RF level, 50; spray voltage, 2.5 kV; sheath gas flow, 45; sweep gas flow, 2; auxiliary gas flow, 10; full scan with a mass range of 100–1000; and a resolution of 35,000. The automatic gain control setting was defined as 3 × 10⁶charges and the maximum injec- tion time was set to 100 ms.
2.5
|Data processing
The LC system was controlled with MassLynx 4.1 SCN 901 (Waters, Milford, MA, USA). The MS system and MS data acquisition control were conducted by Xcalibur™4.0 software (Thermo Fisher Scientific, Waltham, MA, USA). The bio‐informatics of UHPLC‐MS data was processed using Progenesis QI version 2.1 (Nonlinear Dynamics, Newcastle, UK). Raw data files were directly imported into Progenesis QI where retention time alignment, peak picking, deconvolution of
adducts, absolute abundance and preliminary identification with LipidBlast database (Kind et al., 2013) were performed. The processed data generated from Progenesis QI, which included peak area, m/z value and retention time, were imported into Microsoft Excel software for normalization of peak area, which was based on calculation of the analyte/IS peak area ratios. The identification of lipid species was accomplished via accurate mass (<5 ppm) database searching of LIPID MAPS and a homemade database based on our own measurements (LC‐MS and LC‐MS/MS) and literature sources (Holčapek et al., 2015; Jia, Wang, Kong, Cai, & Xu, 2006; Ma et al., 2016;
Quehenberger et al., 2010; Rabagny, Herrmann, Geisel, Kirsch, &
Obeid, 2011; Sud et al., 2007). The prediction of retention times was based on the retention behavior of PL classes in relation to the polar headgroup. The normalized data obtained this way, including the nor- malized peak area and the abbreviation of identified lipids, were exported into SIMCA software 14.1 (Umetrics, Umeå, Sweden) in order to perform supervised orthogonal partial least square discrimi- nant analysis (OPLS‐DA). The corresponding S‐plots allowed the pre- diction of significant features (potential biomarkers) whose change is related to the AX mouse model. Box plots and column diagrams with standard error (SE) were used to represent data and the differences between the nAX and AX mice were assessed with t‐test using GraphPad Prism 5 statistical software (GraphPad Software, Inc., La Jolla, CA, USA). In related data, significancep‐values are *≤0.05,
**p≤0.01 and ***p≤0.001.
3
|R E S U L T S A N D D I S C U S S I O N
A set of 11 CER and PL standards representing one CER, one PG, one LPG, one PE, one PS, one PA, one LPE, one LPA, one PC, one SM and one LPC was used for the optimization of LC‐MS conditions.
Chromatographic and mass spectrometric analysis and data processing were optimized to improve separation, sensitivity, identification and quantification of PL molecular species. During optimization the MS sensitivity, chromatographic resolution of PL classes within short anal- ysis time was the main aspects because of the wide range of abun- dances of individual species. The final LC‐MS methods were applied for the identification of PL molecular species in mouse plasma and pro- filing the plasma PLs in mouse model of anxiety disorder.
3.1
|Optimization of LC ‐ MS method
Micro‐bore columns with porous shell particles can provide a good res- olution of lipid classes in HILIC mode. Therefore, a Kinetex HILIC col- umn was selected for the separation of the PL classes (Cajka & Fiehn, 2014; Lísa, Cífková, & Holčapek, 2011). The large number of PL species in a plasma sample makes their qualitative and quantitative analysis complicated, thus a longer column (150 mm) was selected to improve separation. The mobile phase composition plays a critical role in the separation in HILIC mode. Three types of eluent B were investigated –as methanol, acetonitrile and acetone. For all compounds, low reten- tion times were observed for using methanol. A comparison of the chromatographic resolutions of lipid classes in plasma sample shows that the highest retention and ionization efficiency were observed
with acetone for PCs, SMs and LPCs. In HILIC mode, the retention is driven by partitioning the analytes between a water‐enriched layer of stagnant eluent on stationary phase and the water‐deficient mobile phase. Therefore, the concentration of water in the mobile phase, in particular, under the initial condition, is crucial (Alpert, 1990;
Hemström & Irgum, 2006; Naidong, 2003). In our method, using ace- tone as B eluent, the minimum amount of 3% (v/v) water in the mobile phase was found to be sufficient for obtaining reproducible retention and reasonable separation of PL classes. The presence and concentra- tion of mobile phase additives affect the retention, separation and MS detection of ionizable compounds (Buszewski & Noga, 2012). The effects of additives in eluent A on the retention behavior and selectiv- ity of PLs were studied for ammonium acetate and formate. The type of buffer did not have a significant influence on the retention and sep- aration of PLs. Because of the higher volatility during MS analysis, the ammonium formate salt was selected for further optimization. The ion- ization efficiency of PLs strongly depends on the salt concentration of the mobile phase (Lísa et al., 2011). A 50 mM concentration of ammoium formate in eluent A provided the best separation of PLs and an acceptable ion suppression in MS detection. The effect of col- umn temperature had a negligible effect on the temperature range of 40–60°C. The selection of 50°C was the best compromise considering the appropriate system pressure and column life time. Average reten- tion times and peak widths decreased for all PL species with increasing flow rate and it also reduced the peak areas. A flow rate of 0.4 mL/min was chosen in the final method as a compromise between short anal- ysis time, high selectivity and ESI response. The gradient steepness had a slight influence on the resolution of PL classes in HILIC mode (Lísa et al., 2011). With the change in the slope gradient from 0.5 to 3.86, the resolution of the PL classes was reduced by ~20% during the optimization procedure. However, the increase in gradient steep- ness significantly increased the signal‐to‐noise ratio by decreasing peak width and providing a separation of main PL classes within 7 min.
3.2
|Class ‐ related separation of PLs in HILIC mode
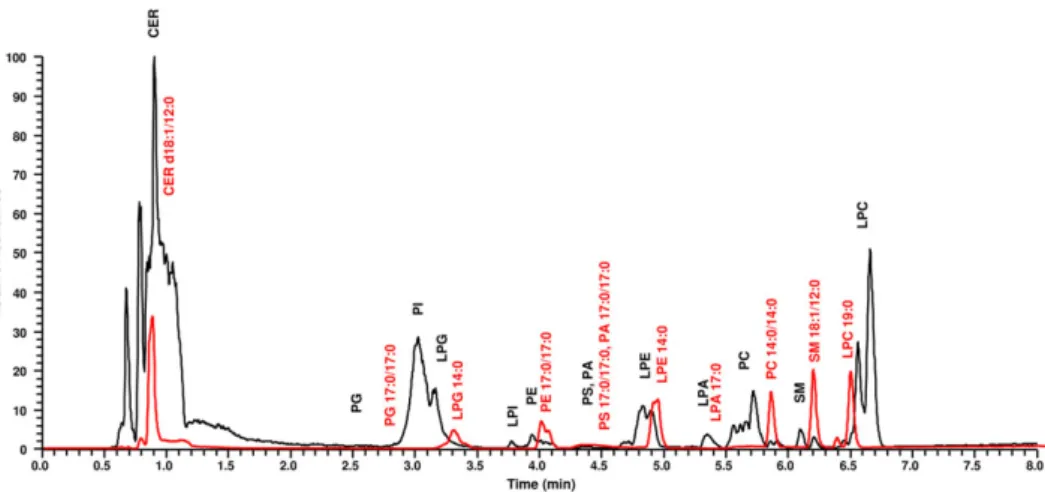
A standard lipid mixture containing 10 lipid species covering seven lipid classes was separated under the final conditions. Figure 1 shows
the base peak chromatogram recorded in negative ion mode where the lipids were detected as [M−H]−and [M + HCOO]−ions depending on head group (Table 1). As forCER d18:1/12:0being the less polar lipid standard without phosphate group, both [M−H]−and more abun- dant [M + HCOO]− ions were detected with the lowest retention (0.83 min) close to void volume. Consequently, a reliable quantification of plasma CERs with the final method was not feasible. Interestingly, LPC 19:0eluted in two peaks with baseline separation at 6.37 and 6.48 min (more abundant). Both peaks showed the same fragment ions but with different ratios of the acyl and parent ions in the MS/MS spectra, which can be explained by the presence of two isomers of LPC 19:0with different bond connectivities. This kind of isomerization can occur through 1, 2 migration of the nonadecanoyl group on the glycerol backbone (Croset, Brossard, Polette, & Lagarde, 2000). A sim- ilar isomerization was also observed forLPE 14:0with higher retention of the majorsn‐1 isomer compared with that of the minorsn‐2 isomer.
From the viewpoint of retention, comparing the contribution of the number of fatty acid chains connected to the glycerol backbone, lyso‐compounds, in general, showed higher retention times within the given lipid class. For example, elution times forLPE 14:0andPE 17:0/17:0were 4.94 and 4.03 min, respectively. For PS 17:0/17:0, PA 17:0/17:0andLPA 17:0, tailing peaks were obtained, which can be attributed to zwitterion formation of phosphorylated serine group of PS and the different deprotonation states of the phosphate group of PAs under the applied chromatographic conditions (Cífková et al., 2016). All PL standards eluted in the range of 2.8–7.0 min, and baseline separation was obtained forPG 17:0/17:0,LPG 14:0,PE 17:0/17:0, LPE 14:0,LPA 17:0,PC 14:0/14:0,SM d18:1/12:0andLPC 19:0.
The application of the final method for the profiling of mouse plasma extract is shown in Figure 1, where 10 PL classes, namely, PG, PI, LPG, LPI, PE, PS, LPE, PC, SM and LPC, were detected. A summary of the number and phospholipid class distribution of identified PL molecular species is presented in Figure 2, while related chromato- graphic and mass spectrometric results are detailed in Table S1. The number of identified PLs was 130 in the mouse plasma. The final method, in some cases, provided separation ofsn‐1 andsn‐2 LPL iso- mers of the LPI, LPE and LPC (Table S1). The most PL molecular species from plasma were analyzed for PE, PC and SM classes. PLs with alkyl
FIGURE 1 Negative‐ion HILIC‐ESI‐MS overlay chromatograms of glycerophospholipid (PL) classes (black line) and PL standards (red line) in mouse plasma
ether and vinyl ether bonds were represented decisively in PE and PC classes. LPC and LPE were predominant compared with other LPLs.
Our method was not satisfactory for identifying PA and LPA because of their relatively low amounts in plasma and peak tailings occurring in HILIC mode.
In quantitative approach, the relative amount of PL species was determined as a percentage by dividing the normalized peak area of PL species by the sum of the normalized peak area of PL species within the class and multiplying the result by 100. Table S2 reveals the quantitative distribution of individual PL species in each PL class.
3.3
|Determination of matrix effect, recovery and process efficiency
For the ESI analysis of an extracted sample, the observed abundance of analyte and the validity of obtained results were strongly influenced by two independent variants, namely RE and ME (Buhrman, Price, &
Rudewicz, 1996). In our work, RE, ME and the related PEFF were determined for all lipid standards using the final method.
Note that, in Figure 3, RE, ME and PEFF were reproducible within the lipid class. The obtained PEFF values of standards indicate the combination of RE and ME. For all lipid standards, the mean of PEFF was 71.8%. The lowest PEFF values were obtained forCER d18:1/
12:0(51.1%) andLPA 17:0(53.7%). In the case ofPS 17:0/17:0, the evaluated PEFF was >100%. Studying RE and ME separately helps to understand their contribution for obtained PEFF (Buhrman et al., 1996). Comparable values of RE with 78% as the mean value were observed for lipid standards, except forLPG 14:0(49.5%). Specifically, the LPLs within each class had lower recovery. ForPS 17:0/17:0, the highest RE value was determined with the lowest reproducibility. Sim- ilar ME values in the range of 84.3–99.4% were found forPG 17:0/
17:0,LPG 14:0, PE 17:0/17:0, PA 17:0/17:0 LPE 14:0, PC 14:0/
14:0,SM d18:1/12:0 and LPC 19:0. For PS 17:0/17:0, ionization enhancement was observed, while ionization suppression was found forCER d18:1/12:0(59% ME) andLPA 17:0(72.6% ME).
3.4
|Profiling of plasma PL molecular species in the mouse model of anxiety disorder
The developed HILIC‐ESI‐MS method was applied for the determina- tion of differences in plasma PL composition between eight nAX and eight AX mice. In general, the analysis of PLs enabled the TABLE 1 Identified PL classes in mouse plasma using the final HILIC‐
ESI‐MS method, retention time ranges and observed ions in ESI‐mode Phospholipid class Retention time (min), range Observed ions, ESI−
PG 2.78–2.84 [M−H]−
PI 2.99–3.18 [M−H]−
LPG 3.24–3.36 [M−H]−
LPI 3.77–3.84 [M−H]−
PE 3.89–4.08 [M−H]−
PS 4.35–4.48 [M−H]−
LPE 4.74–5.06 [M−H]−
PC 5.49–5.86 [M + HCOO]−
SM 5.86–6.21 [M + HCOO]−
LPC 6.47–6.81 [M + HCOO]−
PG, phosphatidylglycerol; PI, phosphatidylinositol; LPG, lysophosphatidylglycerol; LPI, lysophosphatidylinositol; PE, phosphatidyl- ethanolamine; PS, phosphatidylserine; LPE, lysophosphatidylethanolamine;
PC, phosphatidylcholine; SM, sphingomyelin; LPC, lysophosphatidylcholine.
FIGURE 2 Distribution of identified endogenous PL species by PL classes in mouse plasma
FIGURE 3 PL standards extraction recovery (blue column), matrix effect (green column) and process efficiency (purple column) in mouse plasma. From the peak areas acquired from these calibration plots, the matrix effect percentage, extraction recovery and process efficiency can be calculated as follows:
extraction recovery (%) =C/B× 100; matrix effect (%) =B/A× 100; process efficiency (%) = C/A× 100 whereArepresents the average peak area of the standard solution,B represents the average peak area of a plasma extract spiked at the same concentration of the standard andCrepresents the average peak area of a plasma pre‐spiked at the same concentration of the standard
quantification of 130 endogenous PL species. Namely, four species of PG, 13 species of PI, three species of LPG, six species of LPI, 19 species of PE, seven species of PS, 14 species of LPE, 24 species of PC, 25 species of SM and 15 species of LPC were quantified.
The individual lipid classes were quantified by the sum of all normal- ized peak areas of all endogen PLs. Figure 4 demonstrates the signif- icant alteration of the normalized peak areas of individual PL classes in plasma of the nAX and AX groups. Median, minimum, maximum, upper and lower quartiles of the dataset are shown in Figure 4.
For PI, LPE, SM and LPC classes, significant up‐regulation was observed in a uniform manner in AX mice. According to normalized peak areas, the largest fold changes were found in PI (1.33) and LPE (1.33) classes. In the case of LPC and SM, the positive changes in the mean of normalized peak areas were 24 and 11% in the AX group. Other plasma PL classes did not change significantly.
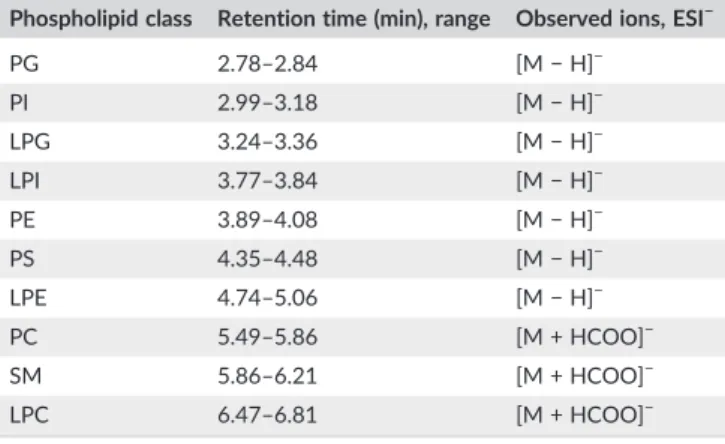
Multivariate data analyses of normalized peak areas of all PL species in nAX and AX mice were performed first using the SIMCA software and then the identified PL species with significant changes found were re‐evaluated and plotted by the GrahPad software.
OPLS‐DA was used to single out the statistically and potentially sig- nificant PL species responsible for differences among nAX and AX mice. The OPLS‐DA and S‐plot enabled the identification of such statistically significant PLs and their regulation in the analyzed sam- ples (Wiklund et al., 2008). The generated principal component anal- ysis plot and OPLS‐DA score plot of 130 quantified PL species demonstrates the different clustering of nAX and AX samples (Figure 5). The related S‐plot shows the contribution of PL species for clustering of the obtained OPLS‐DA. From the S‐plot of OPLS‐ DA, 35 plasma PL species with significant differences (p ≤ 0.05) were found between the nAX and AX group (Figure 5). The most pronounced trend was a significant up‐regulation for 33 PLs, while only two compounds,PC 42:6andPC 38:4, were found to be signif- icantly down‐regulated in the AX group. The maximum observed fold change between the nAX and AX group was 4.55 for PI 32:1, whereas >2‐fold changes were found for PI 36:5, LPE 16:1 and LPE 20:5(Table 2). Changes in the means of normalized peak areas
between 50 and 100% were detected for 11 compounds, namely for PI 34:3,PI 40:5,PI 40:4,LPI 22:6,LPE 18:1,LPE 20:1,LPE 16:0, LPE 18:3,PC 42:6,LPC 16:1andLPC 22:4 (Table 2). Table 2 reveals that PL species containing unsaturated fatty acids were predominant in 31 of 35 species, and the number of PLs with polyunsaturated FAs was 16 of 31 PLs. The most up‐regulated species were LPEs and PIs (Figure 5b). Figure 6 illustrates the comparison of relative FIGURE 4 Box plot describing the significant different PL classes in
low anxiety‐related behavior (nAX; blue box plot) and high anxiety‐ related behavior (AX; orange box plot) mouse in plasma
FIGURE 5 Multivariate data analysis of relative abundances of all plasma PL species in nAX and AX mouse: (a) principal component analysis plot, (b) OPLS‐DA plot and (c) the S‐plot of supervised OPLS‐DA method
abundances of LPEs and PIs (p≤0.05) in the nAX and AX groups.
The sum of the normalized peak areas of LPEs (p ≤ 0.05) was
>98% of total LPEs while only 34% was found for PIs (p ≤ 0.05).
This was due to the most abundant PI 38:4 (62% of total PI) in plasma, which did not change significantly. The direction of change in the individual plasma LPCs was positive in all cases, but the observed fold change was lower than in LPEs (Table 2). The plasma SMs that were significantly altered between the two groups, such as SM 34:2,SM 42:2,SM 38:2, SM 32:1 and SM 34:1, represented 68.5% of total plasma SM. Interestingly, just three ethers and plasmalogens –LPE O‐18:0,LPC P‐18:0and PE O‐34:3–showed significant alteration between two mouse groups and PE P‐34:2 was the single representative of PE class with a significant difference (Table 2).
4
|C O N C L U S I O N
Accumulating evidence now provides strong support for the view that membrane‐forming lipids in the brain can play a crucial role in depres- sion and anxiety disorders. Current hypotheses of the biological back- ground of anxiety disorders assume dysfunctions in neurotransmitter systems and peptides. Lipids, however, play essential roles as compo- nents of lipid membranes, determining the localization and function of various receptors. Indeed, dysregulation of brain lipid homeostasis may contribute to the pathogenesis of major depression and anxiety (Müller et al., 2015). In the present report we have focused on the lipid content of plasma, which might indicate anxiety pathogenesis. The plasma level of certain n‐6 fatty acids, phospho‐ and sphingolipids shows correlation with depressive disorder states (Demirkan et al., 2013; Evans et al., 2015), suggesting that profiling the plasma lipidome may yield a useful biomarker in mood disorders. In our study, the developed HILIC‐ESI‐MS method and applied bioinformatics software provided a fast and comprehensive tool for the qualitative and quanti- tative analysis of plasma PLs. A total of 130 PL species covering 10 PL classes were quantified in mouse plasma. The final method was used to characterize the PL composition of plasma in eight nAX and eight AX mice. Significant increases in the total concentration of PI, LPE, SM and PC classes were found in the AX group. For 35 PL species, signif- icant alterations were observed in the AX group compared with the nAX group. Of note, 33 PL species were determined to be up‐ TABLE 2 Identified PL species that were significantly different
between nAX and AX groups Phospholipid
species Probability
Average (nAX)
Average (AX)
Fold change
PI 36:5 <0.001 0.55 1.40 2.54
PI 34:3 <0.001 0.83 1.55 1.86
PI 32:1 <0.001 0.44 2.01 4.55
PI 36:2 0.002 108.81 157.52 1.45
PI 34:2 0.003 80.41 116.34 1.45
PI 36:4 0.011 197.42 267.42 1.35
PI 40:5 0.012 10.18 15.33 1.51
PI 40:4 0.028 8.07 12.18 1.51
PI 40:6 0.035 8.58 12.19 1.42
PI 38:6 0.041 6.93 9.49 1.37
LPI 22:6 0.031 0.01 0.01 1.76
PE O‐34:3, P‐34:2 0.030 0.13 0.18 1.41
LPE 16:1 <0.001 0.20 0.48 2.34
LPE 20:5 <0.001 0.07 0.20 2.92
LPE 18:1 <0.001 6.00 9.48 1.58
LPE 20:1 <0.001 0.28 0.47 1.65
LPE 16:0 <0.001 8.34 13.23 1.59
LPE 20:4 <0.001 27.07 36.12 1.33
LPE 18:3 0.002 0.31 0.47 1.54
LPE O‐18:0 0.008 0.20 0.28 1.36
LPE 18:2 0.021 19.87 25.56 1.29
LPE 22:6 0.023 21.50 25.96 1.21
PC 42:6 0.0060 0.11 0.07 0.64
PC 34:2 0.0224 15.52 18.34 1.18
PC 38:4 0.0400 4.81 3.98 0.83
SM 34:2 0.001 0.32 0.39 1.21
SM 42:2 0.011 1.88 2.30 1.22
SM 38:2 0.016 0.02 0.02 1.28
SM 32:1 0.033 0.02 0.02 1.20
SM 34:1 0.041 2.06 2.24 1.09
LPC 16:0 <0.001 15.73 21.06 1.34
LPC 16:1 0.001 0.37 0.60 1.64
LPC 22:4 0.002 0.03 0.05 1.64
LPC P‐18:0 0.011 0.02 0.03 1.30
LPC 18:2 0.026 1.49 2.09 1.40
FIGURE 6 Mean and the SE of normalized peak area of PL species in nAX (blue columns) and AX mouse (orange columns): (a) LPE, (b) PI
regulated in the AX mouse model, while down‐regulation was found only for PC 42:6andPC 38:4. The most significant increases were observed for LPEs and PIs. The highest observed fold changes (>2) were found compared with nAX to AX groups in PI 32:1,PI 36:5, LPE 16:1andLPE 20:5respectively.
A C K N O W L E D G M E N T
Róbert Berkecz thanks for the financial support to the János Bolyai Research Scholarship of the Hungarian Academy of Sciences. This research was supported by the EU‐funded Hungarian grant EFOP‐ 3.6.1‐16‐2016‐00008.
O R C I D
Róbert Berkecz http://orcid.org/0000-0002-9076-2177 Ferenc Tömösi http://orcid.org/0000-0002-6657-5777
R E F E R E N C E S
Ahn, E. J., Kim, H., Chung, B. C., Kong, G., & Moon, M. H. (2008). Quantita- tive profiling of phosphatidylcholine and phosphatidylethanolamine in a steatosis/fibrosis model of rat liver by nanoflow liquid chromatogra- phy/tandem mass spectrometry. Journal of Chromatography A, 1194, 96–102.
Alpert, A. J. (1990). Hydrophilic‐interaction chromatography for the separa- tion of peptides, nucleic acids and other polar compounds.Journal of Chromatography A,499, 177–196.
Argmann, C. A., & Auwerx, J. (2006). Collection of blood and plasma from the mouse.Current Protocols in Molecular Biology,75, 29A.3.1–29A.3.4.
Buhrman, D. L., Price, P. I., & Rudewicz, P. J. (1996). Quantitation of SR 27417 in human plasma using electrospray liquid chromatography–tan- dem mass spectrometry: a study of ion suppression. Journal of the American Society for Mass Spectrometry,7, 1099–1105.
Buszewski, B., & Noga, S. (2012). Hydrophilic interaction liquid chromatog- raphy (HILIC) – A powerful separation technique. Analytical and Bioanalytical Chemistry,402, 231–247.
Cajka, T., & Fiehn, O. (2014). Comprehensive analysis of lipids in biological systems by liquid chromatography–mass spectrometry.TrAC Trends in Analytical Chemistry,61, 192–206.
Cappiello, A., Famiglini, G., Palma, P., Pierini, E., Termopoli, V., & Trufelli, H.
(2008). Overcoming matrix effects in liquid chromatography−mass spectrometry.Analytical Chemistry,80, 9343–9348.
Cífková, E., Hájek, R., Lísa, M., & Holčapek, M. (2016). Hydrophilic interac- tion liquid chromatography–mass spectrometry of (lyso)phosphatidic acids, (lyso)phosphatidylserines and other lipidclasses.Journal of Chro- matography A,1439, 65–73.
Cífková, E., Holčapek, M., Lísa, M., Ovčačiková, M., Lyčka, A., Lynen, F., &
Sandra, P. (2012). Nontargeted quantitation of lipid classes using hydro- philic interaction liquid chromatography−electrospray ionization mass spectrometry with single internal standard and response factor approach.Analytical Chemistry,84, 10064–10070.
Cífková, E., Lísa, M., Hrstka, R., Vrána, D., Gatěk, J., Melichar, B., &
Holčapek, M. (2017). Correlation of lipidomic composition of cell lines and tissues of breast cancer patients using hydrophilic interaction liquid chromatography/electrospray ionization mass spectrometry and multi- variate data analysis.Rapid Communication in Mass Spectrometry, 31, 253–263.
Crawley, J. N. (2008). Behavioral phenotyping strategies for mutant mice.
Neuron,57, 809–818.
Croset, M., Brossard, N., Polette, A., & Lagarde, M. (2000). Characterization of plasma unsaturated lysophosphatidylcholines in human and rat.Bio- chemical Journal,345, 61–67.
Demirkan, A., Isaacs, A., Ugocsai, P., Liebisch, G., Struchalin, M., Rudan, I.,… Van Duijn, C. M. (2013). Plasma phosphatidylcholine and sphingomyelin
concentrations are associated with depression and anxiety symptoms in a Dutch family‐based lipidomics study.Journal of Psychiatric Research, 47, 357–362.
Dennis, E. A. (2009). Lipidomics joins the omics evolution.Proceedings of the National Academy of Sciences, (7), 2089–2090.
Ditzen, C., Jastorff, A. M., Kessler, M. S., Bunck, M., Teplytska, L., Erhardt, A.,… Turck, C. W. (2006). Protein biomarkers in a mouse model of extremes in trait anxiety.Molecular & Cellular Proteomics,5, 1914–1920.
Evans, S. J., Assari, S., Harrington, G. J., Chang, Y. W., Burant, C. F., &
McInnis, M. G. (2015). Plasma linoleic acid partially mediates the asso- ciation of bipolar disorder on self‐reported mental health scales.
Journal of Psychiatric Research,68, 61–67.
Fahy, E., Subramaniam, S., Brown, H. A., Glass, C. K., Merrill, A. H. Jr., Murphy, R. C.,…Dennis, E. A. (2005). A comprehensive classification system for lipids.Journal of Lipid Research,46, 839–861.
Fahy, E., Subramaniam, S., Murphy, R. C., Nishijima, M., Raetz, C. R. H., Shimizu, T.,…Dennis, E. A. (2009). Update of the LIPID MAPS com- prehensive classification system for lipids. Journal of Lipid Research, 50, S9–S14.
Folch, J., Lees, M., & Sloane Stanley, G. H. (1957). A simple method for the isolation and purification of total lipids from animal tissues.The Journal of Biological Chemistry,226, 497–509.
Forouhi, N. G., Koulman, A., Sharp, S. J., Imamura, F., Kröger, J., Schulze, M.
B.,…Wareham, N. J. (2014). Differences in the prospective association between individual plasma phospholipid saturated fatty acids and inci- dent type 2 diabetes: the EPIC‐InterAct case‐cohort study.The Lancet Diabetes and Endocrinology,2, 810–818.
Goto‐Inoue, N., Yamada, K., Inagaki, A., Furuichi, Y., Ogino, S., Manabe, Y.,
…Fujii, N. L. (2013). Lipidomics analysis revealed the phospholipid com- positional changes in muscle by chronic exercise and high‐fat diet.
Scientific Repost,3, 1–9.
Hanash, S. (2003). Disease proteomics.Nature,422, 226–232.
Harkewicz, R., & Dennis, E. A. (2011). Applications of mass spectrometry to lipids and membranes.Annual Review of Biochemistry,80, 301–325.
Hemström, P., & Irgum, K. (2006). Hydrophilic interaction chromatography.
Journal of Separation Science,29, 1784–1821.
Holčapek, M., Cífková, E.,Červená, B., Lísa, M., Vostálová, J., & Galuszka, J.
(2015). Determination of nonpolar and polar lipid classes in human plasma, erythrocytes and plasma lipoprotein fractions using ultrahigh‐ performance liquid chromatography–mass spectrometry. Journal of Chromatography A,1377, 85–91.
Horváth, J., Barkóczi, B., Müller, G., & Szegedi, V. (2015). Anxious and nonanxious mice show similar hippocampal sensory evoked oscillations under urethane anesthesia: Difference in the effect of buspirone.Neu- ral Plasticity,2015, 1–9.
Horváth, J., Szögi, T., Müller, G., & Szegedi, V. (2013). The anxiolytic buspirone shifts coping strategy in novel environmental context of mice with different anxious phenotype. Behavioural Brain Research, 250, 32–38.
Ivanova, P. T., Milne, S. B., Myers, D. S., & Brown, H. A. (2009). Lipidomics:
A mass spectrometry based systems level analysis of cellular lipids.Cur- rent Opinion in Chemical Biology,13, 526–531.
Jia, L., Wang, C., Kong, H., Cai, Z., & Xu, G. (2006). Plasma phospholipid metabolic profiling and biomarkers of mouse IgA nephropathy.Metabo- lomics,2, 95–104.
Kind, T., Liu, K. H., Lee, D. Y., DeFelice, B., Meissen, J. K., & Fiehn, O. (2013).
LipidBlast in silico tandem mass spectrometry database for lipid identi- fication.Nature Methods,10, 755–758.
Korte, K., & Casey, M. L. (1982). Phospholipid and neutral lipid separation by one‐dimensional thin‐layer chromatography.Journal of Chromatogra- phy,232, 47–53.
Kosicek, M., & Hecimovic, S. (2013). Phospholipids and Alzheimer's disease:
Alterations, mechanisms and potential biomarkers.International Journal of Molecular Scienes,14, 1310–1322.
Liebisch, G., Vizcaíno, J. A., Köfeler, H., Trötzmüller, M., Griffiths, W. J., Schmitz, G.,…Wakelam, M. J. O. (2013). Shorthand notation for lipid structures derived from mass spectrometry.Journal of Lipid Research, 54, 1523.
Lísa, M., Cífková, E., & Holčapek, M. (2011). Lipidomic profiling of biological tissues using off‐line two‐dimensional high‐performance liquid chroma- tography–mass spectrometry. Journal of Chromatography A, 1218, 5146–5156.
Lísa, M., & Holčapek, M. (2015). High‐throughput and comprehensive lipidomic analysis using ultrahigh‐performance supercritical fluid chro- matography−mass spectrometry.Analytical Chemistry,87, 7187–7195.
Ma, D. W. L., Arendt, B. M., Hillyer, L. M., Fung, S. K., McGilvray, I., Guindi, M., & Allard, J. P. (2016). Plasma phospholipids and fatty acid composi- tion differ between liver biopsy‐proven nonalcoholic fatty liver disease and healthy subjects.Nutrition & diabetes,6, 1–7.
Matuszewski, B. K., Constanzer, M. L., & Chavez‐Eng, C. M. (2003).
Strategies for the assessment of matrix effect in quantitative bioanalytical methods based on HPLC‐MS/MS.Analytical Chemistry, 75, 3019–3030.
Müller, C. P., Reichel, M., Mühle, C., Rhein, C., Gulbins, E., & Kornhuber, J.
(2015). Brain membrane lipids in major depression and anxiety disor- ders.Biochimica et Biophysica Acta,1851(8), 1052–1065.
Naidong, W. (2003). Bioanalytical liquid chromatography tandem mass spectrometry methods on underivatized silica columns with aqueous/
organic mobile phases.Journal of Chromatography B,796, 209–224.
Pati, S., Nie, B., Arnold, R. D., & Cummings, B. S. (2016). Extraction, chro- matographic and mass spectrometric methods for lipid analysis.
Biomedical Chromatography,30, 695–709.
Peterson, B. L., & Cummings, B. S. (2006). A review of chromatographic methods for the assessment of phospholipids in biological samples.Bio- medical Chromatography,20, 227–243.
Quehenberger, O., Armando, A. M., Brown, A. H., Milne, S. B., Myers, D. S., Merrill, A. H.,…Dennis, E. A. (2010). Lipidomics reveals a remarkable diversity of lipids in human plasma. Journal of Lipid Research, 51, 3299–3305.
Rabagny, Y., Herrmann, W., Geisel, J., Kirsch, S. H., & Obeid, R. (2011).
Quantification of plasma phospholipids by ultra performance liquid chromatography tandem mass spectrometry. Analytical and Bioanalytical Chemistry,401, 891–899.
Řezanka, T., Siristova, L., Matoulková, D., & Sigler, K. (2011). Hydrophilic interaction liquid chromatography: ESI–MS/MS of plasmalogen phos- pholipids fromPectinatusbacterium.Lipids,46, 765–780.
Sandra, K., dos Santos Pereira, A., Vanhoenacker, G., David, F., & Sandra, P.
(2010). Comprehensive blood plasma lipidomics by liquid chromatogra- phy/quadrupole time‐of‐flight mass spectrometry. Journal of Chromatography A,1217, 4087–4099.
Schubert, K. O., Weiland, F., Baune, B. T., & Hoffmann, P. (2016). The use of MALDI‐MSI in the investigation of psychiatric and neurodegenerative disorders: A review.Proteomics,16, 1747–1758.
Sud, M., Fahy, E., Cotter, D., Brown, A., Dennis, E. A., Glass, C. K. Jr.,… Subramaniam, S. (2007). Lmsd: lipid maps structure database.Nucleic Acids Research,35, 527–532.
Szegő, É. M., Janáky, T., Szabó, Z., Csorba, A., Kompagne, H., Müller, G.,… Kékesi, K. A. (2010). A mouse model of anxiety molecularly character- ized by altered protein networks in the brain proteome. European Neuropsychopharmacology,20, 96–111.
Tania, M., Khan, M. A., & Song, Y. (2010). Association of lipid metabolism with ovarian cancer.Current Oncology, (5), 8–11.
Van der Greef, J., Martin, S., Juhasz, P., Adourian, A., Plasterer, T., Verheij, E.
R., & McBurnea, R. N. (2007). The art and practice of systems biology in medicine: Mapping patterns of relationships. Journal of Proteome Research,6, 1540–1559.
Wiklund, S., Johansson, E., Sjöström, L., Mellerowicz, E. J., Edlund, U., Shockcor, J. P.,…Trygg, J. (2008). Visualization of GC/TOF‐MS‐based metabolomics data for identification of biochemically interesting com- pounds using OPLS class models.Analytical Chemistry,80, 115–122.
S U P P O R T I N G I N F O R M A T I O N
Additional Supporting Information may be found online in the supporting information tab for this article.
How to cite this article: Berkecz R, Körmöczi T, Tömösi F, et al. Plasma phospholipid profiling of a mouse model of anxi- ety disorder by hydrophilic interaction liquid chromatography coupled to high‐resolution mass spectrometry. Biomedical Chromatography. 2018;32:e4202. https://doi.org/10.1002/
bmc.4202