CHARACTERIZING CEREBRAL SMALL
VESSEL DISEASE WITH A FOCUS ON CADASIL AS A GENETIC MODEL
-AN MRI BASED APPROACH
PhD Thesis
Dr. Bence Barna Gunda
Semmelweis University
János Szentágothai School of Neurosciences
Supervisor: Dániel Bereczki MD, DSc Consultant: Hugues Chabriat MD, PhD Reviewers: László Oláh MD, PhD
Péter Barsi MD, PhD
Head of Examination Committee: László Tringer MD, DSc Members of Examination Committee: Zoltán Benyó MD, DSc
Attila Valikovics MD, PhD
Budapest, 2012
2
Content
Abbreviations ... 3
1. Introduction ... 5
1.1. Cerebral small vessel disease ... 5
1.2. Magnetic resonance imaging of cerebral small vessel disease ... 7
1.2.1. Lacunar infarcts ... 8
1.2.2. White matter lesions ... 14
1.2.3. Cerebral microbleeds ... 18
1.2.4. Brain atrophy ... 20
1.2.5. Summary ... 22
1.3. CADASIL and other hereditary small vessel diseases of the brain ... 24
1.3.1. CADASIL as a model disease ... 24
1.3.2. Other hereditary small vessel diseases of the brain ... 26
2. Purpose ... 28
2.1. Effects of gender on the phenotype of CADASIL (Study 1)... 28
2.2. Whole brain ADC histogram in CADASIL (Study 2) ... 29
3. Methods ... 30
3.1. Subjects ... 30
3.2. Clinical evaluation ... 30
3.3. MRI ... 30
3.4. Image processing and analysis ... 31
3.5. Statistical methods ... 32
4. Results ... 33
4.1. Gender related differences ... 33
4.2. Diffusion histograms ... 39
5. Discussion ... 49
5.1. Gender effects in CADASIL ... 49
5.2. ADC histogram in CADASIL ... 52
6. Conclusions ... 55
7. Summary ... 56
8. Összefoglalás ... 57
References ... 59
Publications ... 77
Acknowledgements ... 78
3
Abbreviations
ADC: apparent diffusion coefficient
ADEM: acute disseminated encephalomyelitis
CADASIL: Cerebral Autosomal Dominant Arteriopathy with Subcortical Infarcts and Leukoencephalopathy
CARASIL: Cerebral Autosomal Recessive Arteriopathy with Subcortical Infarcts and Leukoencephalopathy
cMB: cerebral microbleeds CNS: central nervous system CRV: Cerebroretinal vasculopathy CSF: cerebrospinal fluid
CST: corticospinal tract
cSVD: cerebral small vessel disease CT: computed tomography
DWI: diffusion weighted imaging DTI: diffusion tensor imaging
FLAIR: fluid attenuation inversion recovery
HERNS: Hereditary endotheliopathy with retinopathy nephropathy and stroke HG: histogram
HVR: Hereditary vascular retinopathy LI: lacunar infarct
MA: migraine with aura
MELAS: mitochondrial myopathy, encephalopathy, lactic acidosis, and stroke
4 MD: mean diffusivity
MRI: magnetic resonance imaging
PADMAL: Pontine autosomal dominant microangiopathy and leukoencephalopathy PML: progressive multifocal leukoencephalopathy
PRES: posterior reversible encephalopathy syndrome PWI: perfusion weighted imaging
PXE: Pseudoxanthoma elasticum ROI: region of interest
RVCL: Retinal vasculopathy with cerebral leukodystrophy SSPE: Subacute sclerosing panencephalitis
VRS: Virchow-Robin spaces
WMH: white matter hyperintensities
5
1. Introduction
1.1. Cerebral small vessel disease
Cerebral small vessel disease (cSVD) is a spectrum of clinical and imaging abnormalities linked to the pathology of small penetrating arteries and arterioles in the brain irrigating subcortical structures 1. Accumulating data suggest that cSVD is the most prevalent neurological disorder in the ageing society of the developed world 2, 3. The prevalence of its seemingly asymptomatic manifestations –silent brain infarcts- increases with age from approximately 6-7% at 60 years to 28% at 80 years of age according to a recent review 4. In another study lacunar infarcts were found in 23% of all subjects over 65 years, and in 43% of subjects over 80 years of age 5. Its acute, symptomatic manifestations –lacunar strokes- account for approximately 20% of all ischemic strokes 6-8. Thus improved management of cSVD based on better understanding of the disease is of great importance.
cSVD is characterised by the arteriolosclerosis and/or microatheromatosis of small calibre (50-500 μm) cerebral arterial vessels caused by various pathologies 1. Its most common, sporadic, form is related to age and vascular risk factors including hypertension and diabetes in particular. Inherited forms are increasingly recognised with CADASIL (Cerebral Autosomal Dominant Arteriopathy with Subcortical Infarcts and Leukoencephalopathy) being the most prevalent genetic cSVD 9, 10. Inflammatory, infective and immunologically mediated forms are usually part of systemic diseases of diverse origin characterised by central nervous system vasculitis 11. Cerebral amyloid angiopathy (CAA) –a pathological hallmark of Alzheimer’s disease- affects small vessels both cortically and subcortically and may also lead to ischemic changes, although it is particularly associated with recurrent lobar haemorrhages
11. In this thesis I will only focus on the most common and well-studied age and vascular risk factor related form of cSVD and CADASIL.
cSVD predominantly affects perforating end-arteries branching usually perpendicularly from a large parent artery. These penetrating arteries irrigate the so called perforator areas including the basal ganglia and internal capsule (lenticulostriate arteries from the anterior cerebral artery (ACA) A1 segment and middle cerebral artery (MCA) M1 segment), the thalamus (thalamoperforators from the posterior cerebral artery (PCA) and posterior communicating artery (PCoA)), the pons (pontine perforators from the basilar artery
6
(BA)) and the hemispheric deep white matter -centrum semiovale (perforators from the cortical, leptomeningeal arteries) 12-15.
The pathological changes in cSVD lead to luminal narrowing, decreased autoregulation and vasoreactivity, and vessel wall damage in the cerebral microvessels resulting in their i. gradual stenosis, ii. sudden occlusion, iii. leakage or iv. rupture. As a consequence the subcortical brain tissue suffers from i.: diffuse chronic hypoperfusion and ischemia leading to the progressive disintegration of cerebral white matter 16; ii.: acute localised ischemia resulting in lacunar infarcts 17; iii.: blood extravasation seen as microbleeds
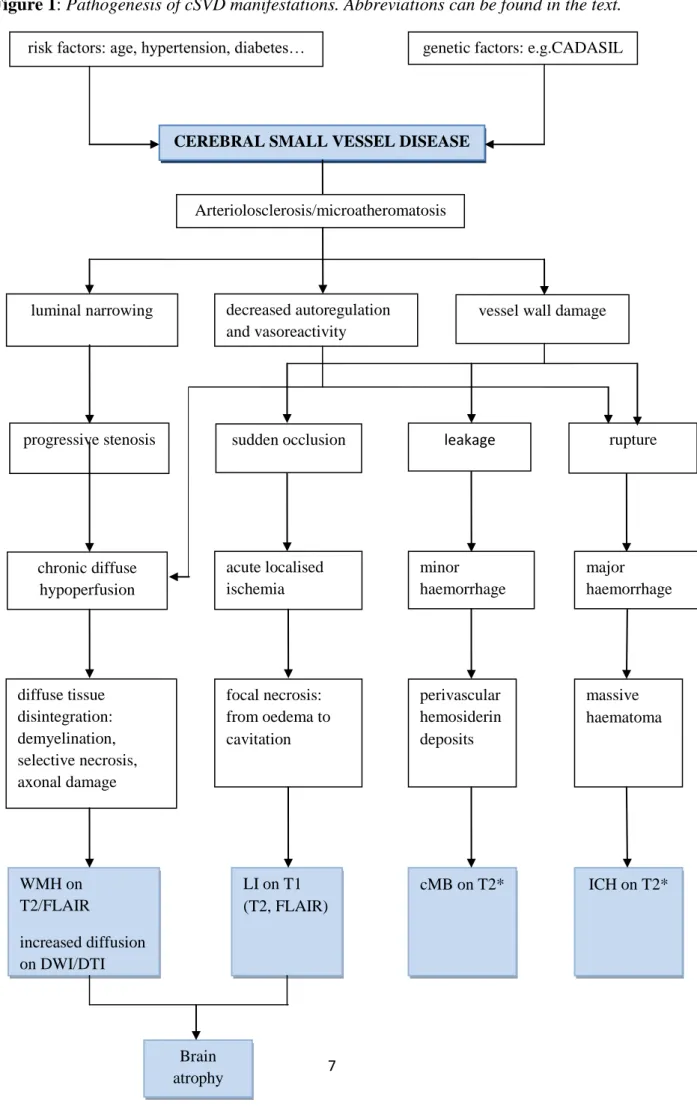
18; and iv.: acute major haemorrhages 11, 19. In an advanced state of the disease cerebral atrophy invariably occurs as a remote and/or diffuse consequence of vascular lesion burden 20. The pathogenesis of cSVD manifestations is summarized in Figure 1 21.
The gradual ischemic tissue damage clinically manifests in i. progressive cognitive impairment mainly affecting executive function in the earliest stages and later leading to dementia of subcortical type; and ii. disability characterized by gait disturbances and other motor impairments, pseudobulbar palsies, urinary incontinence etc. Acute focal ischemia presents –if it involves main sensorimotor pathways- with the so-called lacunar syndromes.
Cerebral microbleeds are usually asymptomatic and their clinical significance is yet to be determined.
7
Figure 1: Pathogenesis of cSVD manifestations. Abbreviations can be found in the text.
risk factors: age, hypertension, diabetes… genetic factors: e.g.CADASIL
CEREBRAL SMALL VESSEL DISEASE
luminal narrowing vessel wall damage
progressive stenosis sudden occlusion rupture
chronic diffuse hypoperfusion
acute localised ischemia
minor haemorrhage
major haemorrhage decreased autoregulation
and vasoreactivity
diffuse tissue disintegration:
demyelination, selective necrosis, axonal damage
focal necrosis:
from oedema to cavitation
perivascular hemosiderin deposits
massive haematoma
WMH on T2/FLAIR
increased diffusion on DWI/DTI
LI on T1 (T2, FLAIR)
cMB on T2* ICH on T2*
Brain atrophy
Arteriolosclerosis/microatheromatosis
leakage
8
1.2. Magnetic resonance imaging of cerebral small vessel disease
Magnetic resonance imaging (MRI) is the most appropriate tool to assess cSVD. Since the cerebral microvasculature cannot be currently visualized in vivo, the consequent parenchymal lesions (lacunar infarcts, white matter lesions, microbleeds and atrophy) have been adopted as markers of cSVD 11. Here I will summarize recent knowledge about the MRI characteristics of cSVD (without discussing the issue of major haemorrhages).
1.2.1. Lacunar infarcts Definition
According to the “lacunar hypothesis” first proposed by Fisher small subcortical infarcts of a diameter less than 15 mm –called lacunar infarcts (LI)- result from the sudden occlusion of penetrating arteries due to cSVD in typical locations -the perforator areas (see above) 17. Infarcts of this type have been linked to particular clinical syndromes with a relatively good prognosis called the lacunar syndromes, most frequent of which are the classical ones: pure motor stroke, pure sensory stroke, ataxic hemiparesis, dysarthria-clumsy hand syndrome and sensorimotor stroke. The concept of lacunar stroke that entered stroke classifications was based on postmortem and CT based studies both with considerable limitations. The pathological studies were limited by the low mortality of lacunar strokes and by the anatomical changes occurring in the chronic stage and/or during fixation. CT has a low sensitivity to detect small infarcts in certain locations (posterior fossa, cortex) and in the acute stage and cannot differentiate between fresh and old lesions. The advent of MRI and especially its newer techniques such as diffusion weighted imaging (DWI), perfusion weighted imaging (PWI) and diffusion tensor imaging (DTI) has slightly modified our understanding of LIs 21, 22.
Conventional MRI
Because of their small size visualizing LIs is much more problematic than that of larger territorial infarcts. Compared to CT conventional MRI sequences such as T1 weighted, T2 weighted imaging (T1/2WI) have a better spatial resolution, can image the posterior fossa without artifacts and have a better signal/noise ratio. LIs in the chronic stage appear as fluid
9
filled cavities: hypointensities (black holes) on T1WI and hyperintensities on T2WI isointense with CSF. More recent LIs can be seen as hyperintensities on T2WI corresponding to brain tissue with increased water content (oedema). The widely used T2 based fluid attenuation inversion recovery (FLAIR) sequence that nulls the hyperintense signal of free water (mainly CSF) has some advantages over the T2WI. FLAIR is more sensitive in the detection of small, recent infarcts in the proximity of CSF spaces like those in the cortex or next to the ventricles.
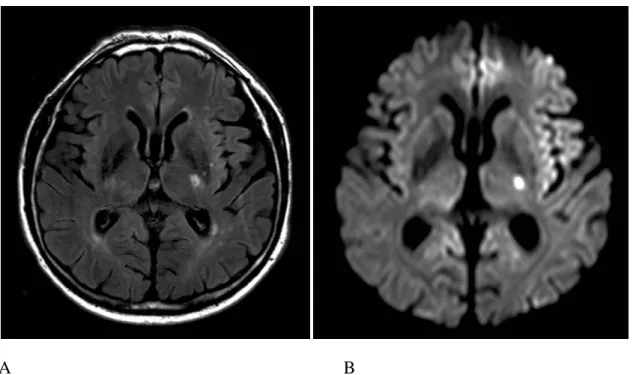
It can better estimate the age of LIs, because the signal of bulk water in chronic infarcts (cavitations) is nulled as well, whereas the increased bound water content of acute infarcts (solid tissue) is hyperintense 23. Acute lesions on FLAIR give a relatively stable high signal for several weeks as opposed to the fluctuations in intensity seen on T2W images 24, 25 (Figure 2). However very early ischaemia within the first few hours especially in the lacunar dimension cannot be seen on any of the conventional MR sequences, because the signal abnormality only appears 3-4 hours after symptom onset 26.
DWI
Acute stage imaging has been facilitated by the introduction of diffusion weighted imaging (DWI) that shows intracellular cytotoxic oedema resulting from critical cerebral ischaemia within the first few minutes after stroke onset 27. The energy failure of brain cells, through the dysfunction of Na/K ATPase and consequent Na influx, results in the accumulation of intracellular bound water leading to a reduced diffusion of free water. This appears as marked hypointensity on the apparent diffusion coefficient (ADC) map which translates into high DWI signal 28-30. In the case of cortical ischemia the reduced ADC returns to normal in 5-10 days (pseudo-normalisation) 25, 31, while it stays low for a considerably longer period in subcortical disease. Consequently the hyperintensity due to diffusion restriction is also visible for longer 32. Later the ADC increases indicating vasogenic oedema and finally tissue disintegration/necrosis in the chronic stage 33. However the lesion appearing hyperintense on DWI may remain visible further on as the developing T2 lesion is also seen as high signal (T2 shine through). Therefore DWI and ADC map images have to be interpreted together to judge the age of an ischaemic infarct 34, 35. The sensitivity of this sequence within 6 hours of symptom onset is of 95% and its specificity is of practically 100%
for territorial infarcts 36. Although understandably less for small subcortical infarcts, it is still
10
the only reliable tool to visualise hyperacute LIs making it indispensable for acute phase therapy decisions (Figure 2).
A B
Figure 2. Subacute lacunar infarct in the posterior limb of the left internal capsule in a hypertensive patient on axial FLAIR (A) and DWI trace (B) image.
DTI
A great proportion of LIs occur along the course of motor pathways whose affection well correlates with the severity of clinical symptoms and mainly determines prognosis. The extent of damage to these pathways can be judged by the MR diffusion tensor imaging (DTI) that is capable of visualizing white matter tracts 37. This imaging method is based on the principle that cell membranes constrain the diffusion of water molecules which therefore diffuse longitudinally along axons in the white matter. By measuring diffusion from several directions the net orientation of axons in a voxel of white matter can be determined as a 3 dimensional vector –a „tensor”. From these vectors virtual projections of fibres can be generated and displayed as maps of white matter anatomy e.g. in a colour-coded way where different colours stand for different directions, and colour brightness for the degree of anisotropy (colour-coded directional image) 38, 39. Fiber tracking is a further development that enables examiners to visualize fibers passing through a certain region of interest (ROI) or
11
linking two ROIs thus delineating functional systems such as the corticospinal tract (CST).
This method has been used to specifically localize small infarcts with regard to the functional pathway of the CST with good topographical accuracy 40-42 . Nevertheless, only a limited number of such tractography studies have been published to date, and few techniques have been assessed for their ability to track through lesions which disrupt tracts.
Size criterion
The size of LIs according to the classical definition is less than 15 mm –a rather arbitrary criterion based on early autopsy studies representing a healed, chronic state 17. Since then we know that LIs in the acute stage can be significantly larger later undergoing shrinkage by about half their original size 43. Furthermore surprisingly large infarcts can be caused by single perforator occlusion due to anatomic variations of the branching pattern of the lenticulostriate arteries. More or even all of the penetrating arteries may arise from one common stem 14, 44. Therefore the size criterion for LIs can lead to stroke type misclassification and should be reconsidered 45.
Differentiation of underlying mechanisms
Apart from cSVD small subcortical infarcts may be caused by emboli of arterial or cardiac origin or critical hypoperfusion in watershed areas due to stenosing large artery disease (LAD). As determining stroke subtype is crucial for further management it is important to make an early etiological diagnosis. Acute lesion patterns on DWI help us to differentiate between the underlying pathomechanisms 46. The co-existence of a small striatocapsular and one or more distal small cortical lesions points to an embolus originally stuck in the M1 segment obstructing the orifices of the lenticulostriate arteries and later on fragmented and washed further up into one or more small cortical branches of the MCA 47, 48. This scenario is also possible in the posterior circulation -although much less frequently- with the picture of a small brainstem lesion together with a PCA territory thalamic or cortical infarct. Multiple small subcortical lesions in the same vascular territory are associated with LAD (arterio-arterial embolism), whereas those in different territories/bilaterally suggest a proximal embolic origin (heart or aortic arch) 49. In the latter case it is not clear whether they result from repeated embolism or a single embolic shower 46.
12
It has also been proposed that multiple small infarcts may also be due to cSVD affecting several vessels contemporaneously 50. As mentioned earlier subcortical lesions can remain hyperintense on DWI for much longer than cortical ones. Thus several lesions in diffferent vascular territories could arise contemporaneously (i.e. within a few weeks of each other) but not simultaneously and all appear hyperintense on DWI falsely raising the suspicion of an embolic origin. In addition the small perforators arising perpendicularly from large vessels seem hardly accessible for fast moving emboli from an anatomical point of view.
Therefore the purely embolic origin of multiple small subcortical DWI lesions in multiple vascular territories remains debated.
Partial borderzone infarcts in the watershed of superficial and deep perforators of the MCA and/or ACA may also appear similar to LIs. They can be seen as a single small lesion or a chain of them (rosary-like pattern) in the centrum semiovale alongside and slightly above the lateral ventricle. The demonstration of ipsilateral carotid artery disease and consequent hypoperfusion shown by a perfusion deficit on perfusion weighted imaging (PWI) far exceeding the lesion area leads to diagnosis 51, 52.
Differentiation from other small cerebral lesions
LIs –especially when occurring without overt clinical symptoms, as incidential findings- may be difficult to distinguish from other hyperintense focal abnormalities on T2 weighted images. Studies correlating these lesions on in vivo and postmortem MR images with brain autopsy findings have identified the following pathologies: silent LIs, dilated Virchow-Robin spaces (VRS), foci of demyelination 53 due to incidental multiple sclerosis 54 or insufficient circulation 55 56, gliosis, minute cysts and ventricular diverticuli 57, 58. Distinction between an infarct, a focal gliosis and a plaque of demyelination is usually impossible on entirely imaging grounds, while the relationship of a diverticulum or cyst to the ventricles and their round shape are differential features 58.
VRSs are small perivascular spaces surrounding cerebral perforating arteries along their way through the parenchyma serving as drainage pathways for the cerebral interstitial fluid 59. They are small (<1 mm) CSF isointense foci round shaped in cross section or linear in longitudinal section and run perpendicular to the brain surface 60-62. Dilated VRSs that can resemble lacunes and appear as an irregular or ectatic focal expansion of the otherwise regular
13
and smooth VRSs 62. They are still generally smaller than lacunes usually not exceeding 3 mm in diameter 63, whereas lacunes are larger and wedge shaped 61, 62. Dilated VRSs have been associated with ageing 64, hypertension 65, widespread white matter lesions 66, sporadic cSVD 6763, CADASIL 68, reduced cognitive function 66, and vascular dementia 67, 69. However their real clinical significance is a subject of controversy. It is generally accepted that dilated VRSs are related to brain shrinkage around perforating vessels thus representing brain atrophy
70. In this perspective they can both be regarded as common ageing phenomenon or as a marker of various pathologies. The distinction between normal and pathologically dilated VRSs can be made by judging the appearance of the adjacent brain tissue and the clinical context 62.
Silent cerebral infarcts
With the increasing use of MRI and the improving image quality an increasing number of patients are found to harbour small cerebral infarcts without any apparent stroke-like symptoms. It has now become clear that LIs only cause clinically evident stroke if they hit main sensorimotor pathways or occur in deep, subcortical nuclei. However the majority of them fall outside of these strategic locations and thus remain silent. Studies have shown that in the general population the prevalence of silent infarcts is fivefold higher than that of stroke, and they can be present in more than one fourth of people over 60 years of age 71-74. They have approximately the same risk factors as symptomatic lacunes with hypertension being the most important 73, 74; and their presence more than doubles the risk of subsequent vascular events, cognitive impairment and dementia 4, 75. The extent of asymptomatic small vessel disease at the time of index stroke has a significant prognostic value for all outcomes 43, 75. These findings have led to a modified understanding of cerebrovascular disease according to which strokes and TIAs –i.e. overt clinical symptoms- are only the tip of the iceberg of cSVD manifestations 21, 22. Silent infarcts are the underwater majority. It has not yet been evaluated though – and remains doubtful at present- whether the same diagnostic workup and risk factor management would be justifiable upon finding a silent infarct as for a clinical stroke.
Although by definition silent infarcts lack clinically overt stroke symptoms they progressively lead to less evident cognitive dysfunction, general physical disability and depression.
Therefore these infarcts should be referred to as “covert” rather than “silent” 4, 76.
14 1.2.2. White matter lesions
Definition
White matter lesions seen in elderly patients and those with arterial hypertension are usually bilateral and more or less symmetrical areas of increased signal on T2 and FLAIR images (hence the name: white matter hyperintensities, WMH) located in the hemispheric deep white matter and the pons (Figure 3). The term “leukoaraiosis” meaning rarefaction of white matter is a description from the CT era of the same phenomenon 77. WMHs are generally regarded as a consequence of ischemic brain tissue disintegration due to cSVD.
Pathological studies found varying degrees of tissue damage appearing as WMH: from selective loss of myelin, to loss of myelin, axons and oligodendroglia consistent with incomplete infarcts, to near complete infarcts with astrogliosis 78-81.
Differential diagnosis
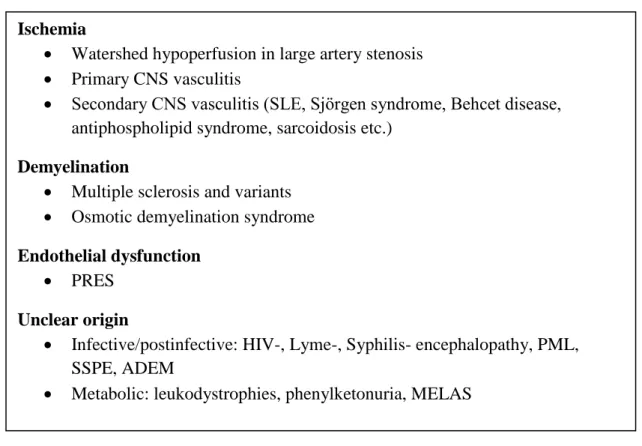
Multifocal or diffuse white matter lesions resembling those caused by cSVD can be found in a wide range of central nervous system (CNS) pathologies. These are summarized in Table 1. Their differential diagnosis is based on the complex evaluation of patient history, clinical context, other diagnostic tests and some differences in MRI appearance. Some of these WMHs are also ischemic in origin such as those caused by hypoperfusion 1. in watershed areas due to large artery stenosis, or 2. in different vascular territories due to various types of CNS vasculitis. These latter can occur either as an isolated CNS affection (primary CNS vasculitis), or as part of a systemic disease (SLE, Sjörgen syndrome, Behcet disease, antiphospholipid syndrome, sarcoidosis etc.) Others are a consequence of multifocal demyelination in multiple sclerosis (MS) and its variants or in osmotic demyelination syndrome (formerly known as central pontine/extrapontine myelinolysis). As opposed to cSVD MS is characterized by ovoid-shaped lesions perpendicular to the ventricles (Dawson fingers), frequently found in the corpus callosum, some of which may enhance contrast material. Plaques may also be located in the optic nerves, cerebellum and spinal cord. WMH caused by transient vasogenic edema resulting from endothelial injury due to various complex conditions (preeclampsia/eclampsia, severe hypertension, allogenic bone marrow transplantation,organ transplantation, autoimmune diseases and high dose chemotherapy) has been termed as Posterior reversible encephalopathy syndrome (PRES). The typical pattern of
15
WMH in PRES resembles the watershed zones with a parietal and occipital (posterior) predominance. The subcortical white matter but also the cortex is involved to varying degrees and the lesions always regress 82. White matter lesions of unclear nature can be seen in some infective diseases /postinfective conditions such as HIV, Lyme-disease or Syphilis related encephalopathies, Progressive multifocal leukoencephalopathy (PML), Subacute sclerosing panencephalitis (SSPE) or Acute disseminated encephalomyelitis (ADEM); and metabolic disorders like leukodystrophies, phenylketonuria and mitochondrial diseases (MELAS) 83, 84.
Table 1. CNS pathologies causing multiple/diffuse white matter lesions. Abbreviations can be found in the text.
Evaluation with conventional MRI
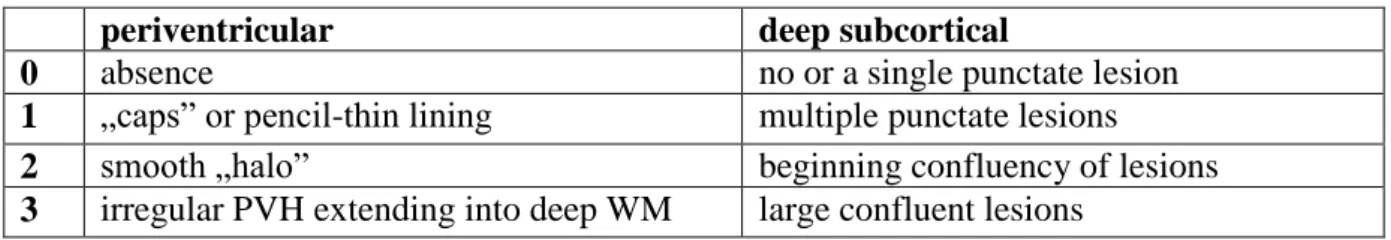
The severity of white matter damage on T2 and FLAIR images can be assessed semiquantitatively by various visual rating scales (proposed by Fazekas85, Schmidt 86, Scheltens 87, Wahlund 88 and others) that take into account the location, pattern and extension of WMH 89. The mostly used Fazekas-scale which evaluates WMH in two distinct locations:
periventricular and deep subcortical white matter is presented in Table 2. The mildest forms Ischemia
Watershed hypoperfusion in large artery stenosis
Primary CNS vasculitis
Secondary CNS vasculitis (SLE, Sjörgen syndrome, Behcet disease, antiphospholipid syndrome, sarcoidosis etc.)
Demyelination
Multiple sclerosis and variants
Osmotic demyelination syndrome Endothelial dysfunction
PRES Unclear origin
Infective/postinfective: HIV-, Lyme-, Syphilis- encephalopathy, PML, SSPE, ADEM
Metabolic: leukodystrophies, phenylketonuria, MELAS
16
are seen as smooth periventricular and punctuate deep WMH, whereas irregular periventricular, early confluent and confluent deep WMH represent an increasing severity of tissue damage. Furthermore the three dimensional extension of WMH can be quantified by volumetric evaluation 90, 91. WMH volumetry is more reproducible and more sensitive for lesion progression than visual scales 92. However the severity of white matter lesions as assessed by any of the above methods showed only moderate correlations with the clinical status represented by scores of disability and cognitive impairment 93-95.
Table 2. Fazekas visual rating scale for WMH (0-6 points) 85
periventricular deep subcortical
0 absence no or a single punctate lesion
1 „caps” or pencil-thin lining multiple punctate lesions
2 smooth „halo” beginning confluency of lesions
3 irregular PVH extending into deep WM large confluent lesions
Evaluation with non-conventional MRI
The whole spectrum of microscopic brain tissue changes due to cSVD appears uniformly as WMH on conventional MR sequences. In order to obtain information on the degree of underlying tissue damage, non-conventional MRI techniques have been developed such as T1- and T2 relaxation time mapping, magnetisation transfer imaging (MTR) and diffusion tensor imaging (DTI) 96, 97. This latter technique, that measures the degree and orientation of tissue water diffusivity, has been widely used in various cerebral diseases and conditions including cSVD 98. As diffusivity partly depends on the density of cells in a given tissue volume (cell membranes and intracellular particles restrict water diffusion), the increase in diffusivity (as measured by a non-oriented derivate of the tensor, the mean diffusivity, MD) is proportional to the degree of ultrastructural tissue disintegration 99, 100. Region of interest (ROI) based measurements detected increased MD inside but also outside of WMH, in the normal appearing white and subcortical grey matter 101, 102. DTI can thus show tissue damage
„invisible” for conventional MRI. In diffuse cerebral pathologies however -such as cSVD - a global, quantitative approach of whole brain diffusion histograms is more informative about the overall disease severity than a ROI analysis. Accordingly, MD histogram parameters have been reported to correlate more with clinical scores than WMH visual rating scales and volumetric data in cSVD both cross sectionally and longitudinally. Furthermore they were
17
more sensitive than clinical scales in detecting change over time 103-108. In a study described further on in this thesis we obtained data indicating that the much simpler, quicker and widely available diffusion weighted imaging (DWI) derived apparent diffusion coefficient (ADC) can be used similarly to DTI derived MD to quantify brain damage due to cSVD (findings of Gunda et al. to be published) (Figure 3 and 4). Therefore these quantitative MRI techniques seem to be a promising tool in the quantified monitoring of cSVD and could possibly act as surrogate markers in future therapeutic trials.
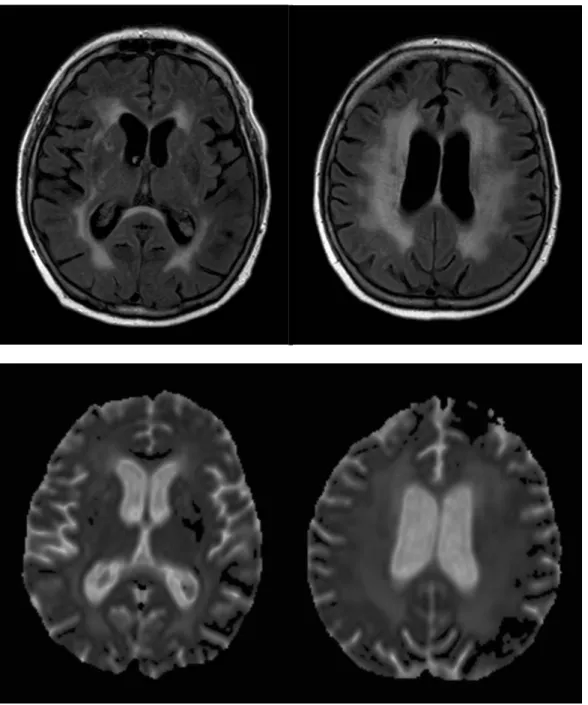
Figure 3. Diffuse white matter lesions in a 70 year-old hypertensive patient on axial FLAIR image (upper row) and ADC map (lower row). Note the increased diffusion (ADC) corresponding to areas of WMH (FLAIR).
18
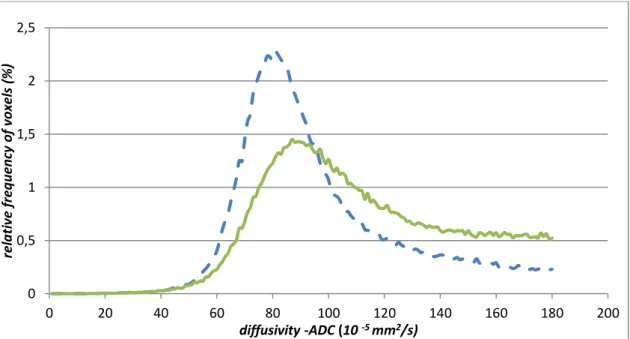
Figure 4. ADC histogram of the patient on Figure 3 (green line) compared to a normal control (dashed blue line), diffusivity thresholded at 180x10 -5 mm2/s.
1.2.3. Cerebral microbleeds Definition
Gradient echo (or T2* weighted) imaging is a sequence highly sensitive of blood.
With its increasing use the number of visible haemorrhagic brain lesions has grown considerably and even millimetre-sized bleedings in the parenchyma have become detectable.
Cerebral microbleeds (cMB) appear as small (<5 mm), homogenous, rounded foci of low signal intensity on T2* images 109 (Figure 5). The signal loss is caused by hemosiderin –a paramagnetic blood degradation product that remains in macrophages for several years after haemorrhage indicating previous blood extravasation 110. Thus the age of cMBs cannot be determined by MRI but the total haemorrhage burden can be assessed. Cerebral microbleeds appear larger on T2* images than the real tissue lesions due to the “blooming effect” of the MR signal 111. The few studies relating cMBs on MRI to histopathological findings revealed focal hemosiderin deposits from the rupture of small vessels showing evidence of arteriolosclerosis or occasionally amyloid angiopathy clearly indicating an underlying small vessel pathology 18, 112.
Differential diagnosis
0 0,5 1 1,5 2 2,5
0 20 40 60 80 100 120 140 160 180 200
relative frequency of voxels (%)
diffusivity -ADC (10 -5 mm2/s)
19
CMBs need to be distinguished from other causes of focal signal loss on T2* images.
These include: flow voids of small arteries in cross-section that can be followed on consecutive/neighbouring slices; the usually symmetrical calcifications or iron deposits in the globi pallidi that appear hyperdense on CT; type IV cavernous malformations and capillary teleangiectasias; foci of hypointensity compatible with hemorrhagic shear injury in head trauma, and even artefacts of metallic materials released from mechanical heart valves 113, 114. Etiological differentiation of signal loss is based on the location, number and distribution of lesions, associated imaging findings and patient history.
Epidemiology
CMBs have been found in various patient populations as well as healthy elderly. Their occurrence was the most frequent in patients with intracerebral haemorrhage (ICH) and lacunar infarcts (due to hereditary or sporadic cSVD), less so in ischemic stroke patients of other subtypes. The most comprehensive review on cMB published in 2007 pooled data from comparable studies and found the overall prevalence of cMBs to be 5% among healthy adults;
34% in ischemic stroke patients; and 60% in patients with ICH. The prevalence according to ischemic stroke subtype was 54% in lacunar-, 36% in atherothrombotic - and 19% in cardioembolic stroke. 38% of CADASIL patients had cMB. CMBs were more prevalent among patients with recurrent than first-ever stroke (44 vs 23% for ischemic and 83 vs 52%
for haemorrhagic stroke) 115.
Clinical significance
CMBs were found to be associated with age, hypertension, other manifestations of cSVD (lacunar infarcts and WML), previous ischemic stroke and ICH, and an increased risk of recurrent lacunar infarct or ICH in those with lacunar infarct or ICH 115. These findings further emphasize the common pathophysiological basis for cMB, LI, WML and ICH. Studies have shown that the anatomical distribution of ICHs is similar to that of cMBs in individual patients, but it is not the pre-existing cMBs that evolve into major haemorrhages 116. Similarly several cases have been reported where patients with cMBs developed major haemorrhage after thrombolysis or antiplatelet therapy remote from the cMBs 117. Thus cMBs can be considered as markers of a diffuse, bleeding-prone microangiopathy. This raised the important
20
question whether patients with cMB are at an increased risk of ICH when treated with antiplatelet, anticoagulant or thrombolytic agents. For the time being there is no sufficient evidence to give a definite answer (some studies reported an increased risk, others not, all of them underpowered to draw firm conclusions) 117-121. However some stroke centres already incorporate cMBs in their treatment decisions.
In conclusion cMBs are markers of a haemorrhage-prone cSVD and predictors of recurrent vascular events (be it ischemic or haemorrhagic). At present they cannot be considered as a contraindication to antithrombotic or thrombolytic therapies, but may play a role in the individual stratification of haemorrhagic risk, and may be incorporated in the design of clinical trials of anticoagulation/antiaggregation drugs.
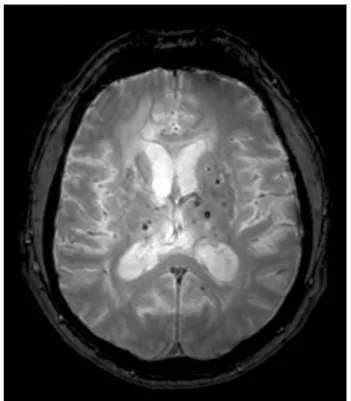
Figure 5. Multiple cMBs in a 48 year-old hypertensive patient on axial T2* image.
1.2.4. Brain atrophy
Brain atrophy is best evaluated on T1WI and appears as shrinkage of brain parenchyma with a reduction of cortical thickness and an increase of internal and external CSF spaces. It can be assessed by visually rating the degree of ventricular dilatation and
21
sulcal widening, by measuring the width of sulci or ventricles in a standard location, or by different three-dimensional volumetric methods that have now become the methods of choice.
Brain atrophy is a common phenomenon in normal ageing that increases progressively beyond the age of 65 years 122. This process can be accelerated by numerous cerebral pathologies causing diffuse brain tissue loss such as degenerative diseases (like Alzheimer’s disease and other primary dementias) 123, demyelinating diseases (MS) 124 and cerebrovascular disorders (Figure 6). In these latter conditions, the importance of brain atrophy has only recently been recognised. A number of imaging studies using quantitative brain volumetry demonstrated atrophy in both focal and diffuse cerebrovascular diseases 125-
128. Brain atrophy correlated strongly with the clinical status and cognitive scores, and proved to be a sensitive marker of disease progression in cSVD 106, 129, 130
. It is now widely accepted that purely subcortical cSVD can lead to cortical volume loss 130, 131. How subcortical ischemic damage leads to cortical atrophy is not fully elucidated, but the diffuse and/or remote effect of lacunar lesions and tissue microstructural changes through Wallerian degeneration, secondary axonal loss due to deinervation and local or remote neuronal apoptosis are possible mechanisms 20, 125, 132, 133
.
Brain atrophy is an aspecific finding and can be regarded as the final common pathway in the pathophysiology of various cerebral pathologies. As in degenerative diseases, atrophy is now recognized as a strong marker of disease progression in cSVD and thus could serve as a surrogate marker in future clinical trials similarly to whole brain diffusion histogram parameters 134.
22
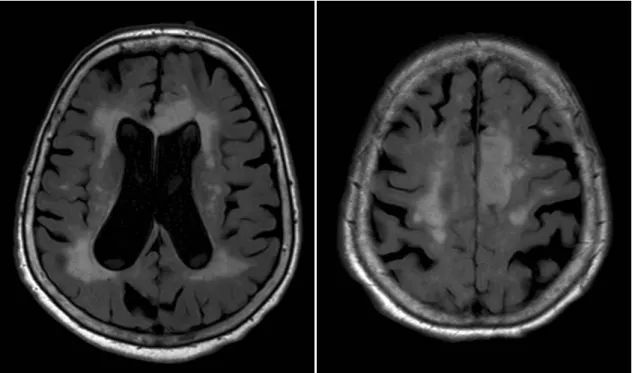
Figure 6. Widespread WMH and diffuse brain atrophy in a 89 year-old hypertensive patient on axial FLAIR images.
1.2.5. Summary
New and continuously developing MRI sequences and postprocessing techniques have greatly helped to explore and better understand cSVD. Diffusion MRI methods have proved to be particularly useful in: i. visualizing hyperacute LIs thus guiding acute phase therapy and etiologic diagnosis (DWI); ii. detecting ultrastructural changes even in otherwise normal appearing WM, and quantifying the global burden of tissue damage in cSVD (whole brain DTI/DWI histogram measures). Brain atrophy –a phenomenon previously considered to be related to cortical disease- is now recognised as a marker of cSVD based on studies using volumetric measures. In the future an increasing use of quantitative MRI techniques (diffusion histograms, volumetry) can be expected as they are more sensitive to the full spectrum of cSVD expressions, and could provide surrogate markers for disease progression in future therapeutic trials for patients with cSVD. The utility of different MRI sequences in cSVD is summarized in Table 3.
23
Table 3. Utility of different MRI sequences in cSVD. Abbreviations can be found in the text.
T1
cavitated, chronic LIs appear hypointens („black hole”)
good for evaluation of brain atrophy and cortical thickness, volumetry as surrogate marker
T2
subacute LIs appear hyperintens (fluctuating); good visualisation of VRS
white matter damage appears as WMH; good for judging deep WMH FLAIR
(sub)acute LIs give more stable high signal; good for detection of periventricular LIs, differentiates acute (hyperintens) from chronic (hypointens) LIs
white matter damage appears as WMH; good for judging both deep and periventricular WMH
T2*
cMBs appear as small, hypointense foci, marker of bleeding-prone microangiopathy
DWI
the only method to visualize (hyper)acute LIs that give high signal on DWI, low signal on ADC; acute lesion patterns guide differential diagnosis
chronic LI gives low signal on DWI, ultrastructural tissue damage causes increased diffusivity (high signal on ADC map), whole brain ADC histogram as surrogate marker?
DTI
localisation of LIs in relation to WM tracts (tractography)
ultrastructural tissue damage causes increased diffusivity (high signal on MD map), whole brain MD histogram as surrogate marker
24
1.3. CADASIL and other hereditary small vessel diseases of the brain
1.3.1. CADASIL as a model disease
CADASIL (Cerebral Autosomal Dominant Arteriopathy with Subcortical Infarcts and Leukoencephalopathy) is a hereditary small vessel disease of the brain caused by mutations of the NOTCH 3 gene encoding a transmembrane receptor of vascular smooth muscle cells 9. It has recently gained great interest in vascular neurology as the most common heritable cause of stroke and vascular dementia in adults. This autosomal dominant cSVD –unlike the sporadic, hypertensive form- appears already in adult midlife in the absence of vascular risk factors with ischemic episodes and progressive dementia. Its first clinical manifestation can be migraine with aura, and is often associated with psychiatric disturbances. The MRI changes may precede symptoms by more than a decade 135. Apart from the well known and above discussed radiologic manifestations of cSVD in general, CADASIL has a unique feature:
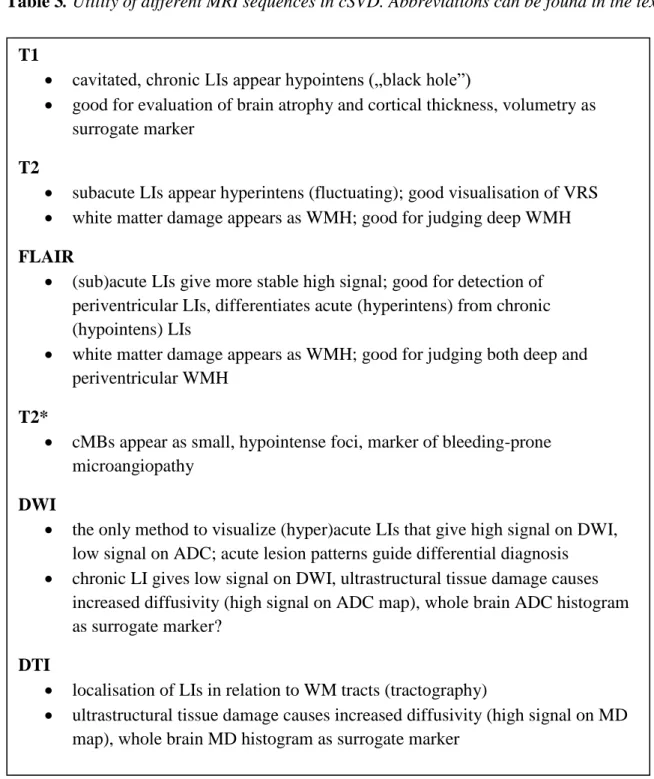
WMH symmetrically involving the temporal poles and the external capsule 136, see Figure 7.
This characteristic pattern can be considered specific to the disease and is an important point in differential diagnosis 137-139 The special importance of this disease lies in the fact that CADASIL provides a pure genetic model for cSVD without the confounding factors of comorbidities and advanced age. Thus insights into CADASIL may help us better understand the more common sporadic forms as well.
25
Figure 7. Characteristic MR changes on axial FLAIR images in a 54 year old CADASIL patient: A: WMH in the pons and temporal poles (large arrows). B: Enlarged Virchow-Robin spaces (short arrows), lacunar infarct in right thalamus (long arrow), WMH of the external capsule. C: Frontal, periventricular and external capsule WMH (large arrows). D: WMH in corona radiata (large arrows).
26
1.3.2. Other hereditary small vessel diseases of the brain
Besides CADASIL an increasing number of different hereditary small vessel diseases of the brain are being described (see Table 4.). To date the causal genes of four disorders with predominantly cerebral but also extracerebral involvement have been identified 140. The autosomal recessive CARASIL (first described as Maeda syndrome in Japan 141, 142) characterized by spinal deformities and alopecia is associated with mutations in the serine- protease HTRA 1 gene 143. Syndromes affecting cerebral, retinal and renal vessels to a variable extent such as HERNS (Hereditary endotheliopathy with retinopathy nephropathy and stroke) 144, CRV (Cerebroretinal vasculopathy) 145 and HVR (Hereditary vascular retinopathy) 146 that were previously reported independently are now recognized as different phenotypes of the autosomal dominant Retinal vasculopathy with cerebral leukodystrophy (RVCL). It is caused by mutations in the TREX 1 gene encoding an exonuclease implied in the maintenance of vascular integrity 147. Mutations in the COL4A1 gene encoding type IV collagen a1 chain, a component of basement membranes in various organs, have been found to be responsible for an autosomal dominant cSVD along with a whole spectrum of widely variable manifestations in the eyes, kidneys and muscles 148. The most frequent phenotype in adults is characterized by subcortical intracerebral hemorrhages, diffuse cSVD and retinal arteriolar changes. HANAC syndrome (hereditary angiopathy with nephropathy, aneurysm and cramps) -a distinct phenotype- is dominated by systemic manifestations: hematuria, renal cysts, muscle cramps with elevated creatine-kinase and frequently bilateral aneurysms of the intracranial carotid artery 149. Connective tissue changes are prominent in PXE (Pseudoxanthoma elasticum) associated with mutations in the ABCC 6 gene 150.
The exact genetic background of other cSVDs remains to be elucidated. These include Hereditary infantile hemiparesis already manifesting in early childhood 151 as well as other autosomal dominant hereditary cSVDs corresponding to the formal criteria of “Cerebral Autosomal Dominant Arteriopathy with Subcortical Infarcts and Leukoencephalopathy”
without mutations in the NOTCH 3 gene. These conditions such as Hereditary small vessel disease of the brain 152, Hereditary multi-infarct dementia 153, 154, or SAE (Subcortical angiopathic encephalopathy also known as PADMAL i.e. Pontine autosomal dominant microangiopathy and leukoencephalopathy) 155, 156 could be termed as CADASIL type 2, 3, etc. in the future.
27
Table 4: Hereditary small vessel diseases of the brain (Abbreviations can be found in the text)
disease clinical features genetics
CADASIL migraine with aura, stroke, apathy, dementia
NOTCH 3 on chromosome 19q12 CARASIL stroke, dementia, kyphosis, lumbal disc
herniation, bone deformities, alopecia
HTRA 1 on chromosome 10q26
RVCL
HERNS stroke, renal disease, retinopathy, pseudotumors
TREX 1 on chromosome 3p21
CRV stroke, dementia, migraine, retinal capillary occlusions, blindness, pseudotumors, renal disease
HVR retinal microangiopathia, blindness, migraine, Raynaud phenomenon COL4A1-related
diseases
subcortical intracerebral hemorrhages, ischemic stroke, retinal arteriolar changes, hematuria, renal cysts, muscle cramps, intracranial aneurysms
COL4A1 on chromosome 13q34 PXE skin and connective tissue abnormalities,
stroke, blindness
ABCC 6 on chromosome 16p13 Hereditary infantile
hemiparesis
infantile hemiparesis, retinal hemorrhages, migraine with aura
unknown Hereditary small vessel
disease of the brain
stroke, memory loss unknown
Hereditary multi-infarct dementia
stroke, cerebellar symptoms, dementia unknown PADMAL (or SAE) stroke, dysarthria, dementia unknown
_________________________________________________
In the remaining part of this thesis I will present two studies performed in the world’s largest cohort of CADASIL patients from the Lariboisière Hospital in Paris where the disease was identified, and the term CADASIL coined. The first one (Study 1) aimed to evaluate gender related differences in the clinical and MRI characteristics of the disease. It has recently been published 157. The second study (Study 2) investigated the possible role of a DWI derived quantitative MRI method in disease monitoring.
28
2. Purpose
2.1. Effects of gender on the phenotype of CADASIL (Study 1)
In the general population, migraine, cerebrovascular diseases and vascular dementia differ in many aspects between men and women. The prevalence of migraine appears to be 3- 4 times higher in women than in men.158-161 In women, migraine is further influenced by the different stages of the reproductive life (menarche, pregnancy, menopause) or by the exposure to exogenous sex hormones such as contraception.162 In contrast, the age-adjusted prevalence and incidence of stroke are respectively 30 and 40% higher in men than in women. 163 A similar trend for male sex is observed for the prevalence and incidence of vascular dementia.164, 165 Accumulating evidence suggests that these differences may be related to female hormones that can both modify the excitability of the cortex 166, 167 and exert major neuroprotective effects.168, 169
CADASIL is considered as a model of “pure” subcortical ischemic vascular dementia and as a typical cause of secondary migraine with aura of vascular origin. Although some differences were previously reported between men and women in CADASIL 170, the exact role of gender in determining the phenotype of the disorder has not been specifically investigated.
In the present study, we evaluated the gender effect on the clinical and neuroimaging manifestations of CADASIL in a large cohort of CADASIL patients.
29
2.2. Whole brain ADC histogram in CADASIL (Study 2)
Unlike the conventional T1 and T2-weighted MR sequences, diffusion MRI is an imaging method that provides key information about the microstructural integrity of the cerebral tissue 99. Alterations of diffusion tensor imaging (DTI) metrics (mean diffusivity – MD and fractional anisotropy –FA) were observed both inside and outside areas of increased signal on T2-weighted or FLAIR images in various white-matter disorders 102, 171-175
. In conditions with diffuse tissue lesions -such as multiple sclerosis, hypertension related cSVD, CADASIL or even in dementia or aging- a global, quantitative approach based on whole brain histograms of diffusion was found to be more informative about overall disease severity than using predefined regions of interest (ROI). Various DTI histogram parameters (mean value, median value, peak location, peak height, kurtosis, skewness) have been reported to correlate with clinical scores in these conditions both in cross-sectional and longitudinal studies.
Moreover they were more sensitive than clinical scales in detecting change over time 96, 103,
106-108, 176-181
. In CADASIL, MD measured with DTI over the whole brain has been found to vary before any significant clinical change during follow up and to predict disease progression. DTI measures were then proposed as potential adjunct outcome measures in future therapeutic trials in CADASIL or in other cSVD 103-105, 129, 182
. The effects of sequences, scanners on DTI measures has been evaluated cross-sectionally in a small number of healthy volunteers 183, 184
Measures of ADC over the whole brain from diffusion weighted imaging (DWI) commonly used in stroke patients without the use of much operator dependent post- processing may be an alternative method to obtain diffusion histograms. The main advantage of this approach would be the wide availability, simplicity and rapidity of the method suitable for everyday clinical use. The main drawback for longitudinal follow up studies with this method would be the variability related to the imaging-reimaging sessions, update of MRI sequences and changes of scanners.
In the present study, we aimed to evaluate whether ADC histograms obtained in a clinical setting would be suitable for follow up studies in cSVD as CADASIL. For this purpose, data from a large cohort of CADASIL patients with a follow up of 3 years were analyzed. The longitudinal evaluation of data is underway.
30
3. Methods
3.1. Subjects
A total of 313 CADASIL patients having a typical mutation of the Notch3 gene were included in Study 1. They were recruited from a large prospective cohort of patients investigated in Lariboisière Hospital in Paris (n=191) and the Ludwig Maximilians University’s Neurology Clinic in Munich (n=122). The study was approved by an independent ethics committee at both centers; all patients gave a written informed consent to participate. 348 patients from the same cohort were included in Study 2.
3.2. Clinical evaluation
All subjects underwent a detailed neurological examination during the 2 hours preceding MRI examination, including a Mini-Mental State Examination (MMSE), Mattis Dementia Rating Scale and modified Rankin scale (mRS). Clinical and demographic data were collected including age, sex, cardiovascular risk factors (CVRF) including hypertension (defined as diagnosis of hypertension or taking antihypertensivedrugs), diabetes(1997 World Health Organization criteria), hypercholesterolemia (diagnosis of hypercholesterolemia or taking lipid-loweringdrugs), smoking habits and alcohol intake, history of migraine with aura (MA) (IHS diagnostic criteria), stroke, TIA, psychiatric symptoms including depression, apathy (based on Neuropsychiatric Inventory assessment applied in 132 patients only), seizures, gait and balance problems, hearing loss, urinary incontinence and presence of dementia (DSM IV criteria). Patients in Study 2 had follow-up examinations with an interval of 18 months over a period of 3 years.
3.3. MRI
The imaging protocol has already been detailed previously. 20 Briefly, MRI was performed on a 1.5-T system (Vision;Siemens [Munich] or Signa General Electric Medical Systems [Paris] with continuous updates [GE Signa 08, 09, Excite 11, 12, 14]). Three dimensional and millimetric T1-weighted MRI and FLAIR, T2*-weighted gradient echo, proton densityanddiffusion-weighted images of 5 mm thickness were obtained over the entire brain in axial planes. The parameters of diffusion-weighted imagingare as follows:Siemens:
TR/TE 5100/137 ms, slice thickness 5 mm, interslicegap 1.5 mm, 128x128; b-value = 1000;
31
General Electric: TR/TE 8200/83 ms, slice thickness5.5 mm, interslice gap 1.5 mm, 128x128;
b value = 1000 s/mm2.
To obtain ADC maps, diffusion-weighted imaging (DWI) scans were acquired in the X, Y, and Z directions and then averaged to make ADCmeasurements largely independent of the effects of anisotropicdiffusion. Apparent diffusion coefficient values were then calculated for each voxelto generate ADCxyz maps.
In a subset of patients Diffusion tensor imaging was also performed on GE Signa in 23 directions (B 0 and B = 700 in 23 directions; TR: 7500, TE: 98.8, EC: 1/1, bandwidth : 91Khz, thickness =5.5mm, 23 slices, matrix: 128*128, 1Nex). Eigen-vectors were obtained from all 23 directions for each voxel and eigen values were used for calculation of mean diffusivity (MD = Trace/23).
3.4. Image processing and analysis
Image processing and analysis for Study 1 have been previously reported by Viswanathan et al.185 A dedicated software (Brainvisa) was used to determine the global brain volume from T1-weighted MR images after exclusion of CSF containing voxels in addition to the the volume of the intracranial cavity assessed on proton density images. Brain parenchymal fraction (BPF) was defined as the ratio of total brain tissue volume to the total intracranial cavity volume: BPF = (brain tissue volume/intracranial cavity volume) x 100. The volume of WMHs was obtained on FLAIR images, that of lacunar lesions on T1 scans. The total volume of WMH and that of lacunes were normalized to the intracranial cavity in each patient: normalized volume=( total volume / intracranial cavity volume) x 100. The number of microbleeds (MB) on T2* sequences was also recorded in each patient.
For Study 2 MD and ADCxyz were first calculated over the whole volume of the brain.
Histograms were obtained using a bin width equal to 0.1 x 10⁻⁴ mm2/s and normalized over the number of voxels to correct for individual differences in brain size. The mean value, peak location and peak height of diffusion histograms were used for analysis.
Histograms derived from MD maps and obtained after CSF removal using a cutoff value of diffusion at 18 x 10-4 mm2/s were used as the reference method for analysis of the parameters derived from ADCxyz histograms.
32
To select the ADCxyz histogram parameter best suited for clinical studies, correlations between parameters derived from MD histograms and those derived from ADCxyz histograms were first analyzed before and after removal of voxels containing CSF using the cutoff value of 18 x 10-4 mm2/s. Thereafter, correlations between parameters derived from MD and ADCxyz histograms were evaluated before and after the manual removal of artifacts at the bone-air interface by an experienced neurologist; and before and after exclusion of the top and bottom 3 slices (containing the most artifacts and peripheral CSF).
The parameter derived from ADCxyz histograms that best correlated with the reference method and was most independent from segmentation was chosen for subsequent analysis. A mixed-effects model was used to evaluate the effects of technical updates or change of scanners as seen in a clinical setting on diffusion parameters. Finally, the ability of parameters derived from ADCxyz histograms to predict the clinical course of CADASIL during the follow-up study was analyzed taking into account these potential limitations.
3.5. Statistical methods
In order to investigate the relationship between clinical manifestations, cognitive scores and MRI parameters between men and women in Study 1, we used the Student’s t tests or Wilcoxon tests for categorical variables and ANCOVA for continuous variables. The comparison between men and women was performed after adjustments for age, history of cardiovascular disease, hypertension, diabetes, and education level according to the parameter under investigation. Comparisons were also made between women and men over or under the median age of the population (which corresponds approximately to the usual age of menopause) to investigate a potential hormonal influence. P values ≤0.05 were considered statistically significant.
In Study 2 correlations between the different parameters were evaluated by linear regression analysis and Bland-Altmann plots using JMP 8 software. A mixed-effects model was used to assess the magnitude of MRI scanner effect in the adjusted analysis of DWI parameters and clinical scores.
33
4. Results
4.1. Gender related differences
The clinical and MRI data from 313 patients (172 women and 141 men) whose mean age was 51 ± 11.4 years (women: 50.4 ± 12.2 years ; men = 51.8 ± 10.3 years) were analyzed.
No significant difference was detected for the main cardiovascular risk factors (hypertension (22.6 in men vs 19.8% in women), diabetes (3.1 vs 1.5%), hypercholesterolemia (40.3 vs 43.0%), current smoking (25.2 vs 19.4%) and for any cardiovascular risk factor (79.7 vs 87.2%), with the exception of alcohol consumption (men: 79.1%;women: 49.7%, p<0.001).
The frequency of the main clinical manifestations of the disorder according to gender are presented in Table 5. The prevalence of MA was higher in women than in men. This female predominance was significant only in subjects under 51 years of age. Conversely, stroke events were more prevalent in men. This difference was also significant only in subjects aged less than 51 years.
In contrast the prevalence of TIA, age at first stroke and number of stroke events did not differ according to gender. We found no significant difference between men and women in the prevalence of dementia, psychiatric symptoms including depression, seizures, gait and balance problems, hearing loss and urinary incontinence. In contrast, apathy was found to be twice more prevalent in the male group, a difference significant both before and after 51 years.
34
Table 5: Main clinical manifestations according to gender
A: Prevalence (%) in the entire cohort
Women Men P*
migraine with aura 44.2 31.2 0.02
stroke 57.6 74.5 0.003
TIAs 38.1 29.5 0.14
age at first stroke (year; mean, SD) 49.2 (10.5) 48.2 (9.9) 0.30
multiple stroke events (in stroke patients) 52.0 55.2 0,35
psychiatric symptoms 47.7 44.0 0.48
apathy 26.1 57.1 0.0001
dementia 10.5 15.6 0.20
*adjusted for age, history of cardiovascular disease, hypertension and diabetes where appropriate
B: Prevalence (%) in subgroups of patients according to age more or less than 51 years
≤ 51 years > 51 years
Women Men P* Women Men P*
migraine with aura 53.6 35.4 0.03 35.2 27.6 0.30
TIA 33.3 23.9 0.36 40.6 33.9 0.44
stroke 40.5 70.8 0.0002 73.9 77.6 0.64
Age at first stroke (year; mean, SD)
39.1 (0.8)
39.2 (0.7) 0.91 55.2 (0.7) 54.0 (0.7) 0.17
psychiatric symptoms 40.8 41.5 0.90 54.6 46.1 0.28
apathy 3.3 44.8 0.0002 43.6 67.7 0.04
dementia 2.4 6.2 0.40 18.2 23.7 0.39
*adjusted for history of cardiovascular disease, hypertension and diabetes where appropriate
35
The characteristics of MA in the two groups are presented in Table 6. In women, MA started at an earlier age (under 30 years in the majority of migraineurs) than in men. More women than men experienced visual and aphasic auras. The prevalence of sensory and motor auras as well as the frequency of migraine episodes, duration of aura and of headache and presence of triggering factors did not differ according to gender.