Quality Improvement Based on a Process Management Approach, with a Focus on University Student Satisfaction
Bálint Bedzsula, János Kövesi
Department of Management and Corporate Economics, Faculty of Economic and Social Sciences, Budapest University of Technology and Economics
Magyar tudósok körútja 2, H-1117 Budapest, Hungary kovesi@mvt.bme.hu, bedzsula@mvt.bme.hu
Abstract: Customer oriented conduct and process-based thinking have become quasi-vital pillars of long-lasting competitiveness, for the business world today. Following this approach should result in satisfied customers, decreased costs and efficient employees.
However, the leadership in higher education is just starting to learn this way of thinking.
The increasing focus on quality issues and the process-related approach to this is catalyzed by several factors. For this reason, we have decided to take the analysis of a novel approach in higher education as the main topic of this study. The focus of our analysis is the organizational process of preparing the Scientific Students' Associations (SSA) conference; this conference is an indispensable element in the effective nurturing of talent.
We used a questionnaire-based survey – which provided an in-depth analysis of the different elements of the SSA activities – to make proposals related to possibilities for improvement that could increase the satisfaction of university students.
Keywords: higher education; talent nurturing; process management; university student satisfaction questionnaire; quality improvement
1 Introduction
The quality of higher education has received growing attention in Hungary over the last couple of decades. This is similar to the experience in other European countries: higher education has become a mass market service, characterized by a growing number of students and increasingly distinctive institutions [1].
Simultaneously, with the transformation in higher education in Hungary, State support, for University Students, in social sciences and economic studies basically ceased to exist, resulting in students having to pay for their education. These issues have increased quality-related demands regarding both the content and the
supporting processes of education. In the meantime, the competition between institutions for students has also grown [2].
For these reasons, constant measurement and increases in efficiencies in student satisfaction have gained more traction [3]. An institution in the current Hungarian higher education system can best gain new students and keep its current base by achieving a suitable level of student satisfaction and actively managing the results.
Several ranking processes also support this argument, as they put significant focus on measuring and documenting student satisfaction.
It has been proven that process-based organizational development could be the best practical solution for the efficiency increase mentioned above. Our paper aims to illustrate and prove the significance of this approach.
2 Literature Review
2.1 The Interpretation of Quality in Higher Education
Higher education is a service based on a special technology: the object of the technology is the student, and the one who implements it is the professor. [4] The final result of an education process that lasts for several years is that qualified students become professionals. This fact means that it is not easy to define the customer, but, in accordance with the approach that is nowadays widely accepted, we regard the student as the primary customer [5]. It is therefore, important to consider student feedback concerning the quality of the service provided by the higher education institution [6].
With respect to this special ‘technology’, education quality is the key issue for higher education. Crombag [7] divides this expression into two aspects: the efficiency of education (the time- and cost-efficient implementation of knowledge transfer) and the quality of graduates (the amount, depth and usability of the knowledge students have when they enter the labor market). This approach clearly implies that further factors, such as supporting administrative processes and infrastructural features, also have a significant impact on the quality of education.
2.2 Process-based Thinking
In order for organizational processes to work continuously and efficiently, different organizational features (i.e. ‘enablers’) are required, which Hammer [8]
classified into the following five categories: creating a process model, following up on the process with numerical measures, preparing the implementers of the
To implement these features successfully, in the long run, a wide-scale, strategic approach is necessary, which requires organizational culture change as a main element [9]. The process-based approach and process management have both become so widespread nowadays that it is difficult to imagine any quality management system that does not use them. The crucial features of the approach are also described by some of the principles defined by Hammer [10]:
All work can fit into a process
Any process is better than not having one at all
Even a good process can be made better
A well-defined and regulated process structure serves as a starting point for further management activities, irrespective of the process management approach or process improvement principle that we use. A detailed mapping of the processes is an unavoidable task, as this will help us to get to know and understand how the company/organization works.
Recording the processes within the organization can be very advantageous:
process procedures do not have to be invented, the responsibilities are clear for everyone, and the tasks are carried out – if careful considerations are applied – in an optimized way. There is usually serious resistance to change within an organization, but involving the employees in the changes and the creation of new systems, can positively affect the issues [11].
The examples set by foreign higher education institutions and in related domestic and international studies, however, increase the need for an institutional quality and process management environment [12]. Most of these institutions started to establish their own systems on an ISO, TQM and EFQM or ENQA basis, with some success. It is important to highlight the fact that the system models mentioned above all expect a process-based approach (the management of processes).
With regard to the characteristic features of higher education institutions, it is our view that a comprehensive implementation of the process management approach is also possible without relying on the systems briefly discussed above, as a result of that, the demand for efficient organizational work, which is the result of a lack of financing; customer orientation, which is more popular as the market size decreases (and requires, for example, clear, transparent, and consistent administrative measures) and supporting information systems become more pervasive, as a result of institutional developments.
2.3 Structured Measurement System
The approach based on process management related to quality improvement starts with process identification and the creation of a structured measurement system
based on this. Identifying the key elements and mapping their essential quality- related features are essential elements at this stage. Afterwards, quality indicators can be determined, the necessary measurements can be carried out and the results can be evaluated in order to identify the possibilities for improvement.
A quality indicator is a measurement index that provides information about past and present events and circumstances in a numerical form, to allow the measurement and evaluation of quality. It has to signal the deviating values, so that certain areas can become highlighted, for which a more in-depth examination and/or analysis is required. Quality-based indicators related to several levels of the higher education process, are necessary, in order to analyze the concept of quality, which is, effectively, too complex and unmanageable [13].
There are three different levels of quality indicators. Institutional/faculty indicators assist the work of the senior management. Quality indicators support operational decision-making, with the aim of measuring institutions’ internal operations directly, and creating a basis for key indicators. Finally, there are also measurement units that help to evaluate and improve processes, and support the decisions of process administrators [14].
When it comes to improving domestic higher education institutions, it is worth starting from two sources: the systematically collected, wide-ranging and abundant data stored in IT systems and the feedback from satisfaction-related questionnaires. By performing a systemization, selection and evaluation of these data, we can establish quality indicators that are suited to the system-related requirements. Regularly analyzing these, in the long run, can help to track performance and to reach objectives in system improvement, and a comparison with other systems can also be achieved.
3 Case Study
In parallel to the increased mass marketing of higher education, nurturing talent still continues to be a strategic task of every higher education institution. As this mass marketing continues, we are convinced that it is of great importance to manage the process of nurturing talent according to scientific standards. The importance of the traditional master–student relationship is not to be neglected, although mass education requires other types of relationships, processes and methodologies, as well.
Our case study analyzes the process by which a Scientific Students' Associations (SSA) Conference of the Faculty and Economics and Social Sciences (FESS) at the Budapest University of Technology and Economics (BUTE) is organized.
The SSA conference is an important tool and opportunity for students to learn about new and interesting research areas beyond their direct everyday study activities and to enrich their professional experience. In this way, the SSA conference is also a quality-increasing tool that contributes to the increase in student satisfaction and the university’s reputation. For this reason, an analysis of how the system works and how motivated the students are assists with the quality improvement practices of the faculty [15].
The organizing process is composed of several elements and a system built on these elements, but of course, it is also closely related to other educational and education-organizing processes regarding the nurturing of talent. The SSA itself is not suited to studying and supporting talent; for this, quality-oriented management of the whole educational-training process is necessary. The SSA activity is organized and managed by a faculty committee, at BME. We have collected their experiences in the field, after worked for several years within the faculty committee leadership.
3.1 Determining the Process
Drawing a flowchart is an excellent way of making a visual representation of a process and understanding its actions, activities and steps. By making the connecting points of each step in the process transparent, the flowchart can enable a flawless operation. For a flawless performance, an understanding and overview of the administrative processes that support education and the nurturing of talent in the mass market of higher education is essential.
For the University, the organization of an SSA conference is part of the basic research process, although it also contains several administrative elements. The process we analyzed was made up of a chain of events, starting from the first announcement of the conference and ending with the concluding steps after the award ceremony. We did not consider the connecting points to other processes, as we do not deal with these within this paper. The process is not logically complicated, and it is linear in terms of the structure. We considered the SSA Committee’s decision about the date of the conference as the primary step. The core part of the process falls into a period of the first three months of the autumn semester. The main activities are the following:
Spreading the call for the conference, advertising – organizers
Registration the students (intention of participation, recording basic data and a summary, starting on 1st September) - organizers
Preparing and submitting the papers - students
Grouping the papers into sections, setting up commissions – organizers
Preparing a program booklet – organizers
Preparing for the presentation – students
Organizing the conference and participating in the conference – students and organizers (typically organized in the middle of November)
Administration concerning the results, data provision – organizers The activities of students and institutional participants usually succeed each other during the organizing process, and the SSA secretary has a key role in these steps.
A complex process diagram that contains all the tasks of everyone involved is too composite: it helps with an overview, but it is not particularly useful for clarifying personal roles. Thus, the responsibility circles are represented with pools and swimming lanes on the complex process diagram. Student satisfaction is the focus of our improvement, and the process has a significantly large number of participants in student-related roles. Therefore, we have prepared a simplified exhibit which only represents students’ activities, thus keeping the connection points and putting the focus on the student ‘lane’. The deadline for the activities was added on top of these, as that is the most critical element of the organization.
For the preparation of the process diagram, we used a simplified version of the rules of BPMN (Business Process Model and Notation). Figure 1 shows a part of the process, prepared in ARIS Express.
Figure 1
Part of the process diagram focusing on students
Information provision and deadline-related risks may arise at the level of the process steps. Transparent, detailed guides were prepared about certain tasks to mitigate these risks, and these were sent to the students in an email, as part of the steps for organizing the process. Additionally, as deadlines drew close, reminder emails draw the students’ attention to carrying out tasks as soon as possible.
Further studies and research are possible in our view with the method of strategic technology road-mapping. This form of the method [16] could support both the process development in strategic analytical and marketing approach, and the visual systematization of the available information.
3.2 Identification of Measurement Indexes
Regarding the critical elements of the process, quality is a decisive factor for both the student and the institution, and quality can be ensured by performing certain tasks properly during the execution phase, in accordance with the deadlines.
Although some steps and the whole process itself can only be effectively assessed after the conference, this assessment can still ensure that there is adequate preparation for the next year.
The following process indicators are examined: number of papers; number of applications after the deadline; number of papers submitted after the deadline;
number of application-related technical problems; number of students pulling out of the competition, in proportion to the number of applicants, and proportion of prizewinners to participants; average number of students per supervising professor; proportion of SSA-participants in the latter PhD education; number and performance of students who were delegates to the National SSA Conference; and student satisfaction with the organization, infrastructural resources, and evaluations.
Some of the indicators can be determined from data extracted from the relevant administrative system, while some are measured with the help of a student questionnaire that is sent to students after the conference.
By using a web-based administrative system, a wide range of indicators can be measured. As an example, we present how three of them have developed over the last few years (Figure 2).
0%
5%
10%
15%
20%
25%
30%
35%
0 20 40 60 80 100 120 140
2011 2012 2013 2014 2015
Number of presented papers
Proportion of papers that were nominated for the National SSA Conference
Proportion of papers that remained incomplete in the process
Figure 2
Development of measurement indexes in the last five years
A tendency can be observed in the decreasing number of papers. This is because the faculty has put a greater focus on the quality of the papers that can be submitted: authors have to come up with carefully composed work of their own.
During the conferences, we do our best to avoid using applicants who drop out during the preparatory period. To achieve this goal, we advise students to start their work in the semester prior to the conference, to plan their tasks and to make these tasks transparent. The number of papers submitted to the National SSA Conference has been constantly growing, over this period, as a result of a conscious decision to have as many faculty representatives and prizewinners there as possible.
We used the questionnaire method to collect information from the students involved. Our questionnaire (Figure 3) had the primary aims of assessing student satisfaction related to the important steps and to the significant actors in the process, collecting general feedback, and identifying improvement possibilities.
As the process can be interpreted as a service provision, we used the ten service dimensions of Berry et al. [17] and the groups represented by the SERVQUAL model [18], to set up a list of questions for our questionnaire. Questions Q1-Q18 are all closed, process-related questions with positive content, which students evaluated using a four-level (1 – absolutely not, 4 – completely) scale. To inquire about the composite reputation of the conference, we applied the Net Promoter Score (NPS) method (Q19), which is also used in various service sectors to measure customer satisfaction. In practice, this means the evaluation of one simple question… ‘What is the likelihood of you recommending the organization/service to your friends or colleagues?’, on an 11-point scale [19]. We consider students’
informal ‘recommendations’ of the SSA conference as a facultative program of great importance, and thus the method is worth applying. We also included three open questions (Q20-Q22) in the questionnaire, in order to make room for the formulation of individual and borderless opinions, and these questions covered the following: strengths, fields in need of improvement and additional feedback. It is an important goal at our faculty to include as many students as possible in the talent nurturing process of the SSAs, and therefore we also added some questions about student motivation and application circumstances (Q23-Q27): time of and reason for application [20], number of working hours spent on the SSA, relationship with the topic, and contact with the supervisor. We concluded the questionnaire with questions about the participants: their level of education and the faculty at which they were studying (Q28-Q29). In addition to the replies given to all these questions, we recorded one further piece of information about the responding students: the place they achieved at the conference (1st, 2nd, 3rd place, laude (4) or no place achieved (5)). They did not have to provide us with this information, as the questionnaires were sent out separately, in accordance with the five possible cases.
All the students who participated in the conference received a hyperlink to their contact email address directing them to the electronic questionnaire. One week was provided to fill it out.
To what extent do you agree with the following statements? (1 – absolutely not, 4 – completely) 1. Tasks and expectations related to the SSA conference were clear and easily understood.
2. The timing of the SSA conference was transparent and easy to plan against.
3. Tasks related to the SSA conference could be completed without any serious problem.
4. Instructions on the tasks to be completed and upcoming events were appropriate.
5. My supervisor was informed about the SSA to a necessary extent (general proceedings, some important information)
6. The faculty SSA’s secretary was helpful and attentive.
7. Contact with the faculty SSA’s secretary was appropriate (I could reach or could have easily reached him if needed)
8. The web portal gave effective help in the application process.
9. The program booklet contained all the essential and relevant information.
10. Presentational tools (e.g. laptops, projectors) were of appropriate quality and worked without any problems in our section.
11. I am satisfied with the venue (e.g. size, formation, location) for my section.
12. The commission for my section was well-prepared professionally and in how it dealt with the papers.
13. The commission for my section was objective and consistent in its work.
14. The final result and the prize-giving were professionally valid in my section.
15. The prize-giving ceremony was organized appropriately.
16. Overall, the conference was well-organized.
17. Participating in the conference was useful for me in a professional sense.
18. Participating in the conference was a positive experience for me.
NPS value (0 – absolutely not, 10 – I would recommend it absolutely)
19. On the whole, to what extent would you recommend the FESS SSA Conference to your fellow students?
Regarding the steps of the organizing process and the overall organization (open questions):
20. What did you like about the organization, the preliminary steps and the process of the conference?
21. What and how should we change to make the conference even better for next year?
22. What further comments or suggestions do you have about the conference?
Application-related questions (closed questions):
23. When did you decide to participate in the conference?
1. One year prior to the conference, or earlier.
2. In the spring semester just before the conference.
3. In the summer directly before the conference.
4. In the registration period of the conference.
24. How did you make contact with your supervisor regarding your SSA participation?
1. You contacted a professor/supervisor, and it was your idea to participate.
2. The professor/supervisor contacted you, and your participation was his idea.
3. This cannot be clearly stated, as the idea and the getting in touch were mutual.
25. How was the decision for participation made?
1. You chose to do research in a field that you were already acquainted with, using the help of a supervisor or professor that you had known from an earlier course.
2. You chose to do research in a field that was completely new for you, using the help of a supervisor or professor that you had known from an earlier course.
3. You chose to do research in a field that was already somewhat known to you, using the help of a new, unknown supervisor or professor.
4. You chose to do research in a field that was completely new for you, using the help of a new, unknown supervisor or professor.
26. How much time did it take for you in total to write your paper?
27. To what extent were the following factors important for you when applying? (closed questions, on a four-point scale: 1 – absolutely not, 4 – completely)
a presenting the results of academic work you had previously conducted b getting to know an interesting problem/field of science
c enjoying the experience of conducting research d developing my presentation skills
e preparing for my thesis or diploma project
f earning bonus points to continue my education (for a Master’s or PhD degree) g achieving professional success and recognition
h earning bonus points for a scholarship (professional, international, university or faculty) i getting the financial reward related to prizes
Information about the responding student:
28. What is your level of education? (Bachelor or Master) 29. Which faculty are you studying at?
30. Your placement (1st, 2nd, 3rd, laude, no place achieved: each of them filled out different questionnaires)
Figure 3
The questions of the questionnaire
We have been collecting student feedback for years, after the end of each conference. The feasibility of this project has become more and more composite and complex over the years. In this study, we assess the results for the years 2014–
2015, which are shown in Table 1.
Table 1
The data related to the satisfaction questionnaires in 2014 and 2015
2014 2015
Position Participants
No. of students who filled
it out
Ratio Participants No. of students
who filled it
out
Ratio
Winner 26 12 46% 20 10 50%
Runner-up 22 9 41% 22 14 64%
3rd place 20 10 50% 17 8 47%
Laude 19 9 47% 11 7 64%
No place
achieved 40 15 38% 40 9 23%
Total 127 55 43% 110 48 44%
Using the data from the table, the totaled response rates of 43% (2014) and 44%
(2015) show that the responses we collected enable us to make some deductions for quality improvement.
Figure 4
The results for questions Q1–Q18 in the two years that were assessed Table 2
Aggregated results (2014 and 2015)
Q1 Q2 Q3 Q4 Q5 Q6 Q7 Q8 Q9
Mean 3.73 3.71 3.77 3.81 3.58 3.92 3.83 3.50 3.60 Std.
Deviation 0.449 0.651 0.425 0.377 0.647 0.279 0.445 0.652 0.536
Q10 Q11 Q12 Q13 Q14 Q15 Q16 Q17 Q18 Mean 3.56 3.60 3.60 3.40 3.38 3.73 3.73 3.77 3.63 Std.
Deviation 0.848 0.707 0.707 0.869 0.866 0.449 0.536 0.472 0.733 The histograms in Figure 4 and the statistical properties of Table 2 clearly show that the participants were basically satisfied with the process and the organization of the conference in both the years being examined. However, it can also be noted that areas of improvement can be identified with the help of this questionnaire and the ranking numbers related to it. Based on the numerical means for the results that were obtained from the ranking scales from the cumulative data for the two
years, Q6 (mean: 3.92) and Q7 (mean: 3.83) are exceptional fields, marking the distinctive role of the SSA Committee’s secretary. Q4 is a field with a similarly high mean (3.81), signaling good results in communication and the provision of information. Q13 (mean: 3.40) and Q14 (mean: 3.38) clearly have some room for improvement, as their results demonstrate that the different commissions for each professional section make their decisions in a slightly different way, using evaluation and assessment criteria systems that are not very transparent for students. Examining the mean values mentioned above is also necessary because the deviations related to them are much smaller.
Above and beyond the descriptive statistical presentation, the questions regarding quality improvement can also be analyzed. As the histograms from the figures already show, there are some differences in the results for questions Q1–Q18 between 2014 and 2015. The homogeneity test can help describe these with mathematical-statistical tools. It is known that the Mann–Whitney test can be used as such a homogeneity test for the case of ranked numbers [21]. This test works with the hypothesis that two samples come from an identical population. If this can be proved, then there is no significant deviation for the results of the two years; otherwise, the results of the quality improvement can be clearly confirmed.
When making an individual analysis for each of the two years for the questionnaire questions related to conference organization, the Mann–Whitney test shows a significant improvement in the areas indicated in Table 3. This improvement is confirmed by the fact that the p values show an exceptionally low significance level, making the initial hypothesis unacceptable as there is a significant difference between the two populations.
Table 3
Questions showing differences for the two years (2014 and 2015)
Question Q2 Q3 Q4 Q8 Q17
Mann- Whitney
U = 1023.5 p = 0.018
U = 1011.5 p = 0.014
U = 1000.0 p = 0.007
U = 952.0 p = 0.008
U = 1058.0 p = 0.032 The significant differences are not accidental. From the experience recorded in 2014, the SSA Committee of the faculty, its president and its secretary carried out important and conscious changes in the management of the application process, and also in the field of informative and reminder-related communication. The website of the conference was renewed to a significant extent for the whole university: important changes were made to it in regards to both its content and its structure. These results are essentially due to the successful identification of process elements that particularly contributed to an increase in student satisfaction.
As we have already indicated, the NPS method can be particularly helpful in
satisfaction for several service-based processes. We therefore categorized the replies we received, using the NPS methodology, thus, based on the replies, differentiating between a category of detractors (those who would not recommend the conference) who gave values between 0 and 6, a passive category for those who gave values of 7 or 8 and a category of promoters (those who would recommend the conference) for those who gave 9 or 10. Calculating the final result is also simple: the percentage of detractors is subtracted from the percentage of promoters, which leads to the NPS index. [19] The NPS values, calculated from the results for the answers given to the question ‘On the whole, to what extent would you recommend the FESS SSA Conference to your fellow students?’
(Q19), confirm the positive reputation of the conference:
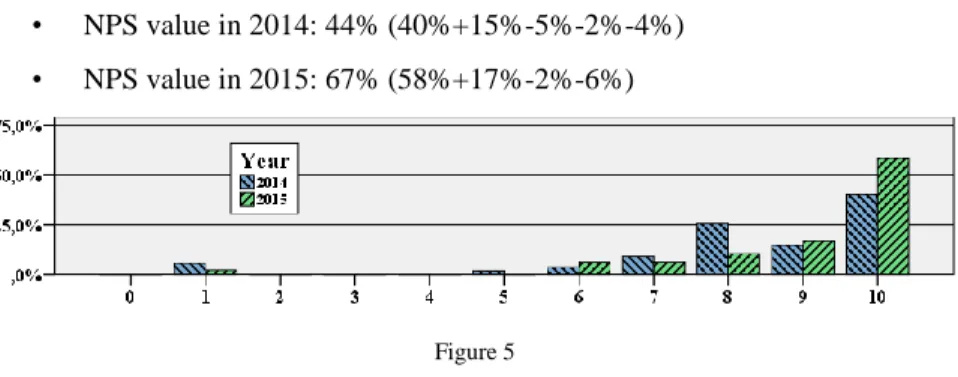
• NPS value in 2014: 44% (40%+15%-5%-2%-4%)
• NPS value in 2015: 67% (58%+17%-2%-6%)
Figure 5 Results for question Q19
Based on the values from the two years, there is a clear improvement in the reputation of the conference. Along with the NPS methodology, the Mann–
Whitney non-parametric test can also be used to assess the improvement related to question Q19. This test, comparing the ordinal values for the two years, again points out that the results cannot originate from the same population (U = 1044, p = 0.051).
The relations between certain questions can be analyzed using several different combinations, the results of which may then further perfect or slightly alter previous findings. In our case, it may make the most sense to examine whether there is any relationship between the position achieved and the cumulative evaluation of the conference (NPS). We carried out the analysis based on the cumulative data for 2014 and 2015. By using a cross-tabulation analysis, we examined both the position (Q30) and the cumulative evaluation (Q19) as ordinal variables. As the cross-tabulation based on the variables is asymmetric (5 categories for position, 11 categories for evaluation), the results for Kendall’s tau-c measure, which is 0.235 in our case, are determinative. This indicates a weak relation with a reverse ratio, meaning that those who achieved a better position (those with a lower number) gave a better evaluation of the conference (a higher value).
Figure 6
The relation between the cumulative evaluations (Q19) and the placement (Q30)
From the assessment of the achieved positions and certain questions it is worth highlighting the two with the worst results (Q13, Q14), which relate to the evaluation of the commission and the final result within the section. We carried out the analysis based on the cumulative data for 2014 and 2015, in a similar way to the process presented above: an asymmetric cross-tabulation was obtained from the variables (5 categories for position, 4 categories for evaluation), and the results of Kendall’s tau-c measure, which are -0.260 for Q13 and -0.370 for Q14, are determinative. This indicates a moderate relation with a reverse ratio, so that those who achieved a better position (those with a lower number) gave a better evaluation for the relevant questions (they gave a higher value). This observation further supports our previous arguments: the work of commissions has to be made more transparent and clear for the students.
With the help of students’ answers given to the open questions (Q20-Q22), we get an overview about the areas and features of the conference that can be identified as strengths or in need of improvement. This feedback is also important because solutions to the problems may also be recommended by the respondents. When analyzing the outcomes for previous periods, we can show that the results to the closed questions in the satisfaction assessment are supported by the answers to the open questions.
SSA conference is the significant way of nurturing talent in higher education and when considering its long-term possibilities for success, it is essential to assess how the students make contact with their professors and supervisors. It is for this reason, that we composed questions Q23, Q24 and Q25 in the questionnaire. The diagrams in Figure 8 show the cumulative results for two years. These diagrams clearly show further potential for improvement. The results for question Q23 (the diagram on the left) imply that almost 50% of the students only decided to participate in the conference (4 response options) a few weeks before the event.
This demonstrates that student–professor links are missing for these students, when such links could guide the students much earlier and in a more conscious way in order to achieve better results. Question Q24 (the diagram in the middle) also shows similar results, as a significant number of the students indeed made
contact with their supervisors on their own, and it was not the professors who guided their students (the first response option). The results from question Q25 (the diagram on the right) clearly draw our attention to the fact that the talent nurturing process goes beyond the activities related to the SSA conference, as a clear majority of students decided to participate in the conference on the basis of their earlier study experience and their ties to professors (first response option).
Figure 8
Results for questions Q23, Q24 and Q25
As we have already shown in previous examples, the correlation between the individual answers can also be assessed for this group of questions. We used the cumulative data from two years to analyze the relationship between questions Q23 and Q25, and we assessed both of them as nominal variables, with the help of cross-tabulation. The significance level of the Pearson Chi-Square is 0.028, and we therefore reject our hypothesis about the independence of the two variables, meaning that there is in fact a relation between the two variables. The Cramer V associative measurement index shows the strength of the correlation between two nominal variables, and this is a number lying between 0 and 1. In our case, it is 0.380, indicating a weak-moderate correlation. When analyzing the cells of the cross-tabulation we find that the applicants who applied in the registration period usually did so, on the basis, of an earlier topic and having a supervisor they had previously known.
Figure 9 Results for question Q26
The results for question Q26, in the same way as before, also draw our attention to the fact that talent nurturing has great importance in all phases of the education
process. Figure 9 shows that the number of work hours spent on writing the paper is not significant for the majority of the students. It is our belief, and it also matches our previous findings, that this is not the real result, because a lot of students link their SSA conference preparations with their earlier and current tasks related to their project-based education. At our faculty, students spend a significant number of work hours carrying out different project tasks for external institutions, besides their SSA activities. These tasks also serve as a basis for theses or diploma plans later on. They are required to compose written reports and presentations about the tasks, and these can be effectively used when preparing the SSA conference paper. Tasks related to quality improvement for the future are also present in this area, as professors and supervisors of such project tasks need to realize this fact and be encouraged to combine project-based teaching and the SSA activities during their students’ studies.
An interesting correlation is shown when analyzing the relationship between question Q26 and the position achieved. To assess this, we treat the self-admitted work hours as a (numerical) variable that can be measured on a ratio scale, while the position is regarded as an ordinal variable. Thus, we can analyze the relationship between the variables using one-way variance analysis (One-way ANOVA). Before doing this, it is worth checking whether the groups assigned by the ordinal variable have the same dispersion within the group. In our case, we proved this successfully, using the Levene test: F=0.237, p=0.883. According to the F-test of ANOVA, the null hypothesis, claiming that the group means assigned by the ordinal variable are equal, needs to be accepted (p=0.883), so the position achieved is independent of the admitted work hours. As for the results of our previous analyses, we believe this to be the reason for the latent talent nurturing already mentioned.
Figure 10
The correlation between the number of work hours (Q26) and position
Using our questionnaire, we can assess the situation relating to the evaluation of the SSA sections, which has been a problem ever since the introduction of multi- cycle education: if Bachelor and Master students who are competing against each other are evaluated in the same way, is it the Master students with more professional knowledge who win prizes more often? To assess this question, we again took the results from 2014 and 2015, as the basis. We analyzed the ordinal variables for position (Q30 – 5 categories) and level of education (Q28 – 2
cross-tabulation method. The value of Kendall’s tau-c measure is -0.305. This indicates a moderate relation with a reverse ratio, so those who achieved a better position (a category with a lower number) are more likely to be Master students (a category with a higher number). This result means a new task for quality improvement. Although it is a constantly emphasized expectation of the SSA Committee that each commission evaluates everyone equally, in accordance with the quality of their education, Figure 11 still shows that this is not so in reality.
Therefore, if it remains impossible to organize separate sections for Bachelor and Master Students, we will have to keep up our strong efforts regarding the evaluations.
Figure 11
The correlation between the level of education (Q28) and position
Question Q27 analyses students’ motivational viewpoints. Nine reply options (Q27a-Q27i) were identified, using student feedback from previous years. Figure 12 shows the cumulative results for the two years. Concerning the objectives of nurturing talent, the results are comforting, as the students are primarily motivated by enjoying the experience of conducting research (Q27c, mean: 3.39), getting to know an interesting problem/field of science (Q27b, mean: 3.37) and achieving professional success and recognition (Q27g, mean: 3.37), and they are not particularly motivated by the financial reward of the prizes (Q27i, mean: 1.87) or earning bonus points for a scholarship (professional, international, university or faculty) (Q27h, mean: 2.32). These results are similar to findings of Bérces’
former studies [20].
Figure 12
Students' motivational reasons (Q27) Conclusions
Identifying processes and setting up a measurement system based on these processes makes it possible to carry out quality improvement using a process
management approach. This argument is supported in our case study, in which we analyzed the organizational process for the Students’ Scientific Association Conference at the Faculty of Economic and Social Sciences of the Budapest University of Technology and Economics. Since student satisfaction was the focus of quality assessment, we identified the process based on this and we used the simplified rules of BPMN modeling and the ARIS Express software to prepare a flowchart. This step was followed by identifying measurement indexes and process indicators. Based on data from previous years, we provided numerous examples of how indicators, that were either available in the administrative systems or were retrieved from the results of the questionnaire, could be analyzed.
The SPSS program was used for mathematical/statistical analyses.
Finally, we found that a process management approach and methodology can be an excellent choice, when it comes to quality improvement in higher education processes. Process identification, choosing indicators, completing related measurements and designating quality improvement actions, can all be applied in the case, of any fundamentally important, higher education process.
References
[1] Finna H., Erdei J. (2015): “Qualification as a Success Factor in the Labor- Market: The Faculty-Specific Attributes of the Employment of the Budapest University of Technology and Economics Recent Graduates”, Acta Polytechnica Hungarica, Vol. 12, No. 8, pp. 135-154
[2] Tóth Zs. E., Jónás T. (2014): “Enhancing Student Satisfaction Based on Course Evaluations at the Budapest University of Technology and Economics”, Acta Polytechnica Hungarica, Vol. 11, No. 6, pp. 95-112 [3] Helgesen, O., Nesset, E. (2007): “What Accounts for Students’ Loyalty?
Some Field Study Evidence”, International Journal of Educational Management, Vol. 21, No. 2, pp. 126-143
[4] Veress, G. (1999): “A felsőoktatási intézmények minőségmenedzsmentje”, (Quality Management in Higher Education Institutions) Budapest: Műszaki Könyvkiadó
[5] Munteanu, C., Ceobanu, C., Bobalca, C., Anton, O. (2010): “An Analysis of Customer Satisfaction in a Higher Education Context”, International Journal of Public Sector Management, Vol. 23, No. 2, pp. 124-140
[6] Yusoff, M., McLeay, F., Woodruffe-Burton, H., (2015): “Dimensions Driving Business Student Satisfaction in Higher Education”, Quality Assurance in Education, Vol. 23, Iss. 1, pp. 86-104
[7] Crombag, H. (1978): “On Defining Quality of Education”, Higher Education, Vol. 7, No. 4, pp. 389-403
[8] Hammer, M. (2007): “The Process Audit”, Harvard Business Review, Iss.
85, pp. 111-123
[9] Rosemann, M. & vom Brocke, J., (2010): “The Six Core Elements of Business Process Management”, In: Brocke, J., Rosemann, M. (Eds):
Handbook on Business Process Management 1. Heidelberg: Springer- Verlag, pp. 107-122
[10] Hammer, M., (2010): “What is Business Process Management?”, In:
Brocke, J., Rosemann, M. (Eds): Handbook on Business Process Management 1. Heidelberg: Springer, pp. 3-16
[11] Hung, R. Y. (2006): “Business Process Management as Competitive Advantage: A Review and Empirical Study”, Total Quality Management, Vol. 17, pp. 21-40
[12] Csizmadia, T. (2006): “Quality Management in Hungarian Higher Education”, Czech Republic: UNITISK
[13] Bedzsula, B., Dénes, R., Topár, J. (2015): “Mérőszámok szerepe a társadalmi szolgáltatások minőségfejlesztésében”, In: Veresné Somosi Mariann, Lipták Katalin (Eds): “Balance and Challenges” IX. International Scientific Conference 2015, Miskolci Egyetem Gazdaságtudományi Kar, Miskolc, pp. 140-154
[14] Bedzsula, B., Topár, J. (2014): “Minőségmenedzsment szemlélet és eszközök szerepe a felsőoktatás fejlesztésében”, Magyar Minőség, Vol.
XXIII, No. 3, pp. 34-47
[15] Finna, H. (2012): “Enhancing Employment and Motivation Opportunities of Recent Graduates with the Help of Atypical Solutions”, In: Topár J.
(Ed): Relevant Issues in Engineering Management, Technical Publishing House Ltd., Budapest, pp. 243-259
[16] Bíró-Szigeti, Sz. (2014): Strategy Support of Residential Energy Saving Investments in Hungary with the Method of Technology Roadmapping.
Acta Polytechnica Hungarica, Vol. 11, No. 5, pp. 167-186
[17] Berry, L., Parasuraman, A., Zeithaml, V. A. (1985): “A Conceptual Model of Service Quality and Its Implications for Future Research”, Journal of Marketing, Vol. 49, No. 4, pp. 41-50
[18] Berry, L., Parasuraman, A., Zeithaml, V. A. (1988): “SERVQUAL: A Multiple-Item Scale for Measuring Consumer Perceptions of Service Quality”, Journal of Retailing, Spring, Vol. 64, Iss. 1, pp. 12-40
[19] Reichheld, F. (2003): “The One Number you Need to Grow”, Harvard Business Review, Vol. 81, No. 12, pp. 46-54
[20] Bérces, R. (2015): “The Improvement of Higher Education Quality and Talent-Nurturing with Scientific Students’ Association (SSA) Commitment”, Acta Polytechnica Hungarica, Vol. 12, No. 5, pp. 101-120
[21] McCrum-Gardner, E. (2008): “Which is the Correct Statistical Test to Use?”, British Journal of Oral and Maxillofacial Surgery, Vol. 46, pp. 38- 41