service quality expectations in higher education
Article in Quality Assurance in Education · October 2021
DOI: 10.1108/QAE-11-2020-0137
CITATIONS
0
READS
12 3 authors, including:
Some of the authors of this publication are also working on these related projects:
EDUQUALView project
Economic value of international students' volunteer activitiesView project Vangelis Tsiligiris
Nottingham Trent University 38PUBLICATIONS 93CITATIONS
SEE PROFILE
Anita Kéri University of Szeged 28PUBLICATIONS 15CITATIONS
SEE PROFILE
All content following this page was uploaded by Vangelis Tsiligiris on 18 October 2021.
The user has requested enhancement of the downloaded file.
1
Exploring the relationship between student individual culture dimensions and service quality expectations in higher education
Vangelis Tsiligiris
a*, Anita Kéri
band Jeremy Cheah
ca Department of Accounting and Finance, Nottingham Trent University, Nottingham, UK;
b Department of Business Studies, University of Szeged, Szeged, Hungary; cDepartment of Accounting and Finance, Nottingham Trent University, Nottingham, UK.
Correspondence details: Vangelis Tsiligiris, Nottingham Trent University, email:
vangelis.tsiligiris@ntu.ac.uk
Notes on contributors
Vangelis Tsiligiris* is Associate Professor at Nottingham Trent University. His research activity is concentrated around two areas: a) Transnational education and international higher education business strategy; and b) teaching and learning in business education with a focus on the impact of digital technologies.
Anita Kéri is an Assistant Lecturer at the Faculty of Economics and Business Administration, Department of Business Studies of the University of Szeged. Her main research interests concentrate on internationalization of higher education, international students’ expectations, satisfaction and loyalty. She is also interested in the topics of volunteering and innovative educational methods.
Jeremy Cheah is Associate Professor of Cryptofinance and Digital Investment at Nottingham Trent University. His main research interests include decentralised finance, cryptocurrency, digital finance and investment. He also has interests in corporate social responsibility and education in cyberspace. His publications include British Journal of Management, Human Resources Management and Journal of Business Ethics amongst others.
2
Exploring the relationship between student individual culture and service quality expectations in higher education.
Abstract
This study explores the influence of the individual student profile of Hofstede’s Power Distance, Uncertainty Avoidance, Collectiveness and Long-Term
Orientation on student service quality expectations in higher education. The service quality items used emerge from previous research and complemented with one new item about innovative online support. Data is collected via a survey consisting of items from a standard Hofstede and a higher education adapted SERVQUAL questionnaire. The survey sample includes 128 students who represent the entire population of a taught postgraduate course in Finance at a UK Higher Education Institution. Descriptive statistics and bivariate correlation analysis are used to describe and identify the relationship between student individual cultural values and student service quality expectations. Multiple regression analysis is applied to estimate the relationship between SERVQUAL constructs and items with respect to Hofstede cultural determinants. The findings of this study suggest that individual culture can influence student service quality expectations in higher education. In a context of a prospective quality management approach, there is value for higher education institutions to explore the individual cultural profile of their students as a way of understanding and actively managing student service quality expectations.
Keywords: quality, student expectations, service quality, higher education, Hofstede, SERVQUAL
3 Introduction
Service quality, and particularly student satisfaction, has emerged as a key priority for higher education institutions (HEIs) as a result of the intensification of the
marketisation of higher education (Abdullah, 2006a; Molesworth et al., 2010). High service quality, primarily measured through institutional and national student satisfaction surveys, is considered a way for HEIs to gain and maintain their competitive advantage in the race for recruiting home and international students (Marimon et al., 2019).
The conceptualisation and measurement of service quality in a higher education context is diverse (Tsiligiris and Hill, 2019). Service quality is broadly defined as the outcome of the coordinated effort by organisations to meet or even exceed the
expectations of their customers (Gronroos, 1990). In this context, service quality is closely associated with customer satisfaction which is a function of the gap between their pre-service expectations and post-service perceptions (Zeithaml et al., 1993). Thus, HEIs, as service providers, need to identify and explore student expectations as a matter of critical importance in their effort to provide high quality services (Zwikael and Globerson, 2007).
Research in a number of service quality industries has shown that the cultural background of customers influences their service quality expectations (Crotts and
Erdmann, 2000; Donthu and Yoo, 1998; Ladhari et al., 2011; Qin et al., 2010; Tsoukatos and Rand, 2007). Nationality and country of origin are not the only factors that cause variability in the cultural values amongst individuals. For this reason, national culture is used only to facilitate broad comparisons in the cultural characteristics between countries (Hofstede, 2011). Instead, individual culture which is shaped by the experiences and personal beliefs of each individual is what defines the cultural values of a person (Kueh and Voon, 2007).
Numerous existing studies suggest that the cultural background of students may influence their teaching and learning expectations (Niehoff et al., 2001; Yamauchi, 1998). Beyond the consumer behaviour aspect, individual cultural values influence the way an individual forms broader considerations, like epistemological beliefs (Alexander et al. 1998). In the international higher education (IHE) context, where there is a diverse student population, individual cultural values are likely to play a significant role in the formation of student expectations about teaching and learning, and other elements of HE service quality. So far, the research conducted in this area has explored the impact of national culture on student expectations. For example, Kragh and Bislev (2009) used the Hofstede’s model and found that higher education is culture-bound and closely related to national socio-cultural conditions.
In this study, our aim is to explore the extent to which the individual cultural profile of students affects their service quality expectations in higher education. To achieve this aim, we combine a higher education adapted SERVQUAL (HE-
SERVQUAL) and a standard Hofstede questionnaire to collect data from postgraduate students who study in the UK. The outcomes of this investigation will be particularly valuable in an international higher education context, where there is an increasing need to understand how students form their pre-service expectations about quality in HE (James and Beckett, 2006).
4 Services quality measurement methods in higher education
According to Browne et al. (1998), service excellence in higher education is created if expectations are exceeded. One of the most commonly used methods to measure service quality in higher education is SERVQUAL (Papanthymou and Darra, 2017; Parasuraman et al., 1985, 1991). In SERVQUAL, service quality is measured as a function of five different dimensions – 1) Reliability; 2) Assurance; 3) Tangibles; 4) Empathy; and 5) Responsiveness. The level of service quality is measured through the gap between pre-service customer expectations and post-service customer perceptions.
Where service expectations exceed service perceptions, service quality is considered to be below standards and vice versa. However, Cronin and Taylor (1992; 1994) have questioned the necessity of measuring both expectations and post-service perceptions.
Instead, they have proposed SERVPREF as an alternative method where service quality is measured as a function of post-service customer perceptions.
Other concerns have emerged about the SERVQUAL measurement tool,
including its dimensions and their link to service quality. Woodside et al. (1989) argues that quality is the predecessor of satisfaction, while according to Bitner (1990),
satisfaction leads to quality. Moreover, Morrison (2004) found conceptual, methodological and interpretative issues with the measurement tool.
Several new service quality measurement tools surfaced in close connection with the SERVQUAL method. Jager and Gbadamosi (2013) highlighted the need for a
country-specific questionnaire in which they take into account the importance of students’ experience about the HEI; social life; and location. Butt and Rehman (2010), and Ravindran and Kalpana (2012), using customised scales, measured teachers’
knowledge; course design; learning environment; study equipment; location of delivery;
and HEI image. Doña-Toledo and colleagues (2017) proposed a custom measurement scale which measures student perceptions about the quality, value, image and overall satisfaction of the HEI they attended. Others have used the SERVPERF method as the basis for developing a service quality measurement tool for higher education. For example, Negricea and colleagues (2014) used an adaptation of SERVPREF model to measure the impact of certain variables on student satisfaction in a Romanian HE context.
Others have expanded on the SERVQUAL and SERVPREF models to develop scales and models that consider a wider array of factors. For example, Abdullah
(Abdullah, 2006b, 2006c, 2006a) created the HedPERF scale, which expands to consider the student satisfaction about the wider higher education service environment. HedPERF was successfully used by other researchers (Silva, 2017; Khalid, 2019) and developed further by Randheer (2015) who created the CUL-HEdPERF student satisfaction scale contextualised to consider Arabic cultural elements.
HEQUAM is another SERVQUAL adaptation for higher education developed by Noaman and colleagues (2013). HEQUAM personalises 8 higher education quality criteria according to the higher educational environment. These criteria included the curriculum, colleagues, career opportunities, educational infrastructure, online available services, library, administrative services and location. Similarly, Teeroovengadum and colleagues (2016) developed the HESQUAL which is aimed at measuring higher education quality in Mauritius. The novelty in the model is that it emphasizes both the service process and outcomes. They measure satisfaction based on five dimensions, which are administrative quality, physical environment, basic teaching quality, quality of supplementing facilities and transformative quality. The model was later adapted by other researchers (Munshi 2019; Sokoli et al. 2019)
5 Culture
Culture is defined in several ways. All definitions call for a set of formed belief and habits which are inherent in people’s minds. For example, according to Hofstede (2011, p. 3) culture is “…the collective programming of the mind that distinguishes the members of a group or category of people from others”. Also, for Gupta (2003, p. 69) culture is defined “…as a way of life cultivated beliefs, learned behaviours, shared mental programmes, compelling ideologies, and inter-related symbols whose meanings provide a set of orientations for members of a society, and are transmitted by them”.
In the existing literature, there is a distinction between national and individual culture elements. It assumes that “each nation has a distinctive, influential, and describable culture” (McSweeney, 2002, p. 89). National culture is believed to be an aggregate of individual responses (Hofstede, 1985), while individual culture is measured on the level of each and every individual, as it is thought to “begin with the transmission of behavioural content, learned by one organism during its lifetime” (Glenn 2004:139).
Hall and Hall (1990) determined national culture based on characteristics in communication, while Trompenaars (1996) investigated different cultures’ problem- solving capacities. Schwartz (1999) highlighted values’ influence on behaviour, and House et al. (2001) concentrated mainly on management and leadership. Inglehart’s World Values Survey differentiates between two dimensions, survival values v. well- being values and traditional authority v. adherence to common goals, that describe a nation (Terlutter et al. 2006).
Similar to the measurement of service quality, there is a variety of models
developed and used for the identification and measurement of cultural values (Tsoukatos, 2011). However, the most frequently used model to measure individual culture is
Hofstede’s (1985, 2011), upon which many other measurement methods are built (House et al., 2004). Hofstede measures culture as a function of six dimensions: 1) Power
Distance (PD); 2) Uncertainty Avoidance (UA); 3) Collectivism (Coll); 4) Masculinity (Masc); 5) Long-Term Orientation (LTO); and 6) Indulgence (Ind).
The PD is related to how a specific society handles the differences and
inequalities between its members, while UA refers to the extent to which people in the society feel uncomfortable with either ambiguity or uncertainty. While Coll is related to the interest of individuals versus groups, Masc refers to what values a nation considers more important. LTO deals with the issue of how people handle societal change, and Ind, a relatively new dimension, is related to the extent people can control their impulses and desires (Hofstede, 1985, 2011).
The popularity of the model emerges from its clear structure and the wide range of available data used by many as benchmark of culture between different countries.
However, despite the popularity of the Hofstede model, several researchers have expressed a range of criticisms about its applicability and relevance (Beugelsdijk and Welzel, 2018; Eringa et al., 2015; McSweeney, 2002; Obeidat et al., 2012; Zainuddin, 2018). McSweeney (2002) questions the model’s applicability as it might not reflect present cultural dimensions. Moreover, McSweeny (2002) expresses concerns that most of the respondents in Hofstede’s study were male. Others (Beugelsdijk and Welzel, 2018;
Obeidat et al., 2012; Zainuddin, 2018) question the validity of the model on the grounds that Hofstede’s study was based on data gathered from only one multinational
organisation. Brewer and Venalik (2012) also question the application of Hofstede’s method on individuals. The scale appears to measure national culture dimensions,
developed by factor analysis and measured aggregate individual responses. The measured items were highly significant on a national level but showed insignificant results at an
6 individual level. Eringa and colleagues (2015) validated Hofstede’s model on a new sample and found that the differences between the original scores of the countries have decreased. However, Hofstede’s model remains a well-established tool for measuring culture, as it is still the most authorised measurement method that is used widely in the literature (Breuer et al., 2018; Zainuddin, 2018).
The connection between service quality and culture
Previous studies across a range of service quality industries (e.g. banking, insurance, restaurants, and public transport) have shown that there is a significant link between cultural dimensions and service quality expectations (Donthu and Yoo, 1998;
Furrer et al., 2000; Kueh and Voon, 2007; Mattila, 1999; Tsoukatos and Rand, 2007). For example, Donthu and Yoo (1998) and Kueh and Voon (2007), utilising the Hofstede and SERVQUAL models, identified that customers with low PD dimension have high overall service quality expectations while customers with high UA and high LTO dimensions have high overall service quality expectations.
No previous study combines SERVQUAL and Hofstede in a higher education context. However, those studies utilising Hofstede’s model in higher education found that culture affects different aspects of students’ experience in higher education. For example, Wang (2018) found that culture plays an important role in the adjustment of Chinese students to the UK higher education system. The same was found by Kingston and Forland (2008) in the case of Asian students’ adjustment in the UK. Gruber, Chowdhury and Reppel (2011) revealed that national culture influences the expectations of
international students. Also, Kragh and Bislev (2005) using Hofstede’s framework found empirical evidence to support that higher education is culture-bound and closely related to national socio-cultural conditions. Similarly, Niehoff et al., (2001) suggest that the cultural beliefs of students may influence their teaching and learning expectations. The study by Arambewela and Hall (2011) identified a connection between the country of origin of international students and their service quality expectations in the context of SERVQUAL dimensions.
Development of hypotheses
From the review of the existing literature, there is emerging evidence to suggest an underlying link between culture and higher education service quality expectations.
This alleged relationship requires further investigation. Our research concentrates on exploring the impact of four Hofstede cultural dimensions –PD, UA, Coll and LTO dimensions - on the service expectations of students. As previous literature suggested, the masculinity dimension is not strongly or significantly related to service quality
expectations (Donthu and Yoo, 1998; Kueh and Voon, 2007). Moreover, there is confusion about these labels, as it is not clear what they intend to mean (Ghemawat and Reiche 2011) and gender biases appear (Moulettes 2007). Therefore, masculinity was excluded from data analysis of this study. Reflecting on the evidence from previous research (Donthu and Yoo, 1998; Kueh and Voon, 2007), the following hypotheses will be tested in this study:
• H1. There is a negative relationship between PD dimension and student service quality expectations in higher education
• H2. There is a positive relationship between UA dimension and student service quality expectations in higher education
7
• H3. There is a positive relationship between LTO dimension and student service quality expectations in higher education
• H4. Coll dimension will not have any significant relationship with student service quality expectations in higher education
Method
To explore the relationship and potential impact of individual culture on student service quality expectations, we utilise an adapted SERVQUAL and a standard
Hofstede’s questionnaire. These are widely used and reliable instruments for measuring service quality and cultural values, respectively. For example, an extensive study conducted by Yuan and Gao (2019) identified that SERVQUAL, despite its potential limitations, remains a robust measure of service quality in higher education. However, there are documented concerns with the robustness of the SERVQUAL dimensionality.
For example, the problem of consistency of items loading to the same dimension and variability of SERVQUAL dimensions across different countries, industries, market segments and time periods (Carman, 1990; Woo and Lam, 1997; Miller at al., 2011).
Hence, a narrow investigation of cultural dimensions against the five SERVQUAL dimensions may result in a lack of robustness of the findings. Thus, our exploratory analysis and discussion considers the relationship between Hofstede’s cultural
dimensions and the items of service quality alongside the dimensions of SERVQUAL.
We compiled the service quality items questionnaire in table 1, consisting of 23 items that appear in previous studies utilising the SERVQUAL model in higher education (Aghamolaei and Zare, 2008; Arambewela and Hall, 2006; Chatterjee et al., 2009; Doña- Toledo et al., 2017; Joseph et al., 2005; de Oliveira and Ferreira, 2009; Sherry et al., 2004; Tan and Kek, 2004). Also, considering the digital transformation in the
contemporary HE environment, and the central role of online elements into the core models of HE provision, we have introduced a new item (T4) about “innovative online support (e.g.: learning portal, online resources, video lectures)” under Tangibility.
Table 1. HE SERVQUAL items
Tangibility
I expect an excellent Higher Education Institution to have...
T1 Modern university buildings (e.g.: teaching and administrative infrastructure, library)
(Aghamolaei and Zare, 2008; Chatterjee et al., 2009; Sherry et al., 2004; Tan and Kek, 2004) T2 Recreational and socializing facilities on campus (e.g.: university
sports centre, student union bars,) (Joseph et al., 2005) T3 Latest technology computer labs with adequate PCs for all
students
(Arambewela and Hall, 2006; Joseph et al., 2005)
T4 Innovative online study support (e.g.: learning portal, online
resources, video lectures) New
T5 An easily accessible campus through public transport and personal transport
(Arambewela and Hall, 2006; Joseph et al., 2005)
Reliability
I expect an excellent Higher Education Institution...
R1 to do something in a certain time when it was promised (Aghamolaei and Zare, 2008; de Oliveira and Ferreira, 2009)
R2 to look into student's problems with sincere interest and try to
provide a solution promptly (de Oliveira and Ferreira, 2009)
R3 to provide value for money education services as promised
without errors (Arambewela and Hall, 2006)
8
R4 to have high teaching standards and quality academics (Arambewela and Hall, 2006; Joseph et al., 2005)
R5 to deliver its services in manageable class sizes (Arambewela and Hall, 2006; Joseph et al., 2005)
Responsiveness
I expect an excellent Higher Education Institution...
RP1 to have fees which are comparable to other universities (Arambewela and Hall, 2006) RP2 to have academic and administrative staff who would be willing
to help students promptly with their questions (Aghamolaei and Zare, 2008) RP3
to have academic and administrative staff who would provide all students with the same and equal information, support, and guidance
(Arambewela and Hall, 2006; Joseph et al., 2005)
RP4 to have academics who provide feedback which will explain
how to correct mistakes (Arambewela and Hall, 2006)
Assurance
I expect an excellent Higher Education Institution...
A1 to be trustworthy and have the reputation for being a provider of
high-quality education, both nationally and internationally (Arambewela and Hall, 2006; Joseph et al., 2005) A2 to provide a safe environment for students' living and learning. (Joseph et al., 2005; Shank et al., 1996)
A3 to offer programs that are designed according to the needs of the
real economy/employment market (Arambewela et al., 2006)
A4 to prepare its graduates for the employment market by offering career advice and establishing links with prospective employers
(Aghamolaei & Zare, 2008; Arambewela & Hall, 2006)
A5 to be high in university league tables / rankings (Chatterjee et al., 2009) Empathy
I expect an excellent Higher Education Institution...
E1 to operate in convenient times for teaching and other support services for all students
(Aghamolaei and Zare, 2008; Chatterjee et al., 2009)
E2 to have administrative and academic staff who provide individual attention to each student.
Aghamolaei and Zare 2008; Chatterjee, Ghosh, and Bandyopadhyay 2009)
E3 to understand and respond to the specific personal issues and
circumstances of students. (Aghamolaei and Zare, 2008; Joseph et al., 2005) E4 to have academics/mentors who monitor and care about the
performance of their students. (Aghamolaei and Zare, 2008; Joseph et al., 2005)
For the Hofstede part of the study we are using a standard 22 items Hofstede questionnaire for the four culture dimensions used in this study (Hofstede, 2013).
Confirmatory Factor Analysis
To test the dimensionality of both SERVQUAL and Hofstede parts, we have conducted confirmatory factor analysis (CFA)1.
The CFA overall model fit measure for SERVQUAL dimensions, as indicated by the CFI of 0.807, is good but RMSEA of 0.0839 is slightly higher than the threshold of 0.08. The model chi-square is significant which is to be expected given the relatively large sample of 220 degree of freedom. All the unstandardized loading estimates are statistically significant at 1 percent level.
There are four indicators (Tag2, Resp1, Assr5, and Empth1) for which their standardised leadings fall outside of the conservative 0.5 threshold value. However, these indicators have been retained to support content validity. In addition, deleting indicators would result in fewer than four indicators for Resp and Empt factors respectively required for the identification of the factor. Our decision to retain the indicators and factors is also largely supported by modification indices of
1 Please see here:
CFA SERVQUAL https://1drv.ms/w/s!AhnnrdrZj5uWe9ythMmyzxkMJho?e=xzlqbd CFA Hofstede https://1drv.ms/w/s!AhnnrdrZj5uWeg8CZLmuCclLbD0?e=ST6gZ7
9 the factor loadings. Modification indices indicate that the model fit could be improved is these values are around 4 or greater by freeing the corresponding path to be estimated. The results suggest that by making such changes, it could improve the model fit but doing so should be guided by the theory. Consequently, we did not carry out these changes because there is no theoretical background to support the altering of the SERVQUAL dimensions.
The CFA overall model fit measure for cultural dimensions, as indicated by the CFI and RMSEA of 0.856 and 0.0647 respectively, is good. The model chi-square is significant which is to be expected given the relatively large sample of 389 degree of freedom observations. All the unstandardized loading estimates are statistically significant at 1 percent level. Two, one and three unstandardized estimates for UA, Coll and LTO respectively fall below the conservative 0.5 cut-off threshold. However, these indicators have been retained to support content validity. In addition, deleting two and three indicators for UA and LTO would leave fewer than four indicators for these factors respectively. Our decision to retain the indicators is also largely supported by modification indices of the factor loadings. The modification indices for post-hoc model performance of CFA for Hofstede dimensions indicate that the model fit could be improved is these values are around 4 or greater by freeing the corresponding path to be estimated. Considering that we have used the standard Hofstede questionnaire there is no theoretical support to modify the indicators.
We evaluate the potential of multicollinearity by carrying out the variance inflation factor (VIF) test2. We find very low correlations (VIF <1.5) between all the independent factors
representing the cultural dimensions as measured by VIF.
Reliability analysis
A 5-point Likert scale was used across all questionnaire items. For the service quality items, we asked participants to rate how important each item is (1= not at all important; 5=extremely important) in relation to their expectation about the service quality attributes of a “excellent higher education institution”3. For the PD, Coll, UA, and LTO cultural dimension items, we asked for the participants’ agreement (1=strongly disagree; 5= strongly agree) against the standard Hofstede questionnaire statements. We have also asked participants to rate the level of their overall happiness at the time they completed the survey (1=extremely unhappy; 5=extremely happy).
We tested both questionnaires for reliability using Cronbach’s Alpha. For the SERVQUAL items the reliability was 0.90 and for the Hofstede items was 0.68.
According to the literature (Gliem and Gliem, 2003), this is a good and acceptable level of reliability, respectively.
2 Please see here: https://1drv.ms/w/s!AhnnrdrZj5uWgQDzP3sAwFRYjYr6?e=DbVVeR
3 What constitutes an “excellent higher education institution” would be relative to individual perceptions and it a relative conceptualization which is shaped by the broader quality in higher education discourse (Tsiligiris and Hill, 2019). The broader discussion of the definition of excellence in higher education is outside of the scope of this study.
10 Table 2. Scale Reliability Statistics
Cronbach's α N of items
SERVQUAL overall scale .90 23
Hofstede scale .68 22
The sample includes 128 postgraduate students that represent the total population of students enrolled on a taught postgraduate course in Finance at a UK HEI. The sample consisted of 46.5% female and 53.5% male students. The slightly higher proportion of male respondents is reflective of the typical student population profile in PG finance and courses in UK HEIs.
Table 3. Gender profile of responders
N Valid %
Female 59 46.5
Male 68 53.5
Missing 1
Total 128 100
We have conducted the bivariate correlation analysis to measure the strength of relationship between each of the 23 service quality items and the Hofstede’s four cultural dimensions (PD, UA, Coll, LTO). The correlation findings below are discussed with respect to each of the cultural dimensions and service quality items that are statistically significant.
Furthermore, the multiple regression analysis is applied to estimate the relationship between HE-SERVQUAL constructs and items with respect to Hofstede cultural dimensions. The HE-SERVQUAL constructs are formed based on the average of the items within each construct. Specifically, items T1 to T5, R1 to R5, RP1 to RP4, A1 to A5, and E1 to E4, are included in Tangibility, Reliability, Responsiveness, Assurance, and Empathy constructs, respectively. We estimate the relationship between HE-
SERVQUAL constructs and items with cultural determinants after controlling for gender (Gender) and overall level of happiness (Happy).
Data analysis
The analysis of data includes 1) descriptive statistics; 2) correlational analysis;
and 3) multiple regression analysis.
Descriptive statistics
The descriptive statistics, summarised in table 4 below, indicate that the overall cultural profile of our sample is one of low PD (M=2.3, SD=.87), high UA (M=4.1, SD=.61), moderate Coll (M=3.5, SD=.67) and high LTO (M=4, SD=.589).
Table 4. Descriptive statistics: Hofstede cultural dimensions
Variables N Mean SD
Power Distance (PD) 128 2.3 .874
Uncertainty Avoidance (UA) 128 4.1 .613
Collectiveness (Coll) 128 3.5 .669
Long Term Orientation (LTO) 128 4.0 .589
11 There is an overall high level of service quality expectations in the student
population in four out of five SERVQUAL dimensions as the Mean is above 4.
Specifically, Reliability (M=4.26, SD=.57) and Responsiveness (M=4.26, SD=.55) followed by Assurance (M=4.21, SD=.58) and Tangibility (M=4.19, SD=.52) are the four SERVQUAL dimension with Mean above 4.
Table 5. Descriptive statistics service quality expectation (SERVQUAL dimensions) Variables Mean SD
Tangibility 4.19 0.52 Reliability 4.26 0.57 Responsiveness 4.25 0.55 Assurance 4.21 0.58
Empathy 3.91 0.69
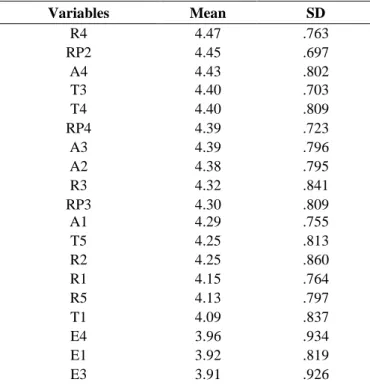
The respondents rank 17 out of 23 service quality items as very important (M>4) attributes for an excellent HEI. The three items with the highest ranking are 1) high teaching standards and the quality of academic staff (M=4.47, SD=.763); 2) the willingness of administrative and academic staff to help students with their questions (M=4.45, SD=.697); and 3) the ability of HEIs to prepare their graduates for the employment market by offering career advice and establish links with prospective employers (M=4.43, SD=.802).
The position of the HEI in the rankings is considered by the respondents as the least important attribute of an excellent quality HEI (M=3.56, SD=1.013). However, the high standard deviation (>1) indicates a broad range of views held by individual student away of the Mean. Nevertheless, this remains an interesting finding considering the growing importance placed on rankings by HEIs and other stakeholder groups.
Table 6. Descriptive statistics service quality expectation items (ranked by Mean)
Variables Mean SD
R4 4.47 .763
RP2 4.45 .697
A4 4.43 .802
T3 4.40 .703
T4 4.40 .809
RP4 4.39 .723
A3 4.39 .796
A2 4.38 .795
R3 4.32 .841
RP3 4.30 .809
A1 4.29 .755
T5 4.25 .813
R2 4.25 .860
R1 4.15 .764
R5 4.13 .797
T1 4.09 .837
E4 3.96 .934
E1 3.92 .819
E3 3.91 .926
12
RP1 3.84 .912
E2 3.84 .920
T2 3.80 .917
A5 3.56 1.013
Correlational analysis
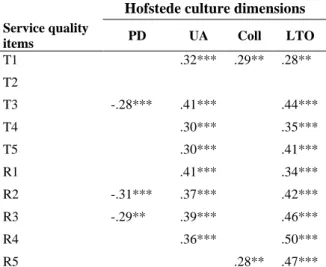
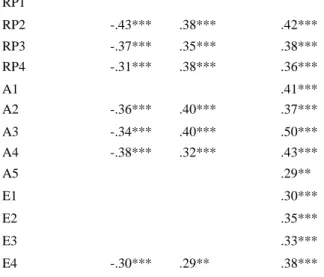
Students with high LTO appear to have higher expectations for 21 out of the 23 service quality items included in our study. In particular, a moderate (r=.28) to strong (r
=.50) positive correlation with the LTO student profiles. The strongest positive
correlation (r=.50, p<.001) is observed in the student expectation regarding the existence of “academic programmes designed to reflect the needs of the real economy/employment market”.
UA is the cultural dimension with the second highest number of statistically significant correlations with HE-SERVQUAL items (e.g. 15 out of 23 items). The UA dimension correlates positively with all of the items in Reliability construct and all, but one, items in Tangibility and Responsiveness constructs, respectively. The strongest positive correlation (r=.41; p<.001) is observed between UA and two service quality items: 1) Latest technology IT infrastructure; and 2) Consistency and efficiency in the delivery of service. Almost equally strong positive correlation (r=.40, p<.001) can be observed between the UA of the respondents and 1) Provision of a safe living and teaching environment; and 2) Academic programmes designed to reflect the needs of the real economy/employment market (r=.40, p<.001).
There is a moderate to high negative correlation between, the PD dimension of the respondents and 10 out of the 23 service quality items. These negative correlations are found in 3 out of 4 items and in 3 out of 5 items for the Responsiveness and Assurance constructs respectively. The highest negative correlation (r=-.43, p<.001) is between PD and the expectation about the existence of “academic and administrative staff who would be willing to help promptly students with their questions”.
The Coll dimension correlates positively with only 2 out of the 23 service quality items. Specifically, there is a moderate positive correlation between the Coll student profiles and the expectation for 1) “modern university buildings (r=.29, p<.01); and 2) delivery of education services in manageable class sizes (r=.28, p<.01).
Table 7. Correlation table: Service quality items vs Hofstede culture dimensions
Hofstede culture dimensions Service quality
items PD UA Coll LTO
T1 .32*** .29** .28**
T2
T3 -.28*** .41*** .44***
T4 .30*** .35***
T5 .30*** .41***
R1 .41*** .34***
R2 -.31*** .37*** .42***
R3 -.29** .39*** .46***
R4 .36*** .50***
R5 .28** .47***
13
RP1
RP2 -.43*** .38*** .42***
RP3 -.37*** .35*** .38***
RP4 -.31*** .38*** .36***
A1 .41***
A2 -.36*** .40*** .37***
A3 -.34*** .40*** .50***
A4 -.38*** .32*** .43***
A5 .29**
E1 .30***
E2 .35***
E3 .33***
E4 -.30*** .29** .38***
Notes
a * p < .05, ** p < .01, *** p < .001;
b we report correlations only of moderate and high size (>.025)
The correlation analysis at dimension level shows a high positive correlation between LTO and all service quality constructs. This is in line with the per-item correlation analysis where LTO was found to correlate with 21 out of the 23 quality items. The highest correlation of LTO is with Reliability (r=.610, p<.01) and Assurance (r=.565, p<.01) constructs. UA is the second cultural dimension which correlates positively with all service quality constructs. The highest correlation of UA is with Reliability (r=.497, p<.01) and Tangibility (r=.480, p<.01) constructs. At the dimension level, PD correlates negatively with all service quality constructs except Empathy. The Coll dimension correlates positively only with the Tangibility (r=.274, r<.01) construct.
Table 8. Correlation table: Service Quality dimensions vs Hofstede culture dimensions
Cultural dimensions Service Quality Dimensions PD UA Coll LTO Tangibility -.251** .480** .274** .516**
Reliability -.332** .497** .610**
Responsiveness -.391** .417** .479**
Assurance -.362** .418** .565**
Empathy .303** .442**
a * p < .05, ** p < .01, *** p < .001;
b we report correlations only of moderate and high size (>.025)
14 Regression analysis
A multiple regression analysis was used to explore the impact of student individual cultural profile as determinants of each of the service quality constructs and items. As summarised in table 9 below, across all service quality constructs, the multiple regression analysis generated statistically significant regression equations. LTO and UA dimensions appear to be the most influential cultural dimensions in shaping student expectations about service quality in higher education.
The student expectations about the Tangibility construct of service quality in higher education are predicted (F=10.830, p<.001, R2 =.362) by the UA (b=.223, p<.01), Coll (b=.138, p<.05) and LTO (b=.286, p<.05) individual student cultural values. For the Reliability construct of service quality, student expectations are influenced (F=15.174, p<.001, R2=.431) by UA (b=.191, p<.05) and LTO (b=.443, p<.001) student cultural values. Student expectations about the Responsiveness service quality elements in higher education are explained (F=10.718, p<.001, R2=.349) by PD (b=-.155, p<.01) and LTO (b=.285, p<.001) student cultural values. Similarly, the PD (b=-.134, p<.05) and LTO (b=.421, p<.001) predict to a great extent (F=12.975, p<.001, R2=.393) the student
expectations about the Assurance items of service quality. The student expectations about the Empathy elements of service quality in HE are partly influenced (F=5.771, p<.001, R2=.224) only by the LTO (b=.429, p<.001) dimension of the individual student culture.
Table 9. Summary of multiple regression analysis results: Model 1 vs SERVQUAL Dimensions (N=128)
Influence
of: In the level of student service quality expectation about:
Tangibility Reliability Responsiveness Assurance Empathy B
PD -0.051 -0.094 -0.155** -0.134* -0.012
UA 0.223** 0.191* 0.139 0.102 0.101
Coll 0.138* 0.039 0.050 0.048 0.133
LTO 0.286*** 0.443*** 0.285*** 0.421*** 0.429***
Gender 0.125 0.003 0.035 0.043 0.019
Happy -0.024 0.004 0.083 0.079 0.025
Constant 1.687*** 1.769*** 2.337*** 1.871*** 1.224*
R2 0.362 0.431 0.349 0.393 0.224
F-value 10.830*** 15.174*** 10.718*** 12.975*** 5.771***
a. *p < .05, ** p < .01, *** p < .001
b. dependent variables: Tangibility, Reliability, Responsiveness, Assurance, Empathy
To examine the exact impact of cultural values on specific service quality
expectation items, we explore the predictive power of individual cultural values for each of the service quality items within each of the HE-SERVQUAL dimensions. The results of the multiple regression analysis are summarised in Table 10; presented in five panels.
15 The UA (b=.269, p<.05), alongside Coll (b=292, p<.01) dimension, is a predictor (F=4.400, p<.001, R2=.180) of a higher expectation about “Modern university buildings”
(T1). The LTO is a predictor of higher expectations about “Innovative online study support” (T4) (b=.363, p<.01) and “An easily accessible campus through public transport and personal transport” (T5) (b=.499, p<.001).
The student expectation for universities that “do something in a certain time when it was promised” (R1) is influenced by UA (b=.382, p<.001; F=5.390, p<.001, R2=.212) dimension. The PD (b=-.184, p<.05) and LTO (b=.421, p<.001) profile of individual students can statistically significantly affect (F=5.970, p<.001, R2=.230) their
expectations about the willingness and promptness of universities to solve student problems (R2). Similarly, the level of importance that students place on the expectation about “value for money education services as promised without errors”(R3) is influenced (F=7.000, p<.001, R2=.259) by their PD (b=-.144, p<.05), UA (b=.226, p<.05) and LTO (b=.494, p<.001) cultural profile. The LTO profile of students is a predictor of their expectations for high teaching standards and quality academics (R4) (F=7.360, p<.001, R2=.269; b=.527, p<.001); and education provision in manageable class sizes (R5) (F=6.420, p<.001, R2=.243, b=.553, p<.001).
The PD (b=-.245, p<.001; b=.245, p<.01) and LTO (b=.286, p<.01; b=.334, p<.05) cultural profile of students impact their expectations about a) academic and administrative staff who are willing and prompt in responding to student questions (RP2) (F=8.960, p<.001, R2=.309) and b) provide students with equal information support and guidance (RP3) (F=6.140, p<.001, R2=.235). Also, the PD profile of students influences (F=5.510, p<.001, R2=.216, b=-.158, p<.05) the formation of expectations about
academics who provide feedback which will explain how to correct mistakes (RP4).
The LTO cultural profile of students influences the formation of student expectations about a) the national and international reputation of university quality standards (A1) (F=5.210, p<.001, R2=.207, b=.439, p<.001) and b) the university ranking position (A5) (F=2.610, p<.01, R2=.116, b=.502, p<.01). Expectations about the safety of the university environment (A2) are formed (F=8.500, p<.001, R2=.298) by the PD cultural profile (b=-.222, p<.01) and the Gender (b=.261, p<.05) of students. Student employability expectations are shaped by their PD and LTO cultural profile. More specifically, PD (b=-.178, p<.05) and LTO (b=.522, p<.001) influence student
expectations (F=9.500, p<.001, R2=.322) for universities to offer programmes that are designed to meet the needs of the employment market (A3). The PD (b=-.241, p<.01) and LTO (b=.424, p<.001) profile of individual students shapes their expectations (F=7.720, p<.001, R2=.28) for universities that prepare their graduates for the employment market through career advice and links with the industry (A4).
The LTO cultural profile of individual students contributes in shaping their service quality expectations about all Empathy items (E1-E4). Specifically, LTO influences the expectations of students about convenience of university operation
timetable (E1) (b=.329, p<.05; F=3.820, p<.01, R2=.16); the level of individual attention provided to each student by academic and administrative staff (E2) (b=.504, p<.01;
F=3.430, p<.001, R2=.146); and the importance for universities to understand and respond to student personal issues (E3) (b=.473, p<.01; F=2.940, p<.01, R2=.128). The expectation for universities to have academic and mentors who monitor and care about the performance of their students (E4) is influenced (F=4.660, p<.001, R2=.189) by the PD (b=-.215, p<.05) and LTO (b=.408, p<.05) cultural profile of each student.
16 Table 10. Summary of multiple regression analysis results: Model 1 vs service quality items (N=128)
Panel A: Tangibility
T1 T2 T3 T4 T5
PD -0.096 -0.061 -0.112 0.025 -0.008
UA 0.269* 0.224 0.245 0.215 0.156
Coll 0.292* 0.217 0.087 0.026 0.068
LTO 0.123 0.113 0.329 0.363** 0.499***
Gender 0.185 -0.030 0.029 0.37** 0.066
Happy 0.017 -0.089 -0.03 0.061 -0.82
Constant 1.352* 2.207** 2.110*** 1.133 1.643
R2 0.18 0.083 0.256 0.198 0.195
F-value 4.400*** 1.81 6.890*** 4.890*** 4.850***
Panel B: Reliability
R1 R2 R3 R4 R5
PD -0.062 -0.184** -0.144* -0.065 -0.015
UA 0.382** 0.216 0.226* 0.141 -0.011
Coll 0.032 0.023 -0.060 0.037 0.161
LTO 0.221 0.421*** 0.494*** 0.527*** 0.553***
Gender 0.182 -0.038 -0.694 -0.002 -0.055
Happy -0.044 -0.051 -0.021 0.043 0.094
Constant 1.639* 2.281** 2.134** 1.639* 1.152
R2 0.212 0.23 0.259 0.269 0.243
F-value 5.390*** 5.970*** 7.000*** 7.360*** 6.420***
Panel C: Responsiveness
RP1 RP2 RP3 RP4
PD 0.028 -0.245*** -0.245*** -0.158**
UA -0.365 0.153 0.186 0.252**
Coll 0.087 0.037 -0.035 0.110
LTO 0.308 0.286** 0.334** 0.214
Gender -0.021 -0.022 0.102 0.083
Happy 0.272** 0.090 -0.008 -0.023
Constant 1.348 2.783*** 2.769*** 2.446***
R2 0.129 0.309 0.235 0.216
F-value 2.950** 8.960*** 6.140*** 5.510***
Panel D: Assurance
A1 A2 A3 A4 A5
PD -0.136 -0.222** -0.178* -0.241** 0.113
17
UA 0.002 0.264* 0.180 0.079 -0.020
Coll 0.028 0.074 0.022 0.032 0.086
LTO 0.439** 0.212* 0.522*** 0.424*** 0.502***
Gender -0.107 0.261* -0.142 -0.29 0.223
Happy 0.094 0.142 -0.061 0.115 0.111
Constant 2.524*** 1.744** 2.353*** 2.43*** 0.313
R2 0.207 0.298 0.322 0.280 0.116
F-value 5.210*** 8.500*** 9.500*** 7.720*** 2.610**
Panel E: Empathy
E1 E2 E3 E4
PD 0.102 0.108 -0.041 -0.215**
UA 0.147 0.120 0.025 0.112
Coll 0.187 0.079 0.149 0.116
LTO 0.329** 0.504*** 0.473*** 0.408**
Gender 0.042 -0.166 0.157 0.044
Happy 0.106 0.018 -0.037 0.012
Constant 0.651 0.989 1.413 1.843**
R2 0.160 0.146 0.128 0.189
F-value 3.820*** 3.430*** 2.940** 4.660***
a. *p < .05, ** p < .01, *** p < .001 b. dependent variables: service quality items
Discussion and conclusions
Overall, the per-item and per-dimension correlation analysis indicate a large number of statistically significant correlations between the cultural dimensions and the service quality expectation items surveyed in this study. There is a negative relationship between PD and service quality expectations which is broadly in line with H1. Also, there is a positive relationship between LTO and UA and service quality expectations which confirm H2 and H3, respectively. There is no link between Coll and service quality expectations, which confirms H4. Considering there is a significant and sizable (p>.30) correlation between LTO and UA and all dimensions of service quality expectations;
LTO and UA appear to be the cultural dimensions where there is a potential explanatory relationship of service quality expectations.
The multiple regression analysis suggests that the PD is a predictor of Responsiveness and Assurance related items of student service quality expectations which partly confirms H1. The UA is a predictor of Tangibility and Reliability, thus partly confirming H2. The LTO cultural dimension acts as predictor variable for all the constructs of student service quality expectations in higher education which confirms H3. The Coll dimension has limited predictive power as it was found to be linked only with Tangibility and therefore confirms H4.
Students with high LTO appear to have higher expectations for most service quality items included in this study and particularly in relation to employability and value for money. This is an expected connection considering that LTO integrates elements
18 about future personal and professional success. Also, previous studies in other service industries have shown a link between high LTO customers and higher service quality expectations (Kueh and Voon, 2007) and the drive of LTO students for academic success (Figlio et al., 2019).
Our study finds that high UA students have higher service quality expectations across all dimensions of HE-SERVQUAL, and most individual items, but more strongly correlated with Tangibility and Reliability. This corresponds to literature revealing that where tangibles are present in the service environment, like in the case of higher
education, high uncertainty avoidance customers place a high importance on tangibles as components of high service quality (Donthu and Yoo, 1998). Also, the strong correlation between high UA students and Reliability expectations is in line with the literature that suggests that UA individuals, in the prospect of a possible service quality failure, tend to have higher service quality expectations (Furrer et al., 2000).
Students with low PD cultural profile have high service quality expectations across all service quality dimensions, except Empathy. This is explained as an outcome of the higher confidence of customers with high PD profiles and is in line with findings of previous research indicating that customers with high power distance values have lower service quality expectations than customers with low power distance (Donthu and Yoo, 1998; Kueh and Voon, 2007).
Practical implications
The findings of this study justify the value for higher education institutions to explore the cultural profile of their prospective and returning students as a way of understanding and actively managing their service quality expectations. This is
particularly important in the current higher education context where there is an increasing emphasis on improving student experience (Tsiligiris and Hill, 2019), widening
participation (Harisson and Waller, 2017) and promoting cultural inclusion (Smith, 2020). The findings of this study can be used as part of a prospective quality
management approach where the prospective identification of student cultural profile and service expectations allows for an effective management of service and educational quality (Tsiligiris and Hill, 2019). The application of such an approach can include: 1) a pre-arrival cultural values diagnostics survey for new and returning students; 2) the identification of group (e.g., course level) and individual variations in cultural values; and 3) the design of service quality and educational quality interventions. This type of pre- study interventions are already gaining momentum in contemporary HE (O’Donnell et al., 2016). However, at the same time, before implementing these there needs to be consideration of institution level and broader research ethics code (i.e., British Education Research Association) and student data protection aspects (i.e., GDPR, Data Protection Act 1998).
Further research
Further research can explore the link between individual culture and student service quality expectations across courses in different subject areas at one or multiple higher education institutions. This type of research will provide a more comprehensive understanding about the relationship between individual culture and service quality expectations in different contexts. Additionally, further research can explore the longitudinal evolution of student individual culture and service quality expectations at different stages of a course. Such an investigation will provide valuable insights as to
19 whether the educational environment and the learning experience shape the individual cultural values and service quality expectations of students.
References
Abdullah, F. (2006a), “Measuring service quality in higher education: three instruments compared”, International Journal of Research & Method in Education, Vol. 29 No. 1, pp. 71–89.
Abdullah, F. (2006b), “Measuring service quality in higher education: HEdPERF versus SERVPERF”, Marketing Intelligence & Planning, Emerald Group Publishing Limited. DOI:10/b34brv.
Abdullah, F. (2006c), “The development of HEdPERF: a new measuring instrument of service quality for the higher education sector”, International Journal of Consumer Studies, Wiley Online Library, Vol. 30 No. 6, pp. 569–581.
Aghamolaei, T. and Zare, S. (2008), “Quality gap of educational services in viewpoints of students in Hormozgan University of medical sciences”, BMC Medical Education, Vol. 8 No. 1, p. 34.
Ahmed, S. and Masud, M.M. (2014), “Measuring service quality of a higher educational institute towards student satisfaction”, American Journal of Educational
Research, Vol. 2 No. 7, pp. 447–455.
Arambewela, R. and Hall, J. (2006), “A comparative analysis of international education satisfaction using servqual”, Journal of Services Research, Vol. 6 No. 3, pp. 141–
163.
Beugelsdijk, S. and Welzel, C. (2018), “Dimensions and dynamics of national culture:
Synthesizing Hofstede with Inglehart”, Journal of Cross-Cultural Psychology, SAGE Publications Sage CA: Los Angeles, CA, Vol. 49 No. 10, pp. 1469–1505.
Breuer, W., Ghufran, B. and Salzmann, A.J. (2018), “National culture, managerial preferences, and takeover performance”, Managerial Preferences, and Takeover Performance (May 18, 2018).
Brewer, P. and Venaik, S. (2012), “On the misuse of national culture dimensions”, International Marketing Review, Emerald Group Publishing Limited.
DOI:10/f4hdmk.
Browne, B.A., Kaldenberg, D.O., Browne, W.G. and Brown, D.J. (1998), “Student as customer: Factors affecting satisfaction and assessments of institutional quality”, Journal of Marketing for Higher Education, Taylor & Francis Group, Vol. 8 No.
3, pp. 1–14.
Butt, B.Z. and ur Rehman, K. (2010), “A study examining the students satisfaction in higher education”, Procedia-Social and Behavioral Sciences, Elsevier, Vol. 2 No.
2, pp. 5446–5450.
Chatterjee, A., Ghosh, C. and Bandyopadhyay, S. (2009), “Assessing students’ rating in higher education: A SERVQUAL approach”, Total Quality Management &
Business Excellence, Vol. 20 No. 10, pp. 1095–1109.
20 Cronin, J.J. and Taylor, S.A. (1992), “Measuring Service Quality: A Reexamination and
Extension”, The Journal of Marketing, Vol. 56 No. 3, pp. 55–68.
Cronin Jr, J.J. and Taylor, S.A. (1994), “SERVPERF versus SERVQUAL: reconciling performance-based and perceptions-minus-expectations measurement of service quality”, Journal of Marketing, SAGE Publications Sage CA: Los Angeles, CA, Vol. 58 No. 1, pp. 125–131.
Crotts, J.C. and Erdmann, R. (2000), “Does national culture influence consumers’
evaluation of travel services? A test of Hofstede’s model of cross-cultural
differences”, Managing Service Quality: An International Journal, MCB UP Ltd.
DOI:10/fq65xk.
Doña-Toledo, L., Luque-Martínez, T. and Del Barrio-García, S. (2017), “Antecedents and consequences of university perceived value, according to graduates: The moderating role of Higher Education involvement”, International Review on Public and Nonprofit Marketing, Springer, Vol. 14 No. 4, pp. 535–565.
Donthu, N. and Yoo, B. (1998), “Cultural influences on service quality expectations”, Journal of Service Research, SAGE PUBLICATIONS, INC. 2455 Teller Road, Thousand Oaks, CA 91320, Vol. 1 No. 2, pp. 178–186.
Eringa, K., Caudron, L.N., Rieck, K., Xie, F. and Gerhardt, T. (2015), “How relevant are Hofstede’s dimensions for inter-cultural studies? A replication of Hofstede’s research among current international business students”, Research in Hospitality Management, NISC Pty Ltd, Vol. 5 No. 2, pp. 187–198.
Figlio, D., Giuliano, P., Özek, U. and Sapienza, P. (2019), “Long-term orientation and educational performance”, American Economic Journal: Economic Policy, Vol.
11 No. 4, pp. 272–309.
Furrer, O., Liu, B.S.-C. and Sudharshan, D. (2000), “The Relationships between Culture and Service Quality Perceptions: Basis for Cross-Cultural Market Segmentation and Resource Allocation”, Journal of Service Research, Vol. 2 No. 4, pp. 355–
371.
Gliem, J.A. and Gliem, R.R. (2003), “Calculating, interpreting, and reporting Cronbach’s alpha reliability coefficient for Likert-type scales”, Midwest Research-to-Practice Conference in Adult, Continuing, and Community Education., presented at the Midwest Research-to-Practice Conference in Adult, Continuing, and Community Education.
Gronroos, C. (1990), “Service Management: A Management Focus for Service
Competition”, International Journal of Service Industry Management, Vol. 1 No.
1. DOI: 10.1108/09564239010139125.
Gruber, T., Chowdhury, I.N. and Reppel, A.E. (2011), “Service recovery in higher
education: does national culture play a role?”, Journal of Marketing Management, Taylor & Francis, Vol. 27 No. 11–12, pp. 1261–1293.
Gupta, V. (2003), “Cultural dimensions and international marketing”, IIMB Management Review, Vol. 15 No. 3, pp. 69–73.
Hofstede, G. (1985), “The interaction between national and organizational value systems [1]”, Journal of Management Studies, Vol. 22 No. 4, pp. 347–357.