TOURISM
Preliminary communication187
Gábor Dudás / Lajos Boros / György Vida Vol. 65/ No. 2/ 2017/ 187 - 203
UDC: 338.486.21
Gábor Dudás / Lajos Boros / György Vida
Comparing the temporal changes of airfares on online travel agency websites and
metasearch engines
Abstract
Recent trends in transport and communication infrastructures have had a profound impact on the tourism industry. Despite the growing number and importance of online travel agencies and travel metasearch sites tourism literature addressing this issue is very scarce. Th is paper aims to examine the temporal changes of return airfares on online travel agency (OTA) and travel metasearch websites from Budapest to three short-haul destinations for fi xed departure dates in high and shoulder season.
Th e study was based on quantitative research methods using automated internet data collection and statistical analysis (ANOVA tests). During the study, we created a database containing more than 31 thousand ticket prices over a 182-day period for the three selected destinations. Empirical fi ndings showed that no single website off ered lowest airfares consistently and metasearch sites outperformed OTAs in almost any cases by off ering lower airfares. Results also indicated the best time to book fl ights on the selected sites, airfares for shoulder season were signifi cantly cheaper than for high season and ticket prices tend to be more expensive on Mondays and Sundays.
Key words: online travel agency; travel metasearch site; low-cost airlines; ANOVA; airfares ; Hungary
Gábor Dudás, PhD., Institute for Regional Studies, Centre for Economic and Regional Studies, Hungarian Academy of Sciences, Békéscsaba, Hungary; E-mail: gabor.dudas@klartlegal.eu
Lajos Boros, PhD., Department of Economic and Social Geography, University of Szeged, Szeged, Hungary;
E-mail: borosl@geo.u-szeged.hu
György Vida, MSc., Department of Economic and Social Geography, University of Szeged, Szeged, Hungary;
E-mail: vidagyorgy.vida@gmail.com
Introduction
In the second half of the 20th century, the development of transportation and information technologies have had a profound impact on the tourism industry (Buhalis & Law, 2008; Cantallops, Cardona &
Matarredone, 2013; Law, Leung & Buhalis, 2009). Th e establishment of the Computer Reservation Systems (CRSs) in the 1970s followed by Global Distribution Systems (GDSs) in the 1980s and the emergence of the Internet in the late 1990s, have transformed the distribution and travel search pro- cess of tourism globally (Buhalis & Law, 2008; Cantallops, Cardona & Matarredone, 2013; Kracht &
Wang, 2010). Nowadays, the Internet is an ideal distribution channel for tourism as it enables, both, consumers and providers to communicate with each other directly and to take advantage of direct access to information at any time through various channels (Law, Denizci Guillet & Leung, 2010).
In air travel, until the late 1990s, brick-and-mortar travel agencies served as the primary ticket distribu- tion channel for airlines (Koo, Mantin & O'Connor, 2011; Pötzl, 2000). Th e rise of the Internet and its applications to travel and tourism off ered the opportunity to online information search and allowed airlines to sell tickets directly to the public disintermediating travel agents (Buhalis & O'Connor, 2005;
Koo et al., 2011). In the beginning of the Internet era, there were the airline sites followed by the de- velopment of major online travel agencies (OTAs) such as Expedia, Travelocity, and Orbitz. Th ese sites provided global platforms for consumers to gather information and the opportunity to manage all travel related bookings on a single site (Koo et al., 2011; McIvor, O'Reilly & Ponsonby, 2003). Th ese portals
133-260 Tourism 2017 02ENG.indd 187
133-260 Tourism 2017 02ENG.indd 187 3.7.2017. 14:30:363.7.2017. 14:30:36
quickly became popular: for example, in Europe, gross bookings for OTAs totalled 23,6 billion EUR in 2009, and by 2012 it was estimated that OTAs' share of the online leisure and unmanaged busi- ness travel market would reach 37% in Europe and 40% in the US in 2012 (PhoCusWright, 2011).
As airfares became increasingly available on the Internet via various channels, travellers could compare the lowest fares and make purchases any time during the year, and became more sophisticated and fl exible in departure date/time (Law et al., 2010). However, as travellers like to compare travel opti- ons quickly (Olenski, 2015) and use numerous websites to compare prices before making their fi nal bookings (Law & Huang, 2006), the large number of travel websites cause information overload to consumers (Law, Chan & Goh, 2007). So, the searching process became time-consuming and poses unexpected challenges to those who wish to travel cheaply. Th is gave rise to metasearch engines such as Kayak, Skyscanner or Momondo, as these sites display all the information needed for a booking decision by scraping information from various websites and presenting it in one place. Nevertheless, we must note that airfares in the airline industry change frequently due to the use of dynamic pricing strategies and diff erent sales channels (Etzioni, Tuchida, Knoblock & Yates, 2003), thus, for the actors in the airline industry it is very important to make customers know when and where to buy air tickets.
Tourism literature addressing this issue is very scarce, so the aim of the research is to compare the lowest airfares off ered by diff erent major OTAs and metasearch engine websites for selected destinations, and to understand how the airfares vary over a 182-day period. Based on the issues outlined in the previous paragraphs the research seeks to answer the following question: Which online travel search site off ers the lowest fares for fi xed departure dates? In connection with the above, the study is to answer "When is the best time to buy air tickets on OTA sites and metasearch sites for high and shoulder season?"
Th e remainder of this paper is organized as follows. Th e next chapter reviews published articles related to OTAs and metasearch engines. Th at follows the explanation of the methodology discussing the data collection process. After that, fi ndings and analysis are presented and fi nally, the conclusions and directions for future studies are summarized.
Literature review
Historically, travel bookings were conducted via telephone or through a travel agent, but innovation in information technologies and the proliferation of the Internet in the last decade has increased the complexity and changed the structure of travel distribution (Christodoulidou, Conolly & Brewer, 2010a; Buhalis & Laws, 2001; Kracht & Wang, 2010) and created a new competitive environment (Kim, Kim & Han, 2007). Th is evolution and transformation of tourism distribution channels in- creased the competition by off ering more options for consumers and enabling them to search, compare and book proper travel products on their own(Kim et al., 2007; Kracht & Wang, 2010). Due to the convenience and easiness of purchasing online, electronic bookings soon became the norm rather than the exception (Christodoulidou et al., 2010a). In the last decade, a number of contributions have been written in the area of eff ective online travel distribution (Christodoulidou, Brewer, Feinstein & Bai, 2007; Tse & Yim, 2001) and e-commerce (Buhalis & Law, 2008) dealing with themes such as travel intermediaries (Buhalis & Licata, 2002; Christodoulidou, Brewer & Countryman, 2007), OTAs (Gra- nados, Gupta & Kauff man, 2003; Lee, Denizci Guillet & Law, 2013; PhoCusWright, 2011), travel meta sites ( Christodoulidou et al., 2007; Christodoulidou et al., 2010a, b; Dorn, Hrastnik, Rainer
& Starzacher, 2008), e-travel and tourism (Buhalis, 2003; Buhalis & Licata, 2002; Dorn, Hrastnik, Rainer & Starzacher, 2008) and the list is not exhaustive.
In this new competitive and ever-changing environment, OTAs rapidly acquired a large share of the market and nowadays play a fundamental role in travel distribution, representing 38% of the global
TOURISM
Preliminary communication189
Gábor Dudás / Lajos Boros / György Vida Vol. 65/ No. 2/ 2017/ 187 - 203
online market and 13% of the total market with gross bookings exceeding $150 billion dollars (Car- roll & Sileo, 2014). Th eir success and popularity could be attributed to diff erent reasons. Law and Leung (2000) attributed it to their client-centric approach, Kim, Bojanic and Warnick (2009) re- lated to consumers' growing confi dence in online purchase, while Law, Leung, Lo, Leung and Fong (2015), Morosan and Jeong (2008) and Tse (2003) highlighted that the Internet eliminates the need for customers to be physically present at the travel agency during the purchasing process. In addition, O'Connor and Murphy (2008) and Mantin and Koo (2010) stressed that price is the primary force that fosters travellers to purchase online.
As consumers were able to search on diff erent websites to fi nd the best fares or travel products that fi t their individual needs, comparing prices among various websites became crucial due to the abundant supply of online distribution channels. A number of studies have addressed this issue: Gazzoli, Kim and Palakurthi (2008) compared online room prices of global hotel chains across online distribution channels and own brand sites and their results showed that chain websites outperformed OTA sites by off ering the lowest rates; in their study Clemons, Hahn and Hitt (2002) analysed price dispersion and product diff erentiation on diff erent OTAs and found that ticket prices vary by as much as 18% across OTAs; Law and Chang (2007) investigated the online pricing practice on three OTAs, while Law et al. (2010) examined the practices of fi ve OTA websites and their empirical fi ndings showed that local or regional OTAs outperformed the global leaders in off ering lower airfares.
Considering the fundamental role of OTAs in travel distribution researchers also highlight some prob- lems regarding the use of OTAs (Buhalis & Law, 2008; Tso & Law, 2005) as they provide too many choices to possible customers. People like to check best prices before booking on multiple websites and as Higgins (2010) stated travellers made an average of 21 visits before booking a trip, while according to Breure (2013) consumers visit on average 5-6 sites looking for hotels, which can lead to an over- supply of information and complicates and slows down the decision-making and booking process. In addition, most of the major OTAs do not display ticket prices from low-cost airlines as these airlines pursue a diff erent business and ticket distribution model and prefer to sell their tickets via their own websites. Travel meta sites, the new generation of online travel agencies can off er a solution to these problems (Christodoulidou et al., 2007). Th e main diff erence between OTAs and metasearch sites lies in their diff erent operational and revenue generating mechanism. OTAs (such as Expedia, Orbitz, etc.) operate by collecting information from customers (e.g. departure and arrival destination, preferred fl ight times, the number of travellers). Th is information is submitted to a computerized reservation system (CRS) which searches for relevant fl ights matching the search criteria. Th e agency receives the requested information from the CRS and provides it to the customer in the form of a travel itinerary.
If the customer purchases a ticket from this fi nal output, the OTA processes the booking with the CRS and receives a commission from the airline in return (Clemons et al., 2002; Kim et al., 2007).
Unlike OTAs, travel meta sites operate by gathering data simultaneously from multiple online travel websites (including the OTAs) (Park & Gretzel, 2006) by using their inventory and present the search results on a single screen (Clemons et al., 2002; Kim et al., 2007). Nevertheless, we have to note that meta sites do not provide the full range of travel possibilities and content usually found on OTA sites as their search area do not cover all travel related OTAs and websites. Besides, they do not off er the possibility to complete the booking transaction (i.e. there is no actual money transfer). Instead, they only refer or link the potential buyers directly to the source website (OTA, airline or other third-party website), where the booking transaction can be completed. Th is may raise the question of how reliable are the listed prices on the metasearch sites. According to the metasearch companies' business policy, they enforce strict price accuracy policies with all their data providers and partners and endeavour to
133-260 Tourism 2017 02ENG.indd 189
133-260 Tourism 2017 02ENG.indd 189 3.7.2017. 14:30:363.7.2017. 14:30:36
ensure that data content listed on the site is accurate and up-to-date. Moreover, as Michael McCartan stated the "Battle Gets Bloodier" between OTAs and metasearch engines (McCartan, 2014), to main- tain their steady growth path (Reals & Hadwick, 2015), metasearch engines cannot aff ord and tole- rate to list prices from sources which are not reliable. Meta sites receive commissions or payment after they have linked the potential buyer to the website (pay per click model) regardless whether the consumers fi nish the booking or just visit the site (Christodoulidou et al., 2007; Christodoulidou et al., 2010a, b). In contrast, the OTAs have to pay the CRS a fee for each query regardless of whether the customer purchased the product or not, but OTAs get only revenue if the traveller purchases a product (Clemons et al., 2002).
As travel meta sites are increasing in number and gaining market share and popularity (Christodouli- dou et al., 2007) it is important to analyse the variations of publicly available lowest fares off ered by OTAs and meta sites, as the existing travel literature has a few if any published articles addressing this issue. Th us, this paper makes an attempt to bridge this gap by comparing lowest airfares available on major OTAs and metasearch sites for a fi xed departure date and tries to defi ne the best time to book air tickets for shoulder and high season on diff erent travel sites.
Methodology
Th e purpose of this study is to identify the temporal changes of airfares on major OTAs and travel metasearch sites. Quantitative data collection was used and airfare data was directly collected from major travel websites including OTAs and travel metasearch engines. It is important to note, that there are several OTAs (e.g. CheapTickets, Expedia, Orbitz, Priceline, Travelocity, etc.) and travel metasearch (e.g. Kayak, Momondo, Skyscanner, etc.) websites, but due to our limited resources we had to maxi- mize the number of websites included in the study. According to previous studies of Law et al. 2010 and Law, Leung, Denizci Guillet and Lee (2011), we decided to collect data from fi ve major travel- related websites including three OTAs (Expedia, Orbitz, Cheaptickets) and two metasearch engines (Kayak, Skyscanner). During the selection, we wanted to include the largest online service providers, but we had to consider that the website should have been compatible with our data collection agent.
Considering this, we selected Expedia, the world's leading online travel agency and Orbitz (ranked 4) (Euromonitor International, 2014) as these two represent 60% of all European OTA gross book- ings (Sileo, 2015). Th e reason for including CheapTickets is twofold. On the one hand, according to Law et al. (2011) CheapTickets is a "specialized travel website that off ers additional products like concerts and sports", so it enables consumers to search and book a range of travel products (e.g. air travel, hotels, cruises, car rentals, etc.) and off ers additional destination services such as event tickets like sport, theatre, and concerts (MarketLine, 2014), which can be attractive to potential customers.
On the other hand, as CheapTickets is an Orbitz affi liate it enables us to analyse the changes of lowest fares on affi liated websites. Kayak and Skyscanner were included as they are generally recognized as leaders among metasearch sites (Coletta, 2015) and both focus mainly on fl ight search.
After the selection of the data sources, Budapest was chosen as the departure city. Th e reason for choosing Budapest, on the one hand, is that the city has a well-developed airport and transport in- frastructure while on the other hand, we wanted an airport which has a strong competition between network carriers and low-cost carriers (LCCs), and after the bankruptcy of Malév Hungarian Airlines in 2012, the passenger traffi c of Budapest Airport changed signifi cantly and the share of LCCs rose from 26% to over 50% (Budapest Airport, 2013). During the selection of destination cities, due to our limited resources, we selected three popular European short-haul travel destinations including London, Paris, and Barcelona. London and Paris were included in the study as these were the two top
TOURISM
Preliminary communication191
Gábor Dudás / Lajos Boros / György Vida Vol. 65/ No. 2/ 2017/ 187 - 203
destinations from Budapest Airport considering the number of weekly departures (88 to London, 50 to Paris weekly departures in summer 2015), while Barcelona was selected as a popular tourist destina- tion from Hungary, with 18 weekly departures in summer 2015 (Hungarian Central Statistical Of- fi ce, 2015). Besides, the low-cost airline traffi c to these cities was also signifi cant as these destinations were served by three or more LCCs - London by Ryanair, Norwegian, EasyJet, and Wizzair; Paris by EasyJet, Ryanair, and Transavia; Barcelona by Ryanair, Wizzair, and Vualing - from Budapest during the data collection period.
In the study, we checked the fare data for fi xed departure dates but with fl exible booking dates. At fi rst, we divided the travel in Europe to 3 seasons: low season (off season) - November through March;
shoulder season – April to mid-June and September through October; high season – mid-June through August. Considering this, data collection was conducted from February 2, 2015 to May 31, 2015 for shoulder season airfares and from February 2, 2015 to August 2, 2015 for high season airfares daily.
In the study 7-day return tickets (return fl ights seven days after departure) were obtained (Dudás, Boros, Pál & Pernyész, 2016a, b; Law et al., 2011) and the departure dates were on each day during the period June 1 to 7, 2015 for shoulder season and August 3 to 8, 2015 for high season. For each fl ight, we recorded the listed lowest ticket price for an economy class fl ight. We did not consider any additional costs (e.g. checked-in baggage, seat reservation, administrative charges, etc.). Although we have to note that some carriers in the economy fare include the checked-in baggage price while others not, however, the focus of this study was to compare the cheapest ticket prices listed on the selected sites, so we did not make a distinction if the checked-in baggage price was included or not in the cheapest fare. To increase the effi ciency of the data extraction, we used a software called iMacros, which is an extension for web browsers (Mozilla Firefox, Google Chrome, and Internet Explorer) developed by iOpus/Ipswitch. It can "import or export data to and from web applications using CSV and XML fi les, databases, or any other source" (iMacros, 2016), and can perform tasks such as "fi nding and extracting text (prices, product description stock quotes, etc.) and images from websites" (iMacros, 2016). Th is program was run at scheduled intervals, extracted pricing data, and stored the results into a database for further analysis according to pre-defi ned parameters (e.g. departure and arrival airport, departure and return date, direct or indirect fl ight, cabin class, passenger numbers etc.). Altogether, we collected over 31 thousand ticket prices over a period of 182 days for three diff erent destinations.
Finally, we performed statistical analyses (one-way ANOVA) on the retrieved data and compiled the necessary diagrams and charts for further analysis.
Analysis and fi ndings
Weekly airfares
Figure 1 and 2 present the average weekly lowest airfares from Budapest to London for high and shoulder season during the data collection period. Th e fi gures highlight unambiguously that ticket prices are more expensive for high season and outline signifi cant diff erences between airfares off ered by OTAs and metasearch sites. Th e diagrams present that metasearch sites outperformed OTAs in any cases by off ering lower airfares throughout the study period but none of the websites off ered lowest airfares uniformly. Th is discrepancy in airfares is presumably due to that metasearch sites list also tickets from low-cost carriers while on OTA sites they are rarely or not listed and the price diff erence between network carriers and low-cost carriers might cause such a gap in airfares.
Ticket prices for high season (Figure 1) showed moderate growth with low price fl uctuations. Kayak off ered the cheapest fl ights to London in week 26 prior to departure (130.1 USD), while Skyscanner the second lowest in week 25 (133.2 USD). Based on Figure 1 consumers can save money if they book
133-260 Tourism 2017 02ENG.indd 191
133-260 Tourism 2017 02ENG.indd 191 3.7.2017. 14:30:363.7.2017. 14:30:36
fl ights as early as possible on metasearch engines. However, till week 14 they can purchase tickets for less than 180 USD. Considering OTAs, the lowest price was off ered by Expedia in week 17 prior to departure (220.53 USD) and it also off ered lower airfares (15 USD cheaper on average) consistently till week 3 than Orbitz or Cheaptickets.
Figure 1
Average weekly lowest airfares to London on diff erent websites (high season)
Shoulder season airfares to London (Figure 2) were signifi cantly cheaper (approximately 50 USD on the average) than high season fares and consumers could fi nd fl ights for less than 130 USD till week 3 on a metasearch website. Likewise, prices on metasearch sites were lower and the cheapest tickets were also off ered at the beginning of the study period: the lowest in week 16 (83.71 USD) and second lowest in week 15 (85.18 USD) prior to departure by Kayak.
Based on the fi ndings, signifi cant price increase can be outlined on metasearch sites within the last 4-5 weeks in both seasons as ticket prices rose about 80 USD, so it would be the best interest for budget- conscious consumers to avoid booking within the last few weeks in both seasons. In contrast, OTA prices showed low or no price increase in the same period.
Figure 2
Average weekly lowest airfares to London on diff erent websites (shoulder season)
In contrast to the airfares to London lowest airfares from Budapest to Paris (Figure 3 and 4) signal minor fl uctuations and outline three diff erent price levels. Skyscanner and Kayak off ered lower airfares continuously, but Expedia outperformed signifi cantly the other two OTAs forming a second price level.
10080 120140 160180 200220 240260 280300 320340
Week26 Week25 Week24 Week23 Week22 Week21 Week20 Week19 Week18 Week17 Week16 Week15 Week14 Week13 Week12 Week11 Week10 Week9 Week8 Week7 Week6 Week5 Week4 Week3 Week2 Week1
USD
Skyscanner Kayak Expedia Orbitz Cheaptickets
10080 120140 160180 200220 240260 280300 320340
Week17 Week16 Week15 Week14 Week13 Week12 Week11 Week10 Week9 Week8 Week7 Week6 Week5 Week4 Week3 Week2 Week1
USD
Skyscanner Kayak Expedia Orbitz Cheaptickets
TOURISM
Preliminary communication193
Gábor Dudás / Lajos Boros / György Vida Vol. 65/ No. 2/ 2017/ 187 - 203
Apparently, Skyscanner off ered the lowest airfares for both high- and shoulder seasons consistently except week 13, 16 and 17 in shoulder season when booking on Kayak was cheaper.
Figure 3
Average weekly lowest airfares to Paris on diff erent websites (high season)
Based on our fi ndings, the best time for price sensitive consumers to make their purchases to Paris for high season (Figure 3) was not at the beginning of the study period, but in the 15th and 16th week before departure, as the lowest fares were off ered by Skyscanner in the 15th week (127.9 USD) and the second lowest in the 16th week (131.7 USD) prior to departure. Till week 9 consumers can book tickets on metasearch engines for less than 150 USD but as the departure date approaches a sharp increase in airfares was experienced and prices rose approximately 40 USD in the last four week. Similar to Figure 1, Orbitz and Cheaptickets performed the worst and Expedia off ered about 30 USD cheaper tickets on the average. Despite the two price levels among OTAs, Figure 3 highlight a minor increase in airfares from the beginning till week 22, lower values between week 20 to 14 and slow increase from week 14 till departure.
Figure 4
Average weekly lowest airfares to Paris on diff erent websites (shoulder season)
Shoulder season tickets to Paris (Figure 4) outlined similar trends as in high season. Small or no diff er- ence was between prices off ered by Orbitz and Cheaptickets as well as between prices of Skyscanner and Kayak. Th e price gap between Expedia and the other two OTA was lower in shoulder season (20 USD) than in high season (30 USD) on the average. Apparently, prices on metasearch sites were lower and Kayak listed the lowest airfare in week 17 prior to departure (113.14 USD), while the second lowest
10080 120140 160180 200220 240260 280300 320340
Week26 Week25 Week24 Week23 Week22 Week21 Week20 Week19 Week18 Week17 Week16 Week15 Week14 Week13 Week12 Week11 Week10 Week9 Week8 Week7 Week6 Week5 Week4 Week3 Week2 Week1
USD
Skyscanner Kayak Expedia Orbitz Cheaptickets
10080 120140 160180 200220 240260 280300 320340
Week17 Week16 Week15 Week14 Week13 Week12 Week11 Week10 Week9 Week8 Week7 Week6 Week5 Week4 Week3 Week2 Week1
USD
Skyscanner Kayak Expedia Orbitz Cheaptickets
133-260 Tourism 2017 02ENG.indd 193
133-260 Tourism 2017 02ENG.indd 193 3.7.2017. 14:30:363.7.2017. 14:30:36
in week 16 (113.93 USD) Skyscanner. Airfares were below 120 USD in week 17, 16 and 12 for the metasearch engines and until week 4 they remained below 130 USD except week 8 and 9 for Kayak.
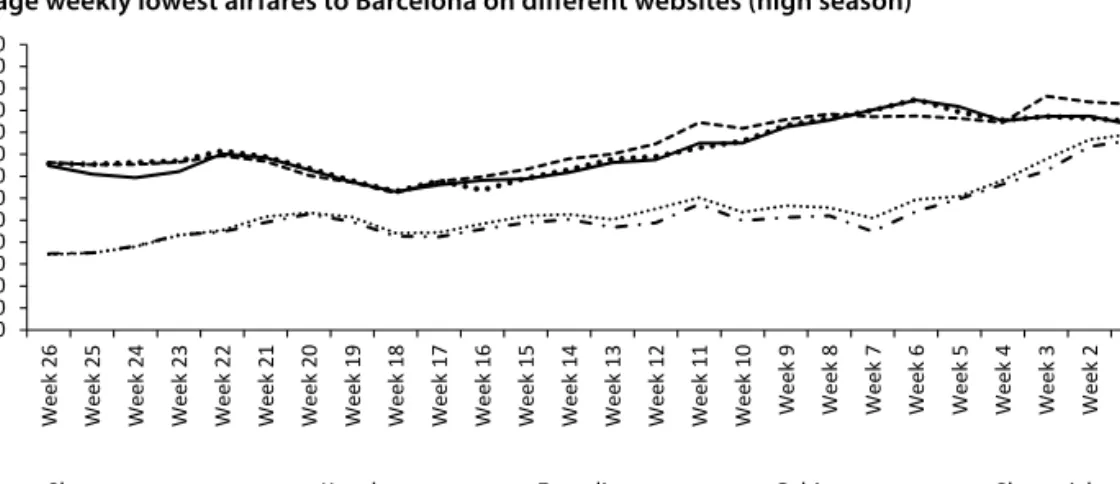
Figure 5 and 6 presents the weekly average lowest airfares from Budapest to Barcelona for high and shoulder season during the data collection period. Small or no diff erence was between prices off ered by OTAs as well as between prices of Kayak and Skyscanner. Although the fi gures highlight signifi cant diff erences between the price trends of the two season's airfares, the dichotomy between price levels of OTAs and the metasearch sites is present at Barcelona too. During high season (Figure 5) the price trend of OTAs and the metasearch engines signal diff erent pattern. Similarly, metasearch sites outperformed OTAs by off ering lower prices. Th e cheapest airfares were off ered by Kayak in week 26 (148.9 USD) and the second lowest in week 25 (150.1 USD) prior to departure. Apparently, airfares in the fi rst six weeks off ered by metasearch engines showed a moderate increase and rose to a level of 180 USD.
Between week 20 and week 8, the value fl uctuated around this level when a second, sharper increase was experienced and airfares rose approximately 80 USD in the last seven weeks. In contrast, a minor increase was outlined on OTA sites from week 26 till week 22 but then between week 22 and week 18 airfares dropped from 240 to 205 USD. Th at was followed by a steady rise of airfares till week 6 when Orbitz and Cheaptickets started to decrease slowly while Expedia continued the rise.
Figure 5
Average weekly lowest airfares to Barcelona on diff erent websites (high season)
Figure 6
Average weekly lowest airfares to Barcelona on diff erent websites (shoulder season) 10080
120140 160180 200220 240 260280 300320 340
Week26 Week25 Week24 Week23 Week22 Week21 Week20 Week19 Week18 Week17 Week16 Week15 Week14 Week13 Week12 Week11 Week10 Week9 Week8 Week7 Week6 Week5 Week4 Week3 Week2 Week1
USD
Skyscanner Kayak Expedia Orbitz Cheaptickets
10080 120140 160180 200220 240 260280 300320 340
Week17 Week16 Week15 Week14 Week13 Week12 Week11 Week10 Week9 Week8 Week7 Week6 Week5 Week4 Week3 Week2 Week1
USD
Skyscanner Kayak Expedia Orbitz Cheaptickets
TOURISM
Preliminary communication195
Gábor Dudás / Lajos Boros / György Vida Vol. 65/ No. 2/ 2017/ 187 - 203
Shoulder season tickets to Barcelona (Fig. 6) highlight that OTAs off ered almost the same prices with no or minor price changes. Ticket prices moved around 200 USD and increased only with approximately 20 USD during the data collection. Airfares by metasearch sites showed a minor increase between week 17 and week 13 which was followed by a minor decrease between week 13 and week 5. Diff erent from the shoulder season values of London and Paris, the lowest prices were not accessible at the beginning of study period as Skyscanner off ered the lowest fares in week 5 (116.2 USD) and second lowest in week 8 (118.5 USD) prior to departure. Th is indicates that budget-conscious consumers could save money if they make their purchases between week 10 and week 3 in shoulder season while for high season they have to book as soon as possible on metasearch sites to get the best fares to Barcelona.
Daily airfares
In fi gures 7 to 9, we present the average daily airfares to the three destination cities on diff erent days of the week according to data from the fi ve websites included in the study. Apparently, airfares diff er for each day of the week; furthermore average daily airfares for shoulder season were lower throughout the study period, but signifi cant diff erences can be observed between OTAs and metasearch values similarly to the weekly trends (Figure 1 to 6).
Figure 7
Average lowest airfares to London on diff erent days of the week on diff erent websites
Figure 7 indicates that Kayak off ered the cheapest tickets for every day of the week in both seasons during the study period. High season airfares on metasearch sites are more expensive on the fi rst day
350 250 150 50 50 150 250 350
Skyscanner Kayak Expedia Orbitz Cheaptickets
High season Shoulder season
Monday
Tuesday
Wednesday
Thursday
Friday
Saturday
Sunday
Ticket price (USD)
133-260 Tourism 2017 02ENG.indd 195
133-260 Tourism 2017 02ENG.indd 195 3.7.2017. 14:30:373.7.2017. 14:30:37
(approx. 195 USD) and last day of the week (approximately 190 USD), while lowest airfares are off ered on Th ursdays (approx. 163 USD). In shoulder season budget-conscious consumers can save money if they book fl ights for Tuesdays (approx. 100 USD) or for Wednesdays (approx. 102 USD) and try to avoid fl ying on Mondays (approximately 137 USD) and Fridays (approx. 135 USD). A similar trend showed the daily numbers of the OTAs for high season outlining a Th ursday low-point (approx. 240 USD) and a Sunday peak (approx. 300 USD). Th e only diff erence is that highest fares on Expedia were on Saturdays not on Sundays. Likewise, OTA values for shoulder season outline a Monday (approx.
239 USD) and Sunday (approx. 240 USD) peak with a Th ursday low-point (approx. 205 USD), but Expedia off ers the cheapest fl ights for Tuesdays.
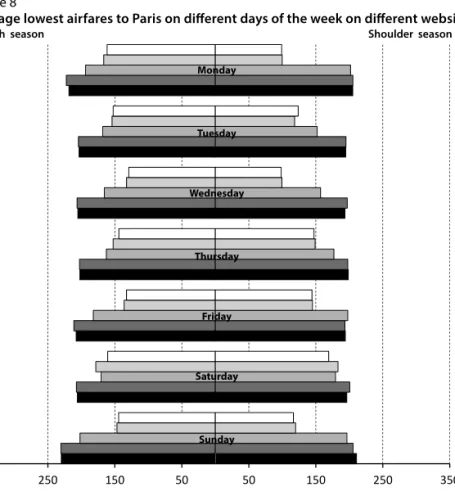
Figure 8 presents the daily airfares to Paris. No single website off ered the lowest airfares consistently.
Nevertheless, ticket prices on metasearch sites showed considerable fl uctuations for both seasons. For high season the weekly peaks are on Mondays and Saturdays, while the cheapest tickets are off ered on Wednesdays and Fridays. For shoulder season the weekly high end is on Saturday with two low points on Mondays and Wednesdays. Interestingly, our empirical fi ndings showed that for Fridays and Sundays shoulder season ticket prices are higher than for high season and budget conscious consumer have to take into account, that price diff erence between the lowest daily average airfare (Wednesday 99 USD) and the highest (Saturday 175 USD) could be more than 76 USD in shoulder season to Paris.
Figure 8
Average lowest airfares to Paris on diff erent days of the week on diff erent websites
350 250 150 50 50 150 250 350
Skyscanner Kayak Expedia Orbitz Cheaptickets
High season Shoulder season
Monday
Tuesday
Wednesday
Thursday
Friday
Saturday
Sunday
Ticket price (USD)
TOURISM
Preliminary communication197
Gábor Dudás / Lajos Boros / György Vida Vol. 65/ No. 2/ 2017/ 187 - 203
Considering OTA values, Expedia outperformed signifi cantly the other two OTAs on a daily basis similarly to weekly values (Figure 3 and 4); furthermore, for Saturday fl ights it is cheaper than Kayak for both seasons. Besides, ticket prices off ered by OTAs showed a Monday and Sunday peak, while in the case of Cheaptickets and Orbitz no clear low point is outlined rather airfares moved around approximately 205 USD in high season and 195 USD in the shoulder season.
Figure 9 shows that Kayak off ered the cheapest tickets for every day of the week in both seasons to Barcelona. High season airfares on metasearch sites were cheaper (around 170 USD) in the middle of the week (Wednesday, Th ursday, Friday), while on the other days were around 200 USD. For shoul- der season quite the opposite trends could be observed as ticket prices for Th ursday fl ights were the highest (approx. 165 USD) and consumers could save money if they travel on Saturdays or Sundays.
Figure 9 also highlighted that OTAs off ered almost the same prices per day per season and the values indicate lower fares for Tuesdays in high season and for Th ursdays in shoulder season with Sunday peaks for both season.
Figure 9
Average lowest airfares to Barcelona on diff erent days of the week on diff erent websites
Discussion and implications
Th e research is unique in the sense that no previous studies investigated the diff erence between the off erings of OTAs and metasearch sites as former studies of Law et al. (2010, 2011) were focusing only
Skyscanner Kayak Expedia Orbitz Cheaptickets
High season Shoulder season
350 250 150 50 50 150 250 350
Monday
Tuesday
Wednesday
Thursday
Friday
Saturday
Sunday
Ticket price (USD)
133-260 Tourism 2017 02ENG.indd 197
133-260 Tourism 2017 02ENG.indd 197 3.7.2017. 14:30:373.7.2017. 14:30:37
on OTA off erings using Hong Kong as departing city. Th e inclusion of metasearch sites in the study eliminated also a defi ciency of the papers of Law et al. (2010, 2011) namely, that airfares of low-cost carriers were not included in their analysis.
To test the diff erence between the off erings of OTAs and metasearch sites ANOVA was used and the results showed (Table 1) that among the included websites Skyscanner and Kayak ranked 1st and 2nd in turn in terms of lowest airfares while Expedia was ranked 3rd (except Barcelona in high season) for all destinations, while in almost all cases Orbitz and Cheaptickets returned the highest fares. According to the work of Law et al. (2010), our results show some similarities to these fi ndings as the Orbitz affi liate Cheaptickets outperformed its "conglomerate" in high seasons and in Paris in the shoulder season.
In London, the Tukey HSD post hoc analysis indicated a huge price gap between the off erings of metasearch and OTAs. Metasearch sites listed approximately 89 USD (in high season) cheaper tickets, while the gap in shoulder season was even higher approximately 103 USD. Th is is probably due to that metasearch sites list also airfares from low-cost carriers and they off er signifi cantly cheaper tickets than network carriers. Th e same test shows that the price gap in case of Paris is smaller than in London. It also confi rms the three price levels of Figure 3 and 4. Th e two metasearch site provided approximately 28 USD (in high season) and 50 USD (in shoulder season) cheaper tickets than Expedia, while the other two OTAs off ered more than 60 USD higher prices in both seasons. Th e Tukey HSD post hoc analysis of the Barcelona numbers also showed that metasearch sites outperform OTAs in off ering cheaper fares, but in contrast to the other two cities the diff erence between the means of the two season is negligible, namely 58 USD in high season and 59 USD in the shoulder season.
Table 1
ANOVA analysis for lowest airfares on diff erent websites
Skyscanner Kayak Expedia Orbitz Cheaptickets df F ratio London Mean 178.21 (2) 174.51 (1) 254.92 (3) 272.65 (5) 270.76 (4) 4 439.24*
high Std. 26.46 29.69 38.51 30.1 33.48
season Min. 130.57 127.14 172.43 226.43 221.43
Max. 259.86 263.86 350 331.71 337.71
London Mean 118.52 (2) 115.76 (1) 211.54 (3) 224.11 (4) 226.84 (5) 4 826.56*
shoulder Std. 26.01 26.88 23.83 12.59 14.82
season Min. 76.57 77.71 165.42 204.29 200.86
Max. 213.71 218.71 278.57 267 268.57
Paris Mean 146.44 (1) 152.5 (2) 177.89 (3) 212.15 (5) 210.48 (4) 4 902.107*
high Std. 13.68 15.02 15.78 12.47 12.44
season Min. 114.14 132.14 148.29 191 190.86
Max. 195 201.29 231 239.29 237.43
Paris Mean 128.31 (1) 130.62 (2) 180.21 (3) 199.26 (5) 198.93 (4) 4 1392.7*
shoulder Std. 12.35 13.25 8.42 8.09 8.63
season Min. 106 104.86 163.29 176.86 174.86
Max. 170 174.86 211.29 223 221.43
Barcelona Mean 183.9 (2) 189.13 (1) 248.56 (5) 245.16 (4) 243.68 (3) 4 276.51*
high Std. 25.97 27.94 26.9 25.1 25.96
season Min. 145 145.14 199.17 199.43 197.86
Max. 258.86 270.14 309.14 295.71 293.57
TOURISM
Preliminary communication199
Gábor Dudás / Lajos Boros / György Vida Vol. 65/ No. 2/ 2017/ 187 - 203
Skyscanner Kayak Expedia Orbitz Cheaptickets df F ratio Barcelona Mean 139.24 (1) 145.29 (2) 199.84 (3) 201.92 (4) 203.54 (5) 4 692.48*
shoulder Std. 17.51 18.29 9.3 7.48 11.4
season Min. 111.43 113.86 181.71 186.43 185.43
Max. 180.57 187.43 232.43 224 255.57
1) numbers in parentheses after mean values represent the ranking of the site in a destination 2) *denotes signifi cant diff erence at a 0.05 level
Based on our empirical, data timing is an important factor that consumers should consider when they search and book airfares. Our empirical results decisively confi rmed the fi ndings of Mantin and Koo (2010) that price-sensitive travellers should purchase their tickets as soon as possible but they should use multiple channels (e.g. Kayak and Skyscanner) to get the best prices as none of the websites of- fered lowest fares consistently. Our fi ndings also indicate that travellers should be aware of prices on metasearch sites as the prices show a signifi cant increase in the last few weeks before departure but they are still lower than of the OTAs.
Table 2 presents the average daily lowest airfares of the fi ve websites on diff erent days of the week. Th e ANOVA results strengthen the previous research, which highlight that ticket prices tend to be cheaper in the middle of the week and the weekly high ends are on Mondays and Sundays. In our study, the only exception is the shoulder season data for Paris, as the low points are on Tuesdays and Wednesdays, but the high ends are not at Monday and Sunday but on Friday and Saturday.
Table 2
ANOVA analysis for lowest airfares on diff erent days of the week
Monday Tuesday Wednesday Thursday Friday Saturday Sunday df F ratio London Mean 243.1 (6) 214.03 (3) 213.19 (2) 209.62 (1) 232.21 (4) 242.7 (5) 256.82 (7) 6 89.78*
high Std. 54.16 48.5 45.94 46.88 59.9 71.78 72.14
season Min. 135 116 115 83 129 113 135
Max. 394 360 311 363 382 449 429
London Mean 198.78 (7) 164.39 (1) 169.74 (2) 171.58 (3) 185.33 (5) 175.79 (4) 191.45 (6) 6 27.68*
shoulder Std. 58.84 61.52 59.13 47.79 45.42 62.21 67.58
season Min. 89 59 59 79 92 65 80
Max. 317 281 282 272 279 341 390
Paris Mean 192.58 (7) 176.58 (4) 167.88 (1) 172.94 (2) 173.94 (3) 184.69 (5) 190.7 (6) 6 68.55*
high Std. 37.99 27.78 36.82 26.57 38.47 23.43 44.9
season Min. 92 121 76 132 93 127 108
Max. 305 260 254 223 243 287 280
Paris Mean 162.08 (3) 156.75 (2) 148.9 (1) 173.76 (5) 174.74 (6) 185.73 (7) 169.53 (4) 6 59.19*
shoulder Std. 53.2 34.68 47.39 25.67 31.69 15.91 50.24
season Min. 67 108 59 120 90 141 86
Max. 250 221 212 239 260 237 306
Barcelona Mean 232.35 (6) 215.63 (4) 205.72 (1) 210.28 (2) 211.78 (3) 230.87 (5) 246.99 (7) 6 109.87*
high Std. 43,26 29.21 39.54 39.8 44.29 46 55.46
season Min. 145 149 130 127 115 145 148
Max. 415 306 284 313 305 331 379
Table 1 Continued
133-260 Tourism 2017 02ENG.indd 199
133-260 Tourism 2017 02ENG.indd 199 3.7.2017. 14:30:373.7.2017. 14:30:37
Monday Tuesday Wednesday Thursday Friday Saturday Sunday df F ratio Barcelona Mean 183.35 (7) 171.25 (1) 175.58 (3) 181.9 (5) 176.11 (4) 173.9 (2) 182.74 (6) 6 10.78*
shoulder Std. 39.19 31.49 34.13 24.87 32.44 38.65 44.23
season Min. 102 77 83 111 104 82 94
Max. 283 212 249 278 284 294 263
1) numbers in parentheses after mean values represent the ranking of the days in a destination.
2) *denotes signifi cant diff erence at a 0.05 level.
Conclusions
Th is study contributed to previous research investigating the temporal changes of airfares toward fi xed departure date (Law et al., 2010, 2011) but extended the data sources by including data from metasearch sites. Despite the limited scope, it contributed to tourism literature as it compared lowest daily airfares of OTAs and metasearch sites for three popular destinations from Budapest in a period of 182 days.
Th e results indicated (and confi rmed previous studies) that tickets for shoulder season were signifi cantly cheaper than for high season and ticket prices tend to be more expensive on Mondays and Sundays.
Our empirical fi ndings also showed that people should book fl ights as soon as possible, as airfares would be toward the high end if the purchase is made in the last few weeks prior to departure. Nevertheless, our data highlighted that consumers should use multiple channels (especially metasearch sites) to get the best fares as no single website off ered lowest fares consistently but metasearch sites outperformed OTAs in almost any cases by off ering lower airfares throughout the study period.
Like other researches, this study has some limitations, which may not allow us to generalize the con- clusions to all OTA and metasearch site and for all destination. Th e major limitation of this study is the use of only three European short-haul destinations. Future research could enlarge the scope of the study by including long-haul destinations and more short-haul destinations from various continents too. Another limitation is the relatively small number of OTAs and metasearch sites, which expan- sion could give a more detailed picture of when the best time is and on which site to purchase airline tickets. In spite of the limitations of this study, our fi ndings can off er relevant information for tourism researchers and practitioners to better understand the online pricing practices of OTAs and metasearch sites. Consumers can also learn from the fi ndings as they got an estimation about when the best time is to purchase airfares from online travel websites.
References
Breure, E. (2013). Metasearch is booming in travel: an analysis. Retrieved from http://www.olery.com/blog/metasearch- is-booming-in-travel-an-analysis/.
Budapest Airport (2013). A Malév-csőd ellenére jól teljesített a Budapest Airport. Retrieved from http://www.bud.hu/
budapest_airport/media/hirek/a-malev-csod-ellenere-jol-teljesitett-a-budapest-airport-12286.html.
Buhalis, D. & Law, R. (2008). Progress in information technology and tourism management: 20 years on and 10 years after the Internet – The state of tourism research. Tourism Management, 29, 609-623.
Buhalis, D. & Laws, E. (2001). Tourism Distribution Channels: Practices, Issues and transformations. London: Continuum.
Buhalis, D. & Licata, C. (2002). The future eTourism intermediaries. Tourism Management, 23, 207-220.
Buhalis, D. & O'Connor, P. (2005). Information communication technology revolutionizing tourism. Tourism Recreation Research, 30(3), 7-16.
Buhalis, D. (2003). eTourism. Information technology for strategic tourism management. Pearson Education Limited.
Table 2 Continued
TOURISM
Preliminary communication201
Gábor Dudás / Lajos Boros / György Vida Vol. 65/ No. 2/ 2017/ 187 - 203
Cantallops, A. S., Cardona, J. R. & Matarredone, M. G. (2013). The impact of search engines on the hotel distribution values chain. REDMARKA – CIECID – Unidad de Investigacion en Marketing Aplicado – Ano 10, 19-54.
Carroll, B. & Sileo, L. (2014). Online Travel Agencies: More Than a Distribution Channel. PhoCusWright White Paper.
Retrieved from http://www.phocuswright.com/Free-Travel-Research/Online-Travel-Agencies-More-Than-a- Distribution-Channel.
Christodoulidou, N., Brewer, P. & Countryman, C. C. (2007). Travel intermediaries and metasites: A comparison of customer perception. Information Technology and Tourism, 9, 227-243.
Christodoulidou, N., Brewer, P., Feinstein, A. H. & Bai, B. (2007). Electronic Channels of Distribution: Challenges and Solutions for Hotel Operators. Hospitality Review, 25(2), 92-100.
Christodoulidou, N., Conolly, D. J. & Brewer, P. (2010a). An examination of transactional relationship between online travel agencies, travel meta sites, and suppliers. International Journal of Contemporary Hospitality Management, 22(7), 1048-1062.
Christodoulidou, N., Conolly, D. J. & Brewer, P. (2010b). Travel meta-search: Opportunity or threat? Tourism Analysis, 14, 821-832.
Clemons, E. K., Hann, I-H. & Hitt, L. M. (2002). Price Dispersion and Diff erentiation in Online Travel: An empirical in- vestigation. Management Science, 48(4), 534-549.
Coletta, M. (2015). Metasearch: The Leaders, the Future and the Impact on Travel Distribution. Retrieved from http://
www.phocuswright.com/Travel-Research/Metasearch-The-Leaders-the-Future-and-the-Impact-on-Travel- Distribution.
Dorn, J., Hrastnik, P., Rainer, A. & Starzacher, P. (2008). Web Service based Meta-search for Accommodation. Journal of Information Technology and Tourism, 10(2), 147-159.
Dudás, G., Boros, L., Pál, V. & Pernyész, P. (2016a). Analysis of the lowest airfares considering the diff erent business models of airlines, the case of Budapest. Regional Statistics, 6(1), 119-138.
Dudás, G., Boros, L., Pál, V. & Pernyész, P. (2016b). Mapping cost distance using air traffi c data. Journal of Maps, 12(4), 695-700.
Etzioni, O., Tuchida, R., Knoblock, C. A. & Yates, A. (2003). To buy or not to buy: Mining airfare data to minimize ticket purchase price. Proceedings of the ninth ACM SIGKDD International Conference on Knowledge Discovery and Data Mining. Washington, DC. Retrieved from http://www.isi.edu/info-agents/papers/etzioni03-kdd.pdf.
Euromonitor International. (2014). The new online travel consumer. Webinar. Retrieved from http://www.etoa.org/
docs/default-source/presentations/2014-the-new-online-travel-consumer.pdf?sfvrsn=4.
Gazzoli, G., Kim, W. G. & Palakurthi, R. (2008). Online distribution strategies and competition: Are the global hotel companies getting it right? International Journal of Contemporary Hotel Management, 20(4), 375-387.
Granados, N., Gupta, A. & Kauff man, R. J. (2003). Orbitz, online travel agents and market structure changes in the presence of technology-driven market transparency. Working paper, MIS Research Centre, Carlson School of Management, University of Minnesota. Retrieved from http://misrc.umn.edu/workingpapers/fullpapers/2003/0326_070903.
pdf.
Higgins, M. (2010). Sites that do your fare digging. Retrieved from http://www.nytimes.com/2010/02/21/travel/21Prac.
html?_r=0.
Hungarian Central Statistical Offi ce (2015). Data of Budapest Liszt Ferenc International Airport. Retrieved from http://
statinfo.ksh.hu/Statinfo/themeSelector.jsp?page=2&szst=ODMJ.
iMacros (2016). Overview. Retrieved from http://imacros.net/overview.
Kim, D. J., Kim, W. G. & Han, J. S. (2007). A perceptual mapping of online travel agencies and preference attributes.
Tourism Management, 28(2), 591-603.
Kim, J., Bojanic, D. C. & Warnick, R. B. (2009). Price Bundling and Travel Product Pricing Practices Used by Online Chan- nels of Distribution. Journal of Travel Research, 47(4), 403-412.
Koo, B., Mantin, B. & O'Connor, P. (2011). Online distribution of airline tickets: Should airlines adopt a single or a multi- channel approach? Tourism Management, 32(1), 69-74.
133-260 Tourism 2017 02ENG.indd 201
133-260 Tourism 2017 02ENG.indd 201 3.7.2017. 14:30:373.7.2017. 14:30:37
Kracht, J. & Wang, Y. (2010). Examining the tourism distribution channel: evolution and transformation. International Journal of Contemporary Hospitality Management, 22(5), 736-757.
Law, R. & Chang, M. (2007). Online pricing practice of air tickets: The case of Hong Kong. In M. Sigala, L. Mich & J. Murphy (Eds.) Information and communication technologies in tourism 2007 (pp. 513-522). New York: Springer-Verlag.
Law, R. & Huang, T. (2006). How do travellers fi nd their travel and hotel websites? Asia Pacifi c Journal of Tourism Research, 11(3), 239-246.
Law, R. & Leung, R. (2000). A Study of Airlines' Online reservation Services on the Internet. Journal of Travel Research, 39, 202-2011.
Law, R., Chan, I. & Goh, C. (2007). Where to fi nd the lowest hotel room rates on the Internet? The case of Hong Kong.
International Journal of Contemporary Hospitality Management, 19(6), 495-506.
Law, R., Denizci Guillet, B. & Leung, R. (2010). An analysis of the lowest fares and shortest durations for air-tickets in travel agency websites. Journal of Travel and Tourism Marketing, 27(6), 635-644.
Law, R., Leung, R. & Buhalis, D. (2009). Information technology applications in hospitality and tourism: a review of publications from 2005-2007. Journal of Travel and Tourism Marketing, 26(5-6), 599-623.
Law, R., Leung, R., Denizci Guillet, B. & Lee, H. A. (2011). Temporal changes of airfares toward fi xed departure date.
Journal of Travel and Tourism Marketing, 28(6), 615-628.
Law, R., Leung, R., Lo, A., Leung, D. & Fong, L. H. N. (2015). Distribution channel in hospitality and tourism – Revisiting disintermediation from the perspectives of hotels and travel agencies. International Journal of Contemporary Hospitality Management, 27(3), 431-452.
Lee, H., Denizci Guillet, B. & Law, R. (2013). An examination of the Relationship between Online Travel Agents and Hotels: A Case Study of Choice Hotels International and Expedia.com. Cornell Hospitality Quarterly, 54(1), 95-107.
Mantin, B. & Koo, B. (2010). Weekend eff ect in airfare pricing. Journal of Air Transport Management, 16(1), 36-44.
MarketLine (2014). Company profi le Orbitz worldwide, Inc. Retrieved from http://www.marketline.com/.
McCartan, M. (2014). OTA v/s Meta Search: The Battle Gets Bloodier. Retrieved from http://www.hospitalitynet.org/
news/4066748.html.
McIvor, R., O'Reilly, D. & Ponsonby, S. (2003). The impact of Internet technologies on the airline industry: current strategies and future developments. Strategic Change, 12(1), 31-47.
Morosan, C. & Jeong, M. (2008). Users' perceptions of two types of hotel reservation Web sites. International Journal of Hospitality Management, 27(2), 284-292.
O'Connor, P. & Murphy, J. (2008). Hotel yield management practices across multiple electronic distribution channels.
Information Technology & Tourism, 10(2), 161-172.
Olenski, S. (2015). Are OTAs really killing brick and mortar travel agencies? Retrieved from http://www.forbes.com/sites/
steveolenski/2015/04/27/are-otas-really-killing-brick-and-mortar-travel-agencies/.
Park, Y. & Gretzel, U. (2006). Evaluation of emerging technologies in tourism: The case of travel search engines. In M.
Hitz, M. Sigala & J. Murphy (Eds.) Information and communication technologies in tourism 2006 (pp. 371-382).
Vienna, Austria: Springer-Verlag.
PhoCusWright (2011). European Online Travel Agencies – Navigating New Challenges. PhoCusWright Inc. Retrieved from http://www.sabretravelnetwork.com/images/uploads/collateral/TNEMEA-11-14712_-_Online_White_
Paper_LR.pdf.
Pötzl, J. (2000). Issues in direct channel distribution: a comparison of selling via the Internet in the airline business and the fast-moving consumer goods industry. Electronic Markets, 10(3), 700-712.
Reals, K. & Hadwick, A. (2015). The Future of Metasearch 2015. EyeforTravel Ltd. Retrieved from http://www.eyefortravel.
com/sites/default/fi les/1570_eft_metasearch_report_v6.pdf.
Sileo, L. (2015). Can European OTAs Survive the Big Squeeze? Retrieved from http://www.phocuswright.com/Travel- Research/Research-Updates/2015/Can-European-OTAs-Survive-the-Big-Squeeze-.
Tse, A. C. B. & Yim, F. (2001). Factors aff ecting the choice of channels: Online vs. conventional. Journal of International Consumer Marketing, 14(2/3), 137-151.
TOURISM
Preliminary communication203
Gábor Dudás / Lajos Boros / György Vida Vol. 65/ No. 2/ 2017/ 187 - 203
Tse, A. C. B. (2003). Disintermediation of travel agents in the hotel industry. International Journal of Hospitality Man- agement, 22(4), 453-460.
Tso, A. & Law, R. (2005). Analysing the online pricing practices of hotels in Hong Kong. International Journal of Hos- pitality Management, 24(2), 301-307.
Submitted: 21/09/2016 Accepted: 12/04/2017
133-260 Tourism 2017 02ENG.indd 203
133-260 Tourism 2017 02ENG.indd 203 3.7.2017. 14:30:373.7.2017. 14:30:37