Examination of financial literacy and consciousness among Hungarian tertiary
education students Botond Kálmán
Supervisor:
László Tóth
Dissertation submitted to International Business School for the partial fulfilment of the requirement for the degree of MASTER OF SCIENCE IN FINANCIAL MANAGEMENT
September 2020
2
DECLARATION
Word length: 16,124 words
3
ACKNOWLEDGEMENTS
I would like to thank my supervisor Prof. László Tóth for his support and guidance. He gave me thoughtful comments and recommendations on this dissertation. I am extremely grateful for the personal support in my academic endeavours. I would like to thank for the stimulating questions on theory, methodology and practice. The meetings and conversations were vital in inspiring me to form my dissertation in its current form.
4
ABSTRACT
Thousands of lives changed permanently after the financial crisis of 2008. Insufficient awareness consequently led to the financial ruin of whole families. Hence, the importance of financial education has been confirmed. University students entering the labour market after graduation are crucial as they must take autonomous decisions regarding their financial affairs. Since several years have passed since the last comprehensive appraisal of Hungarian tertiary students, updating of knowledge has become advisable so as to involve new services in the research. I have therefore chosen to assess financial knowledge and financial awareness amid Hungarian university students. The resulting expected practicability is multipurpose: it could promote the design and development of financial education methods and improve the bank sector through enhancing the introduction of such constructions and services that would adapt to the demands of college students.
The objective of my research was to determine whether teaching financial knowledge resulted in higher financial intelligence and financial consciousness, viz., how much practical benefit financial education had. Questionnaire survey was applied for achieving this target;
the questions in paper form were delivered to the potential respondents using the snowball sampling method. My starting hypothesis was that financial knowledge and consciousness of economics students were higher vis-à-vis students from other programmes. Results of my research verified my assumption, even broadening previous knowledge, as students of legal training exhibited similar performance to students of economic programmes. The results also demonstrated that financial consciousness of university students working at the same time as studying was higher than of their counterparts out of work. This represents the importance of the effects of practical experience.
Inferences deducible from the results are, as yet, of only limited use. Precondition of
general applicability is rerunning the research with a larger sample and extending it to
college students of other countries.
5
CONTENTS
chapter page
DECLARATION
ii
ACKNOWLEDGEMENTS
iii
ABSTRACT
iv
LIST OF TABLES
vi
LIST OF FIGURES
x
CHAPTER 1 INTRODUCTION
1
1.1. ACADEMIC BACKGROUND
3
1.1.1. Research topic, aims and rationale
3
1.1.2. Key academic ideas
3
1.2. RESEARCH GAP
4
1.3. RESEARCH QUESTION, HYPOTHESIS AND OBJECTIVES
5
CHAPTER 2 LITERATURE REVIEW
7
CHAPTER 3 RESEARCH METHODS
14
3.1 RESEARCH STRATEGY
14
3.2 POPULATION, SAMPLE AND SAMPLING; METHODS OF COLLECTING
DATA
15
3.3 METHODS OF ANALYSING DATA
16
3.4 DATA QUALITY ISSUES IN THE RESEARCH
17
3.5. DATA ACCESS
18
3.6 RESEARCH ETHICS
20
CHAPTER 4 RESULTS
22
CHAPTER 5 DISCUSSION
71
CHAPTER 6 CONCLUSION
74
REFERENCES
76
APPENDIX
86
QUESTIONNAIRE
86
6
LIST OF TABLES
table page
TABLE I DATA ANALYSIS METHODS 19
TABLE II CORRELATION OF AGE, SATISFACTION WITH PRIVATE LIFE AND STRENGTH OF COUPLE RELATIONSHIP WITH FINANCIAL INTELLIGENCE AND
FINANCIAL CONSCIOUSNESS 25
TABLE III COMPARISON OF FINANCIAL INTELLIGENCE AND CONSCIOUSNESS
BY GENDER 25
TABLE IV DIFFERENCES IN FINANCIAL INTELLIGENCE BY TYPE OF
SETTLEMENT AND COMPARATIVE STATISTICS THEREOF 27 TABLE V POST HOC TEST RESULTS OF FINANCIAL INTELLIGENCE BY TYPE OF
SETTLEMENT 28
TABLE VI DIFFERENCES IN FINANCIAL CONSCIOUSNESS BY THE TYPE OF RESIDENCE AND COMPARABLE STATISTICS THEREOF 29 TABLE VII POST HOC TEST RESULTS OF FINANCIAL CONSCIOUSNESS BY THE
TYPE OF SETTLEMENT 29
TABLE VIII COMPARISON OF FINANCIAL INTELLIGENCE AND CONSCIOUSNESS
ACROSS DIFFERENT UNIVERSITIES 31
TABLE IX POST HOC TEST RESULTS OF FINANCIAL INTELLIGENCE BY
FINANCIAL INTELLIGENCE 32
TABLE X POST HOC TEST RESULTS OF FINANCIAL CONSCIOUSNESS BY
FACULTY 33
TABLE XI COMPARISON OF FINANCIAL INTELLIGENCE AND FINANCIAL
CONSCIOUSNESS BY FIELD OF STUDY 34
7 TABLE XII POST HOC TEST RESULTS OF COMPARISON OF FINANCIAL
INTELLIGENCE AND FINANCIAL CONSCIOUSNESS BY FIELDS OF STUDY 36 TABLE XIII COMPARISON OF FINANCIAL INTELLIGENCE AND FINANCIAL
CONSCIOUSNESS CONCERNING THE TRAINING SCHEDULE (*TEST STATISTICS WERE CHOSEN DEPENDING ON THE RESULTS OF LEVENE'S TESTS.) 42 TABLE XIV NORMALITY HYPOTHESIS TESTING PER INDIVIDUAL MAJOR
AMONG PART-TIME STUDENTS 43
TABLE XV COMPARISON OF FINANCIAL INTELLIGENCE AND FINANCIAL
CONSCIOUSNESS PER INDIVIDUAL MAJOR AMID FULL-TIME STUDENTS 44 TABLE XVI COMPARISON OF FINANCIAL INTELLIGENCE AND FINANCIAL
CONSCIOUSNESS PER INDIVIDUAL MAJOR AMONG FULL-TIME STUDENTS 44 TABLE XVII COMPARISON OF FINANCIAL INTELLIGENCE AND FINANCIAL CONSCIOUSNESS BY MAJOR FIELD OF STUDY AMONG PART-TIME STUDENTS45 TABLE XVIII NORMALITY HYPOTHESIS TESTING OF FINANCIAL INTELLIGENCE
AND CONSCIOUSNESS BASED ON OCCUPATION 46
TABLE XIX DEVELOPMENT OF FINANCIAL INTELLIGENCE ACROSS
OCCUPATIONS 47
TABLE XX POST HOC TESTS OF THE AVERAGES FINANCIAL INTELLIGENCE BY
OCCUPATION 47
TABLE XXI DEVELOPMENT OF FINANCIAL CONSCIOUSNESS BY OCCUPATION 48 TABLE XXII POST HOC TESTS OF AVERAGES OF FINANCIAL CONSCIOUSNESS
BY OCCUPATION 49
TABLE XXIII NORMALITY TESTS OF FINANCIAL INTELLIGENCE AND
FINANCIAL CONSCIOUSNESS BY POSITION 49
8 TABLE XXIV COMPARISON OF MEDIANS OF FINANCIAL INTELLIGENCE AND
FINANCIAL CONSCIOUSNESS 50
TABLE XXV POST HOC TESTS OF THE AVERAGES OF FINANCIAL
INTELLIGENCE BY POSITION (WITH BONFERRONI CORRECTION) 51 TABLE XXVI POST HOC TESTS OF AVERAGES OF FINANCIAL CONSCIOUSNESS
BASED ON POSITION 51
TABLE XXVII DISTRIBUTION OF THE FOUR CLUSTERS AMONG STUDENTS OF
VARIOUS FACULTIES 54
TABLE XXVIII DISTRIBUTION OF THE FOUR CLUSTERS AMONG FEMALE
STUDENTS OF DIFFERENT FACULTIES 55
TABLE XXIX DISTRIBUTION OF THE FOUR CLUSTERS AMONG MALE STUDENTS
OF CERTAIN FACULTIES 56
TABLE XXX DISTRIBUTION OF THE FOUR CLUSTERS AMID FEMALE AND MALE
STUDENTS 57
TABLE XXXI DISTRIBUTION OF THE FOUR CLUSTES ACROSS TYPES OF
RESIDENCE 58
TABLE XXXII BREAKDOWN OF THE FOUR CLUSTERS BY OCCUPATION 59 TABLE XXXIII NORMALITY TEST OF AGE IN THE FOUR CLUSTERS 59 TABLE XXXIV COMPARISON OF AGE IN THE FOUR CLUSTERS 59 TABLE XXXV POST HOC TESTS OF THE COMPARISON OF AGE ACROSS THE
FOUR CLUSTERS 60
TABLE XXXVI QUESTIONS FROM THE QUESTIONNAIRE, SELECTED FOR
DECISION TREE ANALYSIS 61
TABLE XXXVII THE DISTRIBUTION OF ANSWERS GIVEN TO THE QUESTTION
“DO YOU HAVE A DEBIT CARD?” BASED ON DEMOGRAPHIC VARIABLES 62
9 TABLE XXXVIII THE DISTRIBUTION OF ANSWERS GIVEN TO THE QUESTTION
“DO YOU HAVE A CREDIT CARD?” BASED ON DEMOGRAPHIC VARIABLES, FINANCIAL AWARENESS AND FINANCIAL INTELLIGENCE 63 TABLE XXXIX THE DISTRIBUTION OF ANSWERS GIVEN TO THE QUESTTION
“DO YOU HAVE LIFE INSURANCE?” BASED ON DEMOGRAPHIC VARIABLES
AND FINANCIAL INTELLIGENCE 65
TABLE XL THE DISTRIBUTION OF ANSWERS GIVEN TO THE QUESTTION “HOW OFTEN DO YOU USE NETBANK” BASED ON FINANCIAL AWARENESS AND
FINANCIAL INTELLIGENCE 67
TABLE XLI THE DISTRIBUTION OF ANSWERS GIVEN TO THE QUESTTION “HOW OFTEN DO YOU USE NETBANK” BASED ON FINANCIAL AWARENESS AND
FINANCIAL INTELLIGENCE 67
TABLE XLIII THE DISTRIBUTION OF ANSWERS GIVEN TO THE QUESTTION “DO YOU USE MOBILE BANKING” BASED ON DEMOGRAPHIC VARIABLES,
FINANCIAL AWARENESS AND FINANCIAL INTELLIGENCE 69 TABLE XLIV COMPONENTS OF FINANCIAL INTELLIGENCE INDEX AND
CORRECT ANSWERS THEREOF 92
TABLE XLV COMPONENTS OF FINANCIAL CONSCIOUSNESS INDEX AND
CORRECT ANSWERS THEREOF 92
10
LIST OF FIGURES
figure page
FIGURE 1 DISTRIBUTION OF FINANCIAL INTELLIGENCE AND FINANCIAL
CONSCIOUSNESS IN THE SAMPLE 23
FIGURE 2 DISTRIBUTION OF GENDERS BY AGE 23
FIGURE 3 DISTRIBUTION OF SATISFACTION WITH PRIVATE LIFE IN THE
SAMPLE 24
FIGURE 4 DISTRIBUTION OF THE STRENGTH OF COUPLE RELATIONSHIP IN THE
SAMPLE 24
FIGURE 5 DISTRIBUTION OF GENDERS IN THE SAMPLE 25 FIGURE 6 DISTRIBUTION OF FINANCIAL INTELLIGENCE BY GENDER 26 FIGURE 7 DISTRIBUTION OF FINANCIAL CONSCIOUSNESS BY GENDER 26 FIGURE 8 DISTRIBUTION OF THE TYPE OF SETTLEMENT IN THE SAMPLE 27 FIGURE 9 DIFFERENCES IN FINANCIAL INTELLIGENCE ACCORDING TO THE
TYPE OF SETTLEMENT 28
FIGURE 10 DIFFERENCES IN FINANCIAL CONSCIOUSNESS BY THE TYPE OF
RESIDENCE 29
FIGURE 11 DISTRIBUTION OF FACULTY IN THE SAMPLE 30 FIGURE 12 DIFFERENCES IN FINANCIAL INTELLIGENCE ACROSS FACULTIES 32 FIGURE 13 DIFFERENCES IN FINANCIAL CONSCIOUSNESS ACROSS FACULTIES
33 FIGURE 14 DISTRIBUTION OF FIELDS OF STUDY IN THE SAMPLE 34 FIGURE 15 DISTRIBUTION OF FINANCIAL INTELLIGENCE ACROSS FIELDS OF
STUDY 35
11 FIGURE 16 DEVELOPMENT OF FINANCIAL CONSCIOUSNESS ACROSS FIELDS OF
STUDY 35
FIGURE 17 DIFFERENCES IN FINANCIAL INTELLIGENCE BY FIELD OF STUDY 36 FIGURE 18 DIFFERENCES IN FINANCIAL CONSCIOUSNESS BY FIELD OF STUDY
37 FIGURE 19 RATIO OF FINANCIAL SERVICES ACROSS FIELDS OF STUDY 38 FIGURE 20 FREQUENCY OF USE OF MOBILE BANKING ACCORDING TO THE
FIELD OF STUDY 38
FIGURE 21 FREQUENCY OF USING NETBANK BY FIELD OF STUDY 39 FIGURE 22 FREQUENCY OF ONLINE SHOPPING ACROSS FIELD OF STUDY 39 FIGURE 23 BREAKDOWN OF TRAINING SCHEDULE IN THE SAMPLE 40 FIGURE 24 DISTRIBUTION OF MODE OF STUDY IN THE SAMPLE AND IN
HUNGARY (IN HEAD COUNT) 41
FIGURE 25 BREAKDOWN BY MODE OF STUDY IN THE SAMPLE AND IN
HUNGARY (IN PERCENTAGE). 41
FIGURE 26 DEVELOPMENT OF FINANCIAL INTELLIGENCE BASED ON TRAINING
SCHEDULE 42
FIGURE 27 EVOLUTION OF FINANCIAL CONSCIOUSNESS DEPENDING ON
TRAINING SCHEDULE 43
FIGURE 28 DISSIMILARITIES IN FINANCIAL INTELLIGENCE ACCORDING TO THE
FIELD OF STUDY 45
FIGURE 29 DIFFERENCES IN FINANCIAL CONSCIOUSNESS IN DIFFERENT
TRAINING SCHEDULES, ACCORDING TO FIELDS OF STUDY 45
FIGURE 30 BREAKDOWN OF OCCUPATIONS IN THE SAMPLE 46
FIGURE 31 DEVELOPMENT OF FINANCIAL INTELLIGENCE IN JOB LOTS 47
12 FIGURE 32 DEVELOPMENT OF FINANCIAL CONSCIOUSNESS BY OCCUPATION 48 FIGURE 33 DISTRIBUTION OF THE SAMPLE BASED ON POSITION 49 FIGURE 34 DEVELOPMENT OF FINANCIAL INTELLIGENCE BY POSITION 51 FIGURE 35 DEVELOPMENT OF FINANCIAL CONSCIOUSNESS ACCORDING TO
POSITION 52
FIGURE 36 RELATIVE VALUES OF FINANCIAL INTELLIGENCE AND
CONSCIOUSNESS IN THE FOUR CLUSTERS 53
FIGURE 37 DISTRIBUTION OF THE FOUR CLUSTERS AMONG STUDENTS OF
DIFFERENT FACULTIES 54
FIGURE 38 DISTRIBUTION OF THE FOUR CLUSTERS AMONG FEMALE
STUDENTS OF THE VARIOUS FACULTIES 55
FIGURE 39 DISTRIBUTION OF THE FOUR CLUSTERS AMONG MALE STUDENTS
OF DIFFERENT FACULTIES 56
FIGURE 40 DISTRIBUTION OF THE FOUR CLUSTERS AMONG FEMALE AND
MALE STUDENTS. 57
FIGURE 41 DISTRIBUTION OF THE FOUR CLUSTERS ACCORDING TO TYPE OF
SETTLEMENT 58
FIGURE 42 DISTRIBUTION OF THE FOUR CLUSTERS BY OCCUPATION 59
FIGURE 43 COMPARISON OF AGE IN THE FOUR CLUSTERS 61
1
CHAPTER 1 INTRODUCTION
‘Since the mid-1990s, an increasing number of public and private sector organisations have begun helping Americans enhance their financial preparedness for life events’, wrote Vitt et al. (2001, p. xi). In the world today, the ability to manage personal finances is becoming ever more important.
People must plan long-term retirement investments and education for children. We must also agree on short-stay savings and holiday loans, a down payment for a home, a car loan, and other large-scale products. Several economic decisions require basic information about financial principles, such as interest rates and inflation (Chen and Volpe, 1998). Many people, however, lack this kind of knowledge. The extent of this shortcoming has been systematically investigated. There is growing evidence of better economic results for those with higher financial literacy as well as better financial decision-making (Lusardi and Mitchell, 2014).
With rising educational costs, there is an escalating number of students being obliged to select financially demanding alternatives to tackle their tuition. This issue has been ongoing for a time, as Lions examined this area in the first decade of the new millennium in Midwest Colleges of Australian Universities (Lions, 2007; 2008). He described more alternative ways to solve this question, like educational loans, private borrowing, home equity financing, and even credit card debt. This choice depends partly on the financial knowledge and awareness based on previously acquired learning experiences and skills, and also on behavioural patterns learned in family and in wider social environment. Similarly, Serido et al. (2015) found that the ways in which financial education and literacy influence financial attitude and behaviour in the social area of finances would seem worth being remembered when studying how university students made the sorts of financial decisions that affected their future.
2
The term financial literacy is often used as a synonym for economic or financial education.Such systems, though, are simply conceptually different since financial literacy is broader than financial knowledge. Financial literacy is more than simply knowledge (Potrich, Vieira and Mendes-Da- Silva, 2016). Vitt et al. (2001, p. 2) described it as the ability of a person to understand, interpret, control, and communicate financial issues. The sections include life skills and financial intellectual skills; thus, it also includes practical use of expertise (Kezar and Yang, 2010). In other words, knowledge is a focal point of financial education, while financial literacy involves, in addition to knowledge, individual behaviour and financial attitudes (OECD, 2012). It is prudent to initiate the education of financial knowledge as soon as possible; nevertheless, based on domestic research results (Pintye and Kiss, 2017, p. 198), ‘the financial and economic education of young people is worth starting even at university level, but in any case it would be advisable to teach it during the elementary school years, as occurs in the world’s developed countries’. It is substantial for the establishment of the compulsory study material to know the level of students’ financial knowledge and the extent of their practical expertise.
University students will enter the labour market after graduation. They will be responsible for managing their own finances. Hence, they are the ideal recipients of financial education and flawless participants for research. The target of the research is to assess whether financial knowledge of economic university students differs from the one of students attending various other majors. The research also concerns the answer to the question of what factors determine or influence the theoretic or practical knowledge of students on this field. The practical benefit and rationale of this research is that teaching financial knowledge may become more personalised by exploiting its results, thus better serving the needs of college students.
3 1.1. ACADEMIC BACKGROUND
1.1.1. Research topic, aims and rationale
This research aims to examine the degree of financial literacy and education amid college students studying economic and noneconomic majors. Both foreign (Willis, 2011; 2013) and national (Németh, 2015) experts have raised serious doubts about the Hungarian and international education of financial lore, too. Nonetheless, gauging and elaborating financial literacy have been increasingly accentuated over the past years (Csorba, 2020). It is, indeed, attestable that specific measures, norms, and attitudes of individuals, added to their rapprochement with cultural peculiarities of society and community diverge in accordance with the accretion of intelligence, i.e., financial literacy (Williamson, 2000). The current research desires to contribute to the constitution of an explicit data base or the development of such financial curricula and teaching methods that assist in the aforementioned personalised education.
1.1.2. Key academic ideas
This chapter accentuates how the proposed research relates to previous ones and uses literature sources to identify the key academic ideas about the topic. Over the past few years, economic knowledge has been given due weight from different stages, particularly regarding policy makers. Determinant factors of financial decisions may be compartmentalised into two categories:
financial knowledge and attitudes, and demographic characteristics (Norvilitis et al., 2006). According to literature data, demographic traits (e.g., job situation and gender) correlate with financial intelligence, consciousness, attitude, and behaviour of students (Borden et al., 2007). Professional status can sway financial decisions (Xiao, Sorhaindo and Garman, 2006). Chen and Volpe (1998) observed that work experiences of students might enhance their pecuniary knowledge. Gender differences of financial literacy are examined by Harrington and Smith (2017), too, but they focus more on the effects of personal financial education. It is considered even if some authors propose a completely different approach for tackling the problem. By way of illustration, study of Willis (2008)
4
refutes the necessity of financial schooling already in its title (Against Financial Literacy Education). It suggests instead the completion of a reliable expert network that is accessible to all. Notwithstanding, in line with the summary so far, most authors support the development of financial education.1.2. RESEARCH GAP
Although a considerable body of research is available, there are still some research gaps in the corresponding literature. The optional financial literacy assessment of PISA in 2012 was conducted in a total of 18 countries and economies but Hungary did not feature among them. Available domestic studies either conducted a research using a sample from a single university (Németh et al., 2013) or scrutinised a different fundamental question (Pintye and Kiss, 2016, 2017). A further study analysed only actually enrolled college students (Csiszárik-Kocsir, Varga and Fodor, 2016, Csiszárik-Kocsir and Garai-Fodor 2018). Studies focussing solely on one factor out of the complex system – i.e. credit card usage, gender, or location – is an additional drawback. This gap is finally filled by the present study, which introduces the results of a questionnaire survey conducted at several Hungarian universities.
Within this framework I am focussing in my research on financial literacy and activities not only among freshly enrolled students but also among a wide range of university participants attending various academic years.
Evidence was sought for dissimilarities between students learning economics and those studying other majors, in a scientific area that had previously been underexplored in the literature, scilicet, financial literacy and awareness of Hungarian university scholars. Among students in tertiary education, the research of Németh et al. (2013) was one of those that investigated the target system and income situation of students by means of the indicators produced by the researchers. The scrutiny was conducted based on demographic characteristics, the nature of training, and the number of semesters spent in training, while economic students being compared with students of other fields.
New financial services, also entering Hungary since then, and the dissemination of their use mean significant changes in the lives of college students. Primarily the broadening of credit card use and
5
options relating to online payment, and also the emergence of online payment facilities represented a major change vis-à-vis the previous years. The domestic enlargement of the market of the most modern (Fintech) financial services has started, e.g. Revolut or TransferWise. The abovementioned financial services have already been available abroad for a longer period; wherefore, there are a few related results, e.g. the scrutiny of Lions (2008). Their main benefit is universal accessibility and flexible operation; their disadvantage is that deposits in such form are not guaranteed by the National Deposit Insurance Fund of Hungary. Out of the most recent researches, the study of Rafinda and Gal (2020) partly derives from Hungarian authors; notwithstanding, it aimed at Indonesian college students. They have resolved to demonstrate a significant difference between financial literacy of economic and noneconomic students. The assessment of financial knowledge and consciousness of domestic university students is thereupon already topical, inasmuch as previous Hungarian surveys either observe several years (Németh et al., 2013), focus on sub-topics (Pintye and Kiss, 2016; 2017), or did not survey Hungarian students (Rafinda and Gal, 2020). Neither national, nor foreign examinations extend to whether there is causal relationship between financial behaviour and studies pursued in an economic field; rather, every author focusses on the establishment of any correlation. This is the research gap I decided to examine. The correlation to demographic characteristics highlights positive effects associated with course completion, in accordance with the results of Gerrans and Heaney (2016). This will hopefully provide insights about the way in which university students reconcile multiple influences when managing their personal finances.1.3. RESEARCH QUESTION, HYPOTHESIS AND OBJECTIVES
This paper attempts to answer the following research question: To what extent does economic field of study chosen influence financial literacy, activities and attitudes of Hungarian university students? Activity is defined in this study as the use of conventional and new financial products and methods. Having reviewed the literature on this topic, my hypothesis could be concluded
6
as follows: Hungarian tertiary education students of economics performed better in terms of financial knowledge and consciousness than their counterparts attending different study programmes.The following objectives have been defined to guide the course of this research:
1. To conduct a questionnaire-based analysis from multiple viewpoints by catechising tertiary education students attending different faculties of a few Hungarian universities and, in addition, to delineate the prevailing situation in 2019.
2. To explore, as far as possible, correspondence and disparity between students at colleges or faculties of economic and noneconomic fields.
3. To examine the level of knowledge and activities related to financial matters, based on demographic variables (i.e., age, gender, place of residence, and marital status) and by means of classification according to institution and major.
7
CHAPTER 2 LITERATURE REVIEW
The literature of this field of study dates back to the 1960s (Bakken, 1966). A broad range of scientific literature about financial knowledge has been available since 2000. The Standard & Poor's Ratings Services Global Financial Literacy Survey is one of the latest aggregate data sources about financial literacy obtained. Such information is provided in a broad range of countries (Klapper, Lusardi and Oudheusden, 2015). It has been more important since the 2008 financial crisis than before. The survey analysed international financial knowledge and attitudes. North America, Western Europe, and Australia have the highest literacy level. The EU is divided with more literacy in the north and less in the south. One of the basic intercultural studies on the human factor is from Hofstede, Hofstede and Minkov (2010). In a number of studies, these intercultural differences in finance are analysed (Agarwal et al., 2015; Agarwalla et al., 2015; Grohmann, Kouwenberg and Menkhoff, 2015; Mimura et al., 2015;
Jorgensen et al., 2016; Yao and Meng, 2018; Nicolini, 2019; Nicolini and Haupt 2019). As Danes and Hira also described (1987), financial literacy rates vary considerably in terms of such characteristics as gender, job, income, age, culture, and personal experience. The average gender gap in financial literacy is five percentage points according to Klapper, Lusardi, and Oudheusden (2015). Financial literacy rates initially increase but subsequently diminish with age (viz., elderly people are less financially educated than middle-aged adults). People can understand financial concepts better when they face them in their everyday lives. This has been verified by Lusardi, Mitchell, and Curto (2010), who agreed that some of the literacy variables, at least partly, seemed to have been influenced by today's adult experiences. Financial literacy skills are important to people who use payments, savings, loans, and other financial products. However, without an account, these skills are even lower among adults. Financial literacy has a large influence and is also significantly enhanced by educational achievement, which is strongly linked to mathematical skills, age and income.
8
Financial literacy in higher education is also a regular subject of publications. Several years preceding the latest financial crisis, Danes and Hira (1987) explored gaps in the level of college students’ money management expertise. Sex, marital status, and age of students were found to be important to explain differences in knowledge in several areas. Chen and Volpe (1998) explored students' personal financial literacy, too. Their results show that around 53% of questions are answered correctly and no average rating for any area is above 65%. Non-business graduates, women, low-class students, people under the age of 30 with little work experience have lower skill rates. They tend to make wrong choices. It has been concluded that university students are not aware of personal finance and have limited capacity to take informed decisions. Many other variables are related to the financial literacy of a person. These factors include socio-demographic variables that have to do with education, age or income. Poynton, Lapan and Marcotte (2015) examined the financial plans of college students succeeding their secondary education as an obstacle to decision making and progress in education and employment. The new generation of young experts need to have detailed knowledge before they successfully start. There can be a variety of financial attitudes that some young adults learn in order to plan and invest responsibly, while others spend carelessly without considering the consequences. Students who spend more than they can afford will become burdened by unmanageable debt with poor credit scores and, in turn, will be discourage from making critical financial decisions later in life. (Jorgensen et al., 2016) Expenditure overruns are associated with lower academic quality and higher graduation rates (Shaffer, 2014). It can, however, lead to significant negative impacts on other areas of life, such as psychological, physical, and social well-being (Berger et al., 2015).Specific variables are used for measuring financial literacy (Behrman et al., 2012). Childhood experience contributes to financial socialisation. Parents and their education, schools, and workplace are the main channels that have the greatest impact on financial knowledge (Shim et al., 2009).
Mimura et al. (2015) provide parents with personal finance textbooks to teach financial skills to their children, as those young adults that have acquired personal financial data from their parents gain
9
greater financial experience with higher financial practice scores. In a survey study, Grohmann, Kouwenberg, and Menkhoff (2015) investigated the origins of childhood financial literacy. They show two channels through which childhood experiences explain the degree of financial literacy for adults:parental financial socialisation and the schooling channel. Both family and education have positive impact on adulthood financial literacy. Shim et al. (2009) find that parental teaching has a stronger impact on first-year students’ financial knowledge than on high school financial education and early experience with money. Jorgensen and Savla (2010), as later Masuo and Cheang (2017), found that parents played a key role in the financial socialisation of their children. Another finding came from Albeerdy and Gharleghi (2015). Their findings show that training has the greatest influence on students' financial knowledge. School education in economics seems to be a clear choice to increase financial literacy and found good financial behaviour. Difference between education and financial education is delineated by Vitt et al. (2001, p. xiii):
General education determines occupation and income, which, in turn, influence place of residence, social contacts, consumer choices, and activities. Financial literacy education shapes the life course in other, extended ways by enhancing access to investment income, asset accumulation, and asset protection.
Grohmann, Kouwenberg and Menkhoff (2015) admitted that education (in the form of school economy and quality education) had indirect effects on financial literacy by increasing numeracy, which was a fundamental competency supporting financial literacy. In addition, financial literacy and school-related factors directly affect financial actions as well. This implies that family and schooling factors function through complementary channels.
Urban et al. (2018) and Frisancho (2019) also prefer school education. They analysed the overall financial management practices of college students through a multistate research project.
Their findings suggest that some university students are financially at risk and therefore, on-campus financial education is still required. They recommend that college campuses may want to include
10
personal financial or financial lifestyle courses as a requirement for general education. The course would include the basics of financial management that every new college student needs to know. An early good example is the NatWest (Banking) Group case from 1994. It set up a charitable fund to make a major contribution to the society in which it operated. One of its first ventures consisted of exploring financial literacy and examining how a secondary school curriculum might be tailored to the educational programme (Schagen and Lines, 1996). In the early 2000s, 38 US countries acknowledged the need for financial literacy throughout their classroom and integrated their state education programmes into their financial requirements. Batty, Collins and Odders-White (2015) argued in their study that basic financial education also exerted influence in elementary schools. In addition, personal finance is a requirement for high school graduations in US countries. The financial education course designed for high schools helps improve general financial literacy, but adult courses are created for solving actual financial problems (Walstad, Rebeck and MacDonald, 2010).We really need to be financially capable in order to increase financial security. Despite basic financial skills and understanding, citizens will not be adequately educated or prepared to manage their financial benefits for the future. Unfortunately, people with poor financial capacity will face serious problems, poor budgeting, high debt rates, high levels of stress, and anxiety. (Adams, Meyers and Beidas, 2016). Beal and Delpachitra (2003) have been investigating financial literacy among Australian university students. The principal reason for their work was the high visibility of signs of insufficient personal financial literacy, inter alia growing levels of debt with the overuse of credit cards, using personal loans for consumption, and psycho-physical symptoms, the latter one being also mentioned by Berger et al. (2015), and Adams, Meyers and Beidas (2016). In the United Kingdom at the beginning of the 1990s, many, including Mannion (1992), warned of dramatic increases in the level of personal debt as well. Beal and Delpacitra (2003) examined a large cross-section of students in a regional Australian university that received significant external student registration. The scope of targeted students consisted of freshmen in the faculty of business and other faculties or disciplines.
The research showed that financial literacy was not very high, and it was unquestionable that students
11
studying business even in the first year of their studies had scored better than the average of other students.Ramudzuli and Muzindutsi (2015) analysed financial risk management practices of South African university students. Their results indicated that some university students faced financial instability. This risk decreased in correlation with the extent of financial knowledge and additionally, demographic variables, viz., gender, religion and monthly expenditure correlated with financial risk tolerance. Therefore, university monetary training courses were in need in the following period, too.
They suggested that college campuses might intend to involve specific financial courses as a requirement for education in general. According to numerous writers, teaching basic financial skills is already necessary in secondary school (Belás et al., 2016; Amagir et al., 2017; Brühl, 2019). In countries where fifteen-year-old students performed very well under the 2012 OECD Programme of International Student Assessment (PISA) math test, overall comprehension of financial concepts is likely to be high, according to Klapper, Lusardi and Oudheusden (2015). PISA is a global assessment performed in every three years, measuring the skills and knowledge of fifteen-year-olds in mathematics, reading, and science. The first optional financial literacy assessment, developed by experts, such as stakeholders, regulators, and bank experts, was launched in 2012 by PISA. It was the first major international study to assess financial literacy of young people. The best result was achieved by students from Shanghai (Lusardi, 2015). Csiszárik-Kocsir and Garai-Fodor (2018) conducted a research in Hungarian universities, analysing the significance of teaching financial knowledge. The students participating in the survey considered this as an option to gain preparation and expertise for founding their future life. Segmenting their sample on a residence basis, the researchers experienced a significant deviation on the field of preferences. Studying financial fundamentals means primarily consciousness and possibility for urban students, but prosperity and reasonable returns are also among their key expectations, as opposed to students living in the countryside.
12
Although early literature has established the relation between years of education and financial literacy (Luzardi and Mitchell, 2007), little attention has been given to the effects of the quality and content of education on financial literacy. The personality, competence, and expertise of the teacher are not, however, auxiliary variables. Deng et al. (2017) study this field of research. Their study found that financial literacy of teachers and the efficiency of education were correlated. They also found that there was no significant difference between elementary and secondary school financial teachers with various educational experience in the conveyed factual knowledge or the quality of education.Looking at the trend in the use of credit cards by Chinese college students, Yao and Meng (2018) concluded that China's full financial reliance on parents had had a significant impact on students’ financial behaviour and that only a small number of students earned their money. 57% of U.S. university students have and use one or more credit cards (SallieMae, 2019). Although the number of students in 2019 was the same as in 2016, the average balance for credit cards in the 2019 programme was $100 higher than in 2016. Debit cards are more popular than credit cards, namely, 85 percent of students choose this payment method. The most common monetary form is still cash, followed by debit cards and mobile payments. Also, Robb (2007) investigated credit card usage among American college students. He found a few relevant variables, viz., race, gender, marital status, and financial autonomy. The role of students’ gender as a factor of variability is also emphasised by Bocchialini and Roncini (2015). Another common financial product is insurance, as per the feedback of most students. (Danes and Hira ,1987).
Financial literacy assessment approach is relatively common. One of the simplest methods is the „Big Three” (Lusardi, 2019). It contains three simple questions like a rapid test. Two main test types exist for deeper examination: the questionnaire and the performance test. The latter examines the correct response rate (Chen and Volpe, 1998; Danes and Hira, 1987). Cross-country and global researches also use questionnaires and/or statistics (SallieMae, 2019; Klapper, Lusardi and Oudheusden, 2015). Only points of view can be different: Agarwalla et al. (2015) examined financial
13
knowledge, financial attitudes, and financial behaviour dimensions, while Grohmann and Klühs and Menkhoff (2018) analysed how financial literacy enhanced financial inclusion.14
CHAPTER 3 RESEARCH METHODS
3.1 RESEARCH STRATEGY
Vis-à-vis every criterion, exploratory and attitudinal research ought to be distinguished (Stebbins, 2001; Gajar, 1983). In case of experimental research, there is a limited knowledge on the subject; therefore, our main goal is to gather basic information for a better comprehension. When administering attitudinal research, specific questions are ofttimes raised. My research is of the latter type, as I have specific interest and composed questions with simple answers.
The methods of research can be a quantitative survey, a qualitative interview, a case study, or an action-oriented research (Cameron and Price, 2009). Case studies deeply analyse a specific situation and focus on one or a few cases. Action-oriented research can be harnessed for studying the effects of a change in an organization. Gauging current literacy and activity levels among Hungarian college students was endeavoured; thus, neither a case study nor an action-oriented research was an option. Qualitative interviews are for a small group of respondents, but a relatively large sample of data necessitated. Consequently, the current research shall be performed by means of an attitudinal quantitative survey.
Quantitative explorations prefer computational, mathematical, and statistical tools to derive results. They locate cause and effect relationships. Since the quantitative research of this study is a survey, the collected information may be examined rapidly in contrast with various investigation strategies. It also offers sound and repeatable information. Qualitative research applies small sample bulk as it collects all-inclusive information. This takes up a great deal of time and diminishes the number of people being concerned.
Of course, quantitative research also mounts crucial limits. Considering there are not any tête- à-tête connections with respondents in this approach, the researcher cannot appraise the
15
trustworthiness or verity of each result. Therefore, it shall be assumed that all answers are true. There is a restricted chance to test the answers from the research. To avoid this drawback, a pilot trial was arranged, which was truly useful in finalising the questionnaire.3.2 POPULATION, SAMPLE AND SAMPLING; METHODS OF COLLECTING DATA
Reckoning the benefits and drawbacks of online and offline questionnaires and keeping the distortion effect minimal, an offline questionnaire (Gunter et al., 2002, Zhang et al., 2017) was devised.
The response rate was 92%. It was far beyond the usual rate of 20-40% of online questionnaires (Ilieva, Baron, and Healey, 2002).
The objective was to create a self-administered questionnaire (Lavrakas, 2008). I was assisted in distributing, re-collecting, and returning the questionnaires by his fellow students. As questionnaire replies had arrived, they were imported to a Microsoft Excel workbook, thereafter, to SPSS. Solely closed questions (Peterson, 2000) were used in the questionnaire except for the question regarding age. The first, demographic part (Shusha, 2017) consisted of ordinary questions; thus, all available answers could be specified in close questions. The second part about financial habits, literacy, and activities also exclusively consisted of closed questions. Likert-scales of 3, 4, and 5 points (Asún, Rdz- Navarro, and Alvarado, 2015), yes-no questions, and multiple-choice questions (Saunders, Lewis, and Thornhill, 2015) were applied.
The reason for various Likert scales is the structure of the questionnaire. There are different blocks in it. By all means, there is only one type of Likert scale withinside a block, but the blocks differ in terms of the key area concerned. By way of example, 3-point Likert scale was used for education (elementary, high, tertiary), 4-point scale for frequency (never, sometimes, frequently, always) and 5- point one for the regular agree-disagree questions (1 – ‘totally disagree’, 5 – ‘totally agree’). Several aspects of the selected research topic were intended to be analysed; thus, a few different questions were composed for all key areas to be able to aggregate the measures during the analysis.
16 3.3 METHODS OF ANALYSING DATA
Using the questions of financial habits, activity, and literacy, preparing indices of these concepts shall be attempted. These indices will be the basis for the first analysis (McDonald, 2014;
Fowler, 2009): contrasting different demographic groups through mean comparison methods (t-test, ANOVA, Mann-Whitney, Kruskal-Wallis), depending on the number of groups and the normality of the data. Post Hoc tests (using Bonferroni adjustment) were run in case of comparison between more than two groups to reveal if group-pairs differed significantly from each other (Ury and Wiggins, 1974).
Levene’s test was used for testing the homoscedasticity assumption when using the parametric tests.
The validity of the grouping of variables was be tested by Cronbach’s alpha (Bonett and Wright, 2014). Having succeeded in creating indices, different clusters of respondents were about to be formed based on their financial habits, literacy, and activity, using Hierarchical Clustering. As there are ordinal scales regarding, inter alia, dwelling or marital status, in the questionnaire, Spearman’s correlation shall be calculated between them and the indices. As age and the indices are measured on scale, it is worth analysing their relationship by Pearson’s correlation coefficient if normality is assumed (McDonald, 2014; Hauke and Kossowski, 2011).
In case of nominal variables, I needed to test their relationship by chi-square test and measure it by Cramér's V (Cramer and Howitt, 2004), and demonstrate them in crosstabs. Effects of demographic and quality variables were analysed altogether in a General Linear Model (GLM – ANCOVA), described by Baltagi (2008) and was investigated if there was any significant interaction among them. Moreover, financial literacy and activity were necessary to be compared through correlation and pair samples tests.
Inasmuch as the demonstration of the correlation did not involve any causal link (Sassower, 2017), some additional testing necessitated to show causality. Albeit Simon’s method submitted by Blalock (1961) may have been useful in establishing causality, it requires a large sample and is further conditional on that the relevant variables do not disturb the cause and effect relationships at all. The
17
other popular causality test, the Granger test (Granger, 1969) is only applicable for the examination of time series. It was, after all, necessary to develop a technique which permits an analysis as to whether the selected certain economic field of study and the corresponding financial knowledge truly are reasons for a more mindful financial behaviour. The Causal Decision Tree method (Li et al., 2017) is appropriate for this method, which is not only suitable for classification but also for prediction (Song and Lu, 2015). Algorithms used for creating decision trees are recursive types, i.e., they separate sample to groups where attributes of the two groups differ the most. Recursion may be realised at several levels, until elements pertaining to the node run out or become homogenous, or the attributes run out (Quinlan, 1987; Kamiński, Jakubczyk and Szufel, 2017). The method is capable of demonstrating the reason for differences between certain groups. The analysis was followed through with the help of decision trees being guided by sociodemographic variables and two self-made indices (financial intelligence and financial consciousness). The decision trees were composed by nominal and ordinal scale variables, employing Chi-squared Automatic Interaction Detection (CHAID) method. In line with the undivided rule applied at the time of its construction, the multiplicity of parent branches cannot be less than 50 and the number of child branches needs to be at least 25. Notwithstanding interval and metric scale variables (age, financial intelligence, and financial awareness) also featured in the scrutiny, division along them showed great similarity in the formulated models; hence, the authors categorised them in order to provide a better comprehension.3.4 DATA QUALITY ISSUES IN THE RESEARCH
There are numerous quality and validity issues to be met during a survey research (Leeuw, Hox, and Dillman, 2012). The ultimate form of the questionnaire was terminated with pilot test.
Considering the extent of the sample, it was considered an important first step to fill in the initial version of the questionnaire with twenty-five respondents. Questions raised for participants of the pilot test were chosen based on the scientific research of Saunders, Lewis, and Thornhill (2015) and
18
Dillman, Smyth, and Christian (2014). As per the referenced studies, we have found the following questions to be asked during the pilot test:● administration (time needed to fill in the questionnaire, the intelligibility of the questions)
● organisation of questionnaire (relevance, necessity, and transparency of questions)
● content (clarity of questions and whether questions are measuring what we have intended)
Some of the respondents noted that two questions were referring to confidential information, they did not want to share. As they were not important regarding our research, we added them to other question/eliminated them (Have you got a car? and Have you got any funding debt?)
It was further examined whether questions were regarded unambiguous (it turned out eventually that no one had had doubts about clarity) and if there was any question that had created a ground for objection. Filling out of the pilot questionnaires preceded the establishment of the final form of the questions. Based on the responses, I revised impugnable questions for disambiguation. I split some questions into separate ones while others were amended into subquestions. Irredeemable questions were rejected. The restructured questionnaire complies with the criteria of validity.
A reliable dimension, if used under the same circumstances, will tend to result in a similar outcome, in short consistency of measurement. This condition relates to internal consistency, which interprets how different variables may measure the same characteristics (Bollen, 1984). It is an indispensable condition of creating those indices that are to be measured; the rate of success can be measured by Cronbach’s alpha.
3.5. DATA ACCESS
By gathering all completed questionnaires, only the answers themselves returned; yet, without the name of the respondents since the survey was performed unanimously. Since the author
19
had objection to acquiring sensitive information, confidentiality was no longer a matter of reconciliation. The data collection method was online questionnaire; the objectives are summarised below (TABLE I).TABLE I DATA ANALYSIS METHODS
Objective Method of data analysis
Explore the distribution of the sample regarding demographic variables
Descriptive statistics Create indices of financial literacy and activity Reliability tests,
Factor analysis, Mean calculation Explore the distribution and description of indices of
financial literacy and activity
Descriptive statistics, normality tests Test if financial literacy and activity of economic students
from Hungarian tertiary education institutions is higher than those of other university students.
Inferential statistics (mean comparisons)
Describe similarities and differences between students attending economic and noneconomic higher education
Inferential statistics (mean comparisons)
Explore the level of financial literacy and the activity level related to financial matters, based on demographic variables through grouping by institution and major.
Inferential statistics (mean comparisons of independent samples),
Correlation
Compare the financial literacy and activity Inferential statistics (mean comparisons of paired samples), Correlation
Build a model of financial literacy and activity based on determinants like demographic variables
General Linear Model (ANCOVA)
The respondents attend six faculties in total, from five different universities:
1. Budapest Business School University of Applied Sciences, Faculty of Finance and Accountancy (hereinafter BGE-PSZK)
2. Eszterházy Károly University, Faculty of Pedagogy (hereinafter EK-PK) 3. Eötvös Loránd University, Faculty of Law (hereinafter ELTE-ÁJK)
4. Eötvös Loránd University, Institute of Business Economics (hereinafter ELTE-GTI)
20
5. Budapest Metropolitan University of Applied Sciences, Faculty of Art and CreativeIndustries (hereinafter METU-ART)
6. University of Pécs, Faculty of Humanities (hereinafter PTE-BTK)
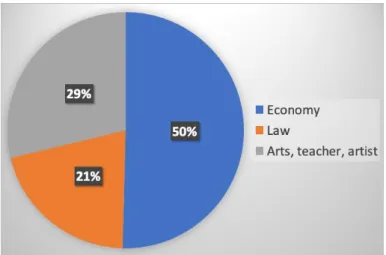
Considering solely one duly completed questionnaire reply was received from ELTE-GTI, this faculty was excluded from the scrutiny; consequently, the examination covered students from five faculties in total. The analysis did not focus on the six faculties but only on their programmes, constituting in turn three fields of study: economics, law, art-pedagogy-philology.
3.6 RESEARCH ETHICS
Ethics in research has a high priority. The ethical basis of medical research (Leeuw, Hox and Dillmann, 2012) is fully applicable to all research situations. (Leavy, 2017). Scientists confront a wide range of rules of conduct: they are obliged to abide by professional, local, and national rules when catechising human participants, they ofttimes oversee students, also perform teaching tasks, and must publish a number of articles, just to name a few. Here are five suggestions Science Directorate of APA provides, among other things, the following five suggestions to assist scientists in keeping away from ethical dilemmas (Smith, 2013):
1. Handle intellectual property rights honestly 2. Be aware of the variety of roles
3. Follow express agreement standards 4. Respect secrecy and concealment 5. Put ethics resources to good use
In summary, researchers should bear in mind three principles: personal respect for all participants, beneficence, and justice. Voluntary participants need to ascertain the unanimous utilisation of their data, so as they shall never be retraced in the future. (Adams, Khan, and Raeside, 2014). The core principle of research ethics is: Nemo censetur ignorare legem. I planned my research from this perspective. When building up the questionnaire, there has been considerable emphasis on
21
avoiding the inclusion of overly personal questions. For this reason, questions regarding the social origin and financial position of respondents do not feature in the survey. Scientific ethics comprise every respect of ethics for financial experts or social experts, as an instance, with reference to reciprocities between scientists and their managers, colleagues, or assistants. Undoubtedly, scientists may want to realise and comply with adequate rules of ethics in the abovementioned fields. I also alluded to this problem in the introduction of my questionnaire.22
CHAPTER 4 RESULTS
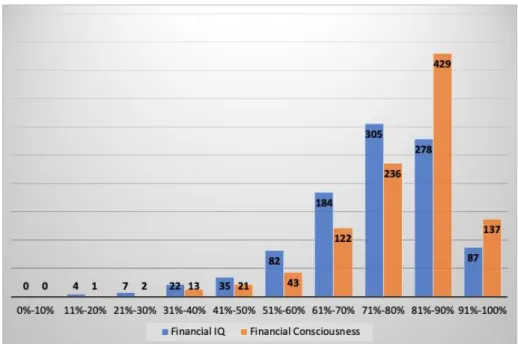
The two most important concepts of my thesis are financial intelligence and financial awareness. I measured these two factors with the combination of multiple questions; thereafter, I determined the values of the indexes based on the responses to the questions. In both cases there was a correct and an incorrect response to the questions that served as components; the incorrect response was 0 points in the scoring, while the correct answer was valued at 1. I used 31 questions for measuring financial intelligence and 18 for financial awareness, then, in order to receive the two indices, I determined the percentage value on the achieved score from the maximum achievable 31 and 18. The percentage form is justified by the more easily comparable standard value. The questions that served as the components of the 2 indexes and the correct responses to them can be found in Appendix (TABLE XLIII and TABLE XLIV). During the selection of the questions, I endeavoured to make every one of them up to date in order that I might have a more realistic picture of the financial knowledge and consciousness of the respondents. But beyond that, I also kept an eye on the query to be as wide-ranging as possible.
It was revealed that among respondents the achieved financial awareness percentage was generally higher than the achieved financial intelligence score, which is demonstrated by the distribution of the 2 indices – see FIGURE 1. In consideration of the relatively high number of components, in the following I treated both indices as continuous quantitative variables, and in their case, I applied the methods corresponding to this.
23
FIGURE 1 DISTRIBUTION OF FINANCIAL INTELLIGENCE AND FINANCIAL CONSCIOUSNESS IN THESAMPLE
In my thesis I examined from multiple aspects how the level of financial intelligence and financial awareness was distributed among various demographic groups. I compared the groups and strove to measure if there was a correlation between belonging to a group and the level of financial intelligence and awareness. Since the respondent target group were university students, mostly the younger age-group filled in the questionnaire, within which the age distribution of men and women was nearly identical – see Figure 2.
FIGURE 2 DISTRIBUTION OF GENDERS BY AGE
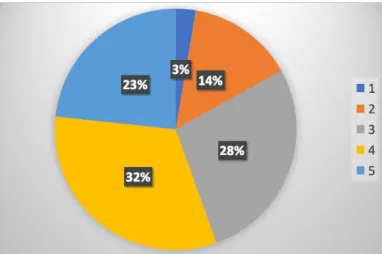
For the purpose of the broadest possible mapping, I also catechised how much respondents were satisfied with their private life and how close their relationships were with their partners. The distributions are depicted in FIGURE 3 and FIGURE 4.
24
FIGURE 3 DISTRIBUTION OF SATISFACTION WITH PRIVATE LIFE IN THE SAMPLEFIGURE 4 DISTRIBUTION OF THE STRENGTH OF COUPLE RELATIONSHIP IN THE SAMPLE I compared the two financial indices based on the strength of their correlation with such characteristics as age, life satisfaction and strength of couple relationships. Since age is continuous scale while the other 2 variables are ordinal scale, in the case of age, I used linear correlation coefficient while in the case of the latter two, I used rank correlation coefficient. I concluded that financial intelligence (r=0.197, p<0.001) and financial awareness (r=0.169, p<0.001) – even if rather slightly but, indeed – increase with advancing age. From among the other two variables related to the relationship of couples, only the level of private life satisfaction showed a weak positive correlation with financial awareness (rho=0.071, p<0.001). On that basis it can be stated that the indices I have measured show no or rather weak correlation with strength and quality of relationships between couples – see TABLE II.
25
TABLE II CORRELATION OF AGE, SATISFACTION WITH PRIVATE LIFE AND STRENGTH OF COUPLERELATIONSHIP WITH FINANCIAL INTELLIGENCE AND FINANCIAL CONSCIOUSNESS
Financial IQ Financial Consciousness
Variable Measure N Correlation Sig Correlation Sig
Age Pearson 1004 0.197 <0.001 0.169 <0.001
Private life satisfaction Spearman 1004 -0.005 0.884 0.071 0.025 Strength of couple
relationship Spearman 1004 -0.007 0.822 0.049 0.123
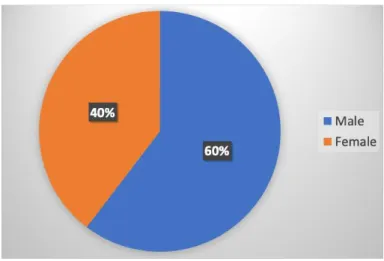
From among the 1,004 students in the sample, there were 398 women and 606 men; their distribution is delineated in FIGURE 5.
FIGURE 5 DISTRIBUTION OF GENDERS IN THE SAMPLE
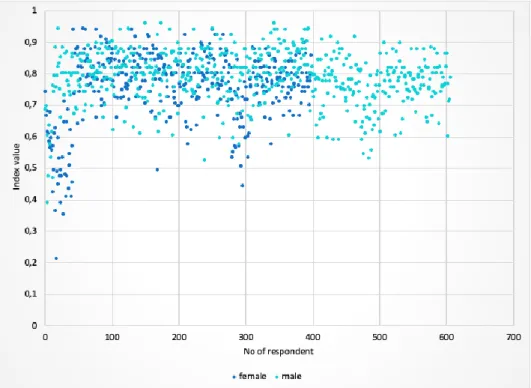
In the case of both indices, I found a significant divergence between genders: men had a 5.4
% higher financial intelligence and a 3.0 % higher financial awareness – see TABLE III, FIGURE 6 and FIGURE 7
TABLE III COMPARISON OF FINANCIAL INTELLIGENCE AND CONSCIOUSNESS BY GENDER Levene' test t-test*
Gender N Mean Std. Dev. F / Sig. t(df) / Sig.
Financial IQ Male 606 0.7692 0.1301 29.473 5.365 (693.575)
Female 398 0.7154 0.1701 <0.001 <0.001
Financial Consciousness
Male 606 0.7926 0.1038 27.719 3.710 (679.528)
Female 398 0.7623 0.1394 <0.001 <0.001
It is visible based on the scatter figures that in the case of men and women the maximum and the upper quartile of both indices are equal, the difference between the averages originates from the
26
fact that among women there are more individuals with lower financial intelligence and financial awareness.FIGURE 6 DISTRIBUTION OF FINANCIAL INTELLIGENCE BY GENDER
FIGURE 7 DISTRIBUTION OF FINANCIAL CONSCIOUSNESS BY GENDER
27
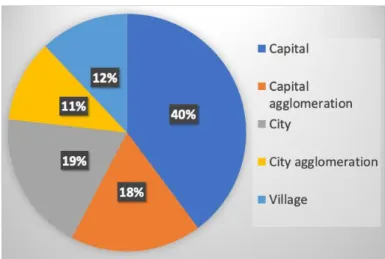
From the aspect of the type of settlement, I distinguished 5 categories; their distribution is presented in FIGURE 8. Since over 100 respondents are in all 5 categories, I assumed normality and examined the correlations between group averages by parametrical tests.FIGURE 8 DISTRIBUTION OF THE TYPE OF SETTLEMENT IN THE SAMPLE
According to the type of settlement, significant divergences can also be shown in the case of both indices, which primarily means a higher value in Budapest and its agglomeration – see TABLE IV and TABLE VI. As regards financial intelligence, it is clearly higher in Budapest and its agglomeration than in the countryside, which was confirmed by the results of post hoc tests as well – see FIGURE 9 and TABLE V.
TABLE IV DIFFERENCES IN FINANCIAL INTELLIGENCE BY TYPE OF SETTLEMENT AND COMPARATIVE STATISTICS THEREOF
Settlement N Mean Std. Deviation
Capital 400 0.7659 0.1287
Capital agglomeration 179 0.7739 0.1131
City 192 0.7286 0.1718
City agglomeration 112 0.7204 0.1703
Village 121 0.7060 0.1840
Total 1004 0.7479 0.1495
Levene's test
F df1 df2 Sig.
9.776 4 999 <0.001
Welch's d-test
F df1 df2 Sig.
6.358 4 352.62 <0.001
28
FIGURE 9 DIFFERENCES IN FINANCIAL INTELLIGENCE ACCORDING TO THE TYPE OF SETTLEMENTBased on the post hoc tests, it can be argued that financial intelligence values of Budapest and its agglomeration, which indeed have the highest averages, are significantly higher than those of other towns.
TABLE V POST HOC TEST RESULTS OF FINANCIAL INTELLIGENCE BY TYPE OF SETTLEMENT
Settlement (I) Settlement (J) Mean Difference (I-J) Std. Error Sig.
Capital Capital agglomeration -0.008 0.011 0.944
Capital City 0.037 0.014 0.061
Capital City agglomeration 0.046 0.017 0.071
Capital Village 0.060 0.018 0.009
Capital agglomeration City 0.045 0.015 0.023
Capital agglomeration City agglomeration 0.053 0.018 0.030
Capital agglomeration Village 0.068 0.019 0.003
City City agglomeration 0.008 0.020 0.994
City Village 0.023 0.021 0.813
City agglomeration Village 0.014 0.023 0.971
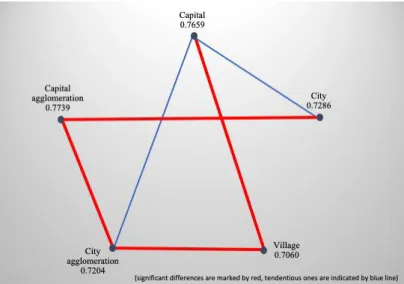
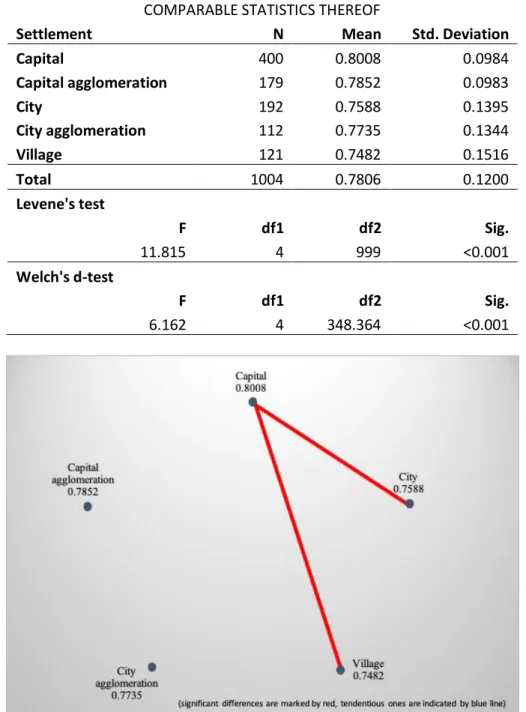
In the event of financial awareness, the picture is more complex since Budapest and its agglomeration have significantly higher average but other towns and their agglomeration are not far behind either – see TABLE VI. This was also proven by the post hoc tests since only Budapest differed from the averages of other towns – see FIGURE 10 and TABLE VII.
29
TABLE VI DIFFERENCES IN FINANCIAL CONSCIOUSNESS BY THE TYPE OF RESIDENCE ANDCOMPARABLE STATISTICS THEREOF
Settlement N Mean Std. Deviation
Capital 400 0.8008 0.0984
Capital agglomeration 179 0.7852 0.0983
City 192 0.7588 0.1395
City agglomeration 112 0.7735 0.1344
Village 121 0.7482 0.1516
Total 1004 0.7806 0.1200
Levene's test
F df1 df2 Sig.
11.815 4 999 <0.001
Welch's d-test
F df1 df2 Sig.
6.162 4 348.364 <0.001
FIGURE 10 DIFFERENCES IN FINANCIAL CONSCIOUSNESS BY THE TYPE OF RESIDENCE
TABLE VII POST HOC TEST RESULTS OF FINANCIAL CONSCIOUSNESS BY THE TYPE OF SETTLEMENT Settlement (I) Settlement (J)
Mean Difference
(I-J) Std. Error Sig.
Capital Capital agglomeration 0.016 0.009 0.396
Capital City 0.042 0.011 0.002
Capital City agglomeration 0.027 0.014 0.269
Capital Village 0.053 0.015 0.004
Capital agglomeration City 0.026 0.012 0.217
Capital agglomeration City agglomeration 0.012 0.015 0.931
30
Capital agglomeration Village 0.037 0.016 0.129
City City agglomeration -0.015 0.016 0.896
City Village 0.011 0.017 0.971
City agglomeration Village 0.025 0.019 0.661
The questionnaire survey extended to a total of 6 faculties of 5 universities, the response rate in some faculties was very low. Since not a single student from ELTE-GTI sent back the questionnaire, I disregarded the faculty amid further analyses. The distribution of respondents according to faculties is shown in FIGURE 11.
FIGURE 11 DISTRIBUTION OF FACULTY IN THE SAMPLE
When it came to the decision if I should apply a parametrical or non-parametrical test during the analyses, I made the decision based on the results of the normality test. If the sample element number of a group reaches 100, predicated on the Central Limit Theorem (CLT), the sample can be presumed normal. In these cases performing a normality test is unnecessary. However, in regard to analysis according to faculties, I could not do the same (see TABLE VIII). In the case of financial intelligence, in the two groups with lower element numbers, normality cannot be presumed. However, financial awareness presumably follows a normal distribution in every group; thus, as a result of the absence of homogeneous variances, I applied Welch's t-test to examine the equality of averages.
Speaking of both financial intelligence and financial awareness, I found a significant divergence between the group averages – see TABLE VIII.
31
TABLE VIII COMPARISON OF FINANCIAL INTELLIGENCE AND CONSCIOUSNESS ACROSS DIFFERENTUNIVERSITIES
Kolmogorov-Smirnov
Faculty Statistic df Sig. Median
Financial IQ
BGE-PSZK 0.133 505 <0.001 0.789
EKE-PK 0.126 193 <0.001 0.684
ELTE-ÁJK 0.140 209 <0.001 0.842
METU-ART 0.194 48 <0.001 0.474
PTE-BTK 0.129 48 0.044 0.368
Total NA 1003 NA 0.789
Kruskal-Wallis H df Asymp. Sig.
340.95 4 <0.001
Financial Consciousness
Kolmogorov-Smirnov
Faculty Statistic df Sig. Mean
BGE-PSZK 0.144 505 <0.001 0.8128
EKE-PK 0.108 193 <0.001 0.7805
ELTE-ÁJK 0.156 209 <0.001 0.8025
METU-ART 0.118 48 0.090 0.6528
PTE-BTK 0.061 48 0.200 0.4771
Total NA 1003 NA 0.7807
Levene’test F df1 df2 Sig.
4.711 4 998 0.001
Welch D-test F df1 df2 Sig.
113.818 4 171.63 <0.001
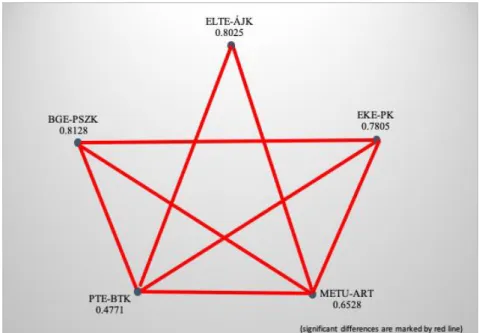
From the aspect of financial intelligence practically every university faculty significantly differs from the others, even from other faculties of the same university. But there is no significant divergence between the averages of ELTE-ÁJK and BGE-PSZK or METU-ART and PTE-BTK – see FIGURE 12 and TABLE IX. Thus, it can be concluded that the financial intelligence of ELTE-ÁJK and BGE-PSZK students is the highest, followed by EKE-PK students, while METU-ART and PTE-BTK students have the lowest.
32
FIGURE 12 DIFFERENCES IN FINANCIAL INTELLIGENCE ACROSS FACULTIESTABLE IX POST HOC TEST RESULTS OF FINANCIAL INTELLIGENCE BY FINANCIAL INTELLIGENCE University (I) University (J) Test Statistic Std. Error
Std. Test
Statistic Adj. Sig.
PTE-BTK METU-ART 7.615 58.686 0.130 >0.999
PTE-BTK EKE-PK 289.653 46.371 6.246 <0.001
PTE-BTK BGE-PSZK 521.086 43.425 12.000 <0.001
PTE-BTK ELTE-ÁJK 544.827 46.016 11.840 <0.001
METU-ART EKE-PK 282.038 46.371 6.082 <0.001
METU-ART BGE-PSZK 513.471 43.425 11.824 <0.001
METU-ART ELTE-ÁJK 537.212 46.016 11.674 <0.001
EKE-PK BGE-PSZK 231.433 24.330 9.512 <0.001
EKE-PK ELTE-ÁJK -255.174 28.701 -8.891 <0.001
BGE-PSZK ELTE-ÁJK -23.741 23.647 -1.004 >0.999
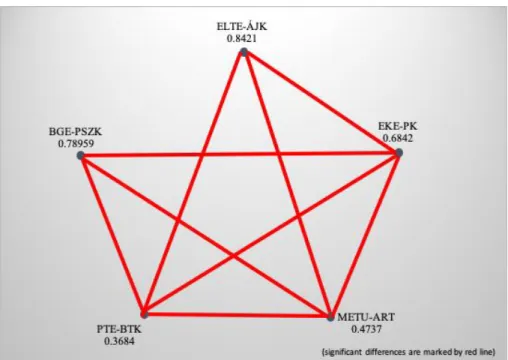
From the aspect of financial awareness, practically every group significantly diverges from the others. An exception to this is ELTE-ÁJK, which, as the second in line, does not significantly diverge from either the first (BGE-PSZK) or the third (EKE-PK) – see FIGURE 13 and TABLE X.