Introduction
According to the guidelines of the European Commission for the new CAP post-2020, EU countries are required to respect the environment and climate change. Eurostat data for the period 2006–2015 shows that the consumption of nitrogen fertiliser in Lithuanian agriculture, unfortunately, increased by approximately 36 percent. Family farms in scientific literature are described as one of the main agricul- ture business forms where agricultural production links to family labour, capital, and control (Kostov et al., 2019). In Lithuania, the consumption of fertilisers on family farms is at the average level among EU countries. However, despite the increase in damage, the use of fertilisers is still not taxed.
This may lead to the uncontrolled use of fertilisers on family farms in Lithuania.
The new CAP gives more freedom for EU countries in respect of an innovation focus on the environment and climate change, revising the green architecture (Jongeneel, 2018). Various research (Pearce and Koundouri, 2003;
Savci, 2012; Mottershead et al., 2018) confirmed that the use of fertiliser causes environmental problems. Fertiliser has negative effects on people, on biodiversity, and on cli- mate change.
The use of fertiliser is still the main source of agricul- tural land pollution. Therefore, to decrease the damage caused by fertilisers to the environment (soil, water, air), an EU Member State has to seek the “minimum require- ments for the use of fertilisers and plant protection products, animal welfare” (Jongeneel, 2018). Each EU country must use political instruments to control the use of fertiliser: one such political instrument is tax. According to the experience of different countries, fertiliser tax is a useful tool to seek minimum requirements on the use of fertilisers in the EU (Rougoor et al., 2001; Pearce and Koundouri, 2003; Söder- holm and Christiernsson, 2008; Vojtech, 2010). Fertiliser tax
is the main policy tool for controlling fertiliser consumption (Mergos and Stoforos, 1997).
Moreover, one needs to take into account that fertiliser is necessary to grow more agriculture production. “Fertilis- ers help feed almost 50 per cent of the global population”
(Euractiv, 2018). While the use of fertiliser ensures quantity in agricultural production, unfortunately, it does not ensure the quality and safety of agricultural production. These agri- cultural practices have negative implications for “the envi- ronment and human health” in all processes (use of fertiliser, harvest production, irrigation etc.) of growing agriculture production (Udeigwe et al., 2015).
On the one hand, this ensures the quantity of agricultural production and leads to more income for family farms, espe- cially if one considers the growing global population. On the other hand, the quantity of food required by a growing population may lead to the increased use of fertilisers. There- fore, the fertiliser tax may not only reduce the excessive use of fertilisers but may also draw attention to new farming methods. However, determining what level of fertiliser tax is appropriate remains an important challenge. If the fertiliser tax were high enough, there would be a positive influence on reducing the use of the fertiliser. However, there would be less production and less income achieved by family farms.
The guidelines of the new CAP post-2020 indicate that the income problems of family farms are still important (Jonge- neel, 2018).
Unfortunately, Lithuania is not on the path of ecological tax reform. At the same time, not enough research has been done on the possible effect of a fertiliser tax in Lithuania.
Lithuania is one of the EU countries where the environmental tax revenue is among the lowest in the EU (Čiulevičienė and Kożuch, 2015), which leads to the following two issues: first, the use of the fertiliser is not controlled enough in Lithuania;
second, there is no tax revenue collected for the compensation of negative externalities caused by the use of fertilisers.
Erika BESUSPARIENĖ* and Vesa A. NISKANEN**
The Assessment of Factors Affecting Fertiliser Use on Family Farms in Lithuania
Fertiliser use is an ambigious issue in agricultural economics with different arguments commonly given for and against it. The aim of this paper is to find the most important factors affecting fertiliser use in Lithuania, serving as a basis for our fertiliser tax modelling of Lithuanian family farms. Raw data from Lithuanian farms was collected from the Lithuanian Farm Accountancy Data Network (FADN) covering the years 2003–2017, and data from other selected countries was also found in the FADN database, although in this case, different years (2004–2016) were available. Results suggest the significant factors affecting fertiliser use on family farms in Lithuania differ significantly from other EU countries. Hence, our empirical results confirm that there is no unique methodology or unique set of financial instruments for fertiliser tax modelling among EU countries, and this should be taken into account in future studies. We also noticed that investment in land, the extent to which farm output consists of wheat, rye and field vegetables, the use of harvesters and finally, land quality should also be taken account in future fertiliser tax modelling.
Keywords: agricultural and tax policy, family farms, environmental tax, fertiliser tax, Lithuania JEL classifications: Q15, Q18, H23
* Vytautas Magnus University, K. Donelaičio g. 58, 44248 Kaunas, Lithuania. Corresponding author: erika.besuspariene@vdu.lt
** University of Helsinki, P.O. Box 4, (Yliopistonkatu 3), 00014 Helsinki, Finland.
Received: 29 November 2019, Revised: 27 February 2020, Accepted: 2 March 2020.
Therefore, this paper analyses how various factors influ- ence the use of fertilisers and why these factors must be taken into account in the fertiliser tax modelling. The aim of our research is to identify the significant factors in the use of fertilisers of family farms in Lithuania and compare these factors with other selected countries.
The importance of fertiliser tax
In order to disclose the need of fertiliser tax as a fiscal policy instrument to control negative externalities, this part includes a discussion of significance, advantages and disad- vantages of fertiliser tax, as well the review of studies on the fertiliser tax applied in various countries.
The significance of fertiliser tax includes motivation as an effective tax policy instrument, which is a relatively new environmental tax in Europe, started to be used in the last two decades (Söderholm and Christiernsson, 2008). Ferti- liser tax is one of the most important environmental taxes.
According to Heady et al. (2000), environmental taxes must reduce damage to the environment by increasing the costs of harmful actions and this requires the taxpayers to take into account their negative behaviour towards the environment and pay for the damage.
However, fertiliser tax can reduce the income of many agri-food stakeholders. Von Blottnitz (2006) shows that a decrease in the use of fertilisers would have a negative influ- ence on family farms, producers of the fertiliser, and also for the consumer. It would reduce the income of family farms, reduce the sales of producers of fertiliser, and change con- sumer’s expenditure, with affects international trade. There- fore, these factors must be taken into account when setting a fertiliser tax.
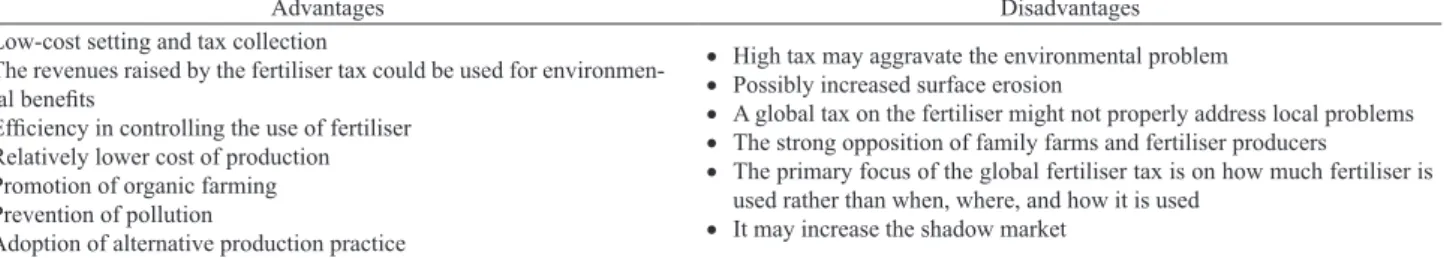
Francis (1992) and Uri (1998) admit that fertiliser tax has advantages compared with other policy instruments for controlling fertiliser use. According to Francis (1992) and Chowdhury and Lacewell (1996), fertiliser tax has many disadvantages as the tax does not determine the impact on producing, consuming and farming communities. The main advantages and disadvantages of fertiliser tax are presented in Table 1.
As evident from Table 1, a fertiliser tax can be a useful policy instrument for solving environmental problems and changing farming practices. According to Francis (1992) and Uri (1998), the cost of fertiliser tax collection is low. There- fore, from the economic point of view, introducing a ferti- liser tax is an easy task. Unfortunately, a fertiliser tax may have numerous disadvantages. Chowdhury and Lacewell
(1996) admit that family farms may change their behaviour and may avoid paying tax. Similarly, Francis (1992) as well as Chowdhury and Lacewell (1996) confirm that a universal fertiliser tax is not focused on local family farm problems.
Scandinavian countries are distinguished as leaders in respect of ecological issues – consequently, fertiliser taxes were introduced there at the end of the 20th century (Holm Pedersen, 2007). Therefore, most studies on the impact of fertiliser taxes are found in the cases of Scandinavian countries. However, the research results are controversial.
According to Rougoor et al. (2001), fertiliser tax had a posi- tive influence in decreasing the use of fertilisers in Austria and Sweden. Unfortunately, results in Finland were less pro- nounced. Pearce and Koundouri (2003) show that fertiliser tax has slightly reduced fertiliser use in Norway and Sweden and it is complicated to assess the tax effect of other policy instruments. Vojtech (2010) admits that fertiliser tax is inex- pensive to administer, though unfortunately, it might be less effective as a pollution tax. There are still doubts about how much a fertiliser tax can be effective in reducing fertiliser use. However, fertiliser taxation is now back into discussions in the EU due to climate change effects (Karatay and Meyer- Aurich, 2018). This is confirmed by the research results that non-CO2 greenhouse gases emissions reduce due to decrease in the use of fertilisers (Mottershead et al., 2018).
Empirical analysis of factors related to fertiliser use
The demand for fertilisers introduces the need to limit fertiliser use in the world (Mergos and Stoforos, 1997).
Regulating the use of fertilisers is important because not all fertilisers are used efficiently: some of them evaporate into the air or enter into watercourses. To develop a fertiliser tax, it is important to evaluate which objects are affected by the use of fertiliser during the operations of the family farm.
Family farms take a large part of the land for the production of food or other products (Wunderlich, 1997) and the use of fertiliser is related to the use of land. The results of various studies reveal that the amount of fertiliser use depends on the characteristics of the land, plants and agricultural machinery.
According to the research by Savci (2012), we can see that plants may use up to 50 per cent of fertilisers, while up to 25 per cent remains in the soil. That means that the other 25 per cent of the fertiliser has a negative impact on the environ- ment.
Table 1: Advantages and disadvantages of fertiliser tax.
Advantages Disadvantages
• Low-cost setting and tax collection
• The revenues raised by the fertiliser tax could be used for environmen- tal benefits
• Efficiency in controlling the use of fertiliser
• Relatively lower cost of production
• Promotion of organic farming
• Prevention of pollution
• Adoption of alternative production practice
• High tax may aggravate the environmental problem
• Possibly increased surface erosion
• A global tax on the fertiliser might not properly address local problems
• The strong opposition of family farms and fertiliser producers
• The primary focus of the global fertiliser tax is on how much fertiliser is used rather than when, where, and how it is used
• It may increase the shadow market Source: own composition based on Francis (1992), Chowdhury and Lacewell (1996) and Uri (1998 )
Research results show that increased use of machinery also increased the consumption of fertilisers – as in the case of China from 1978 to 1996 (Felloni et al., 2001). The nega- tive impact on the environment depends on the type of the used machine. The fertiliser might be lost in the machines.
Nowadays, the situation may change. Rehman et al. (2017) admit that modern technology, new machines, and computer monitoring systems could ensure that farming is “less waste- ful in the use of fuel, fertiliser or seed”. According to Zhang et al. (2013), modern technologies “can have a large impact on emission reduction” in all fertiliser production and use chains. Research by Felloni et al. (2001) points out that trac- tors and fertilisers might be more important factors together than by studying them separately.
As mentioned earlier, 25 per cent of fertiliser reacts with the soil (Savci, 2012), but also the quantity of fertiliser absorbed in soil depends on soil productivity. The Law of the Republic of Lithuania on the Establishment of the Data- base of Land Performance Assessment and the Data Update 2008–2011 and the Approval of Rules for the Assessment of Land Performance (2008) provides the basis of the cal- culation of a soil productivity index. This index includes the correction coefficients of soil acidity (pH), phosphorus, calibration, soil stoniness, a variation of coating (colour), and climatic conditions. Therefore, soil productivity deter- mines how much fertiliser the soil could absorb. Fertiliser is used to restore soil productivity: if soil productivity is good enough, the soil and plants do not absorb minerals. Accord- ing to Končius (2007), phosphorus transformation of ferti- lisers depends on soil productivity; plants have a low level of phosphorus absorption or unabsorbed phosphorus. This causes the excess of the fertiliser which enters into the air and water.
The use of fertilisers determines the volume of produc- tion, which ensures income for a family farm. Results of various research confirm that a decrease in the use of ferti- liser leads to a decrease in farm’s income. Consequently, the profit of family farms depends on the quantity of fertiliser used (Mengel et al., 2006). However, there is also research indicating that contrary results can be achieved by the pro- motion of fertiliser with subsidies with a view to reducing poverty and promoting crop production. Fertiliser subsidies are inefficient to increase family farm’s income (Ricker- Gilbert and Jayne, 2012). However, it needs to be taken into
account that about 90 per cent of the world population lives on low incomes in small family farms (Lipton, 2005, cit.
Birner and Resnick, 2010). Therefore, the use of fertiliser ensures that the family farm’s income is sufficient, and also ensures food for the wider population. Ladha et al. (2005) say that 50 per cent of the population relies on nitrogen ferti- lisers used in food production. About 60 per cent of nitrogen fertiliser is used worldwide for three main products: rice, wheat and maize.
There also exist some differences in the use of the ferti- liser which depend on family farms’ size and their resources.
The research reveals that family farms’ size can affect sus- tainable farming. Sustainable agriculture is described as a way to avoid the use of fertiliser, herbicides, pesticides, and feed additives (Singh and Jajpura, 2016). Family farms stand out as sources of funding, this has an effect on farm size and the potential to grow into a large farm. Large family farms have better access to markets and information, and the capi- tal often uses external financing (Kozlovskaja, 2012) and for these reasons can be more productive. However, scientists do not accept the stereotype that small family farms are unproductive as they have fewer assets and investments. The research discloses that small family farms are more produc- tive in total output than large farms and are able to make more profit (Rosset, 2000; Altieri, 2009). Small family farms use fewer resources but use them more intensively (Altieri, 2009). Small family farms are more sustainable and better at conserving biodiversity and natural resources (Rosset, 2000).
Altieri (2009) admits that some scientists discuss that small family farms are able to produce much food for rural society “in the midst of climate change and burgeon- ing energy costs”. Rosset (2000) says that the advantages of small family farms extend into the ecological field, and small family farms can be more “effective stewards of natu- ral resources and the soil”. Following the research by Altieri (2009) and Rosset (2000), it can be assumed that small fam- ily farms use less fertiliser, because small family farms bet- ter protect biodiversity and other natural resources, and tend to choose more sustainable farming methods or ecological farming.
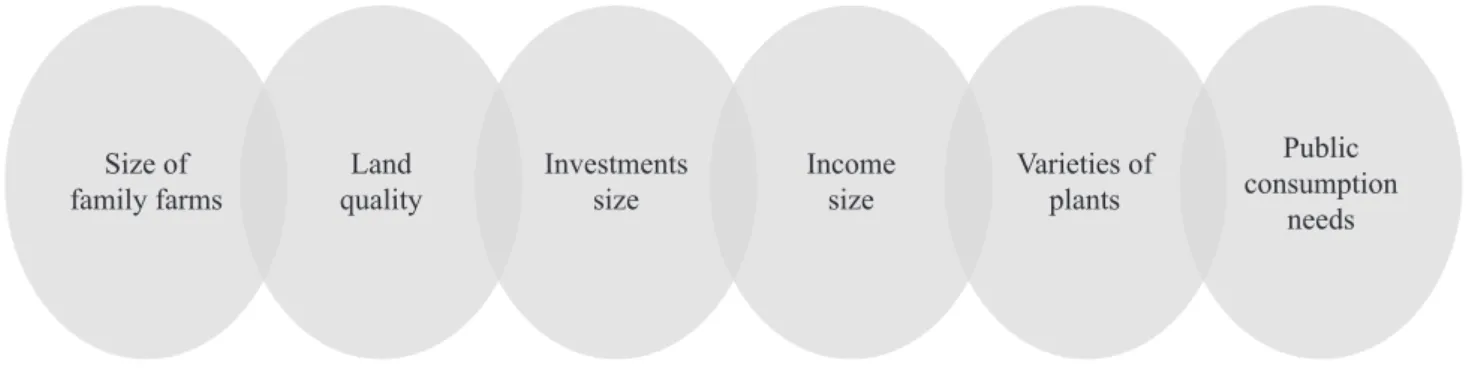
The results of the literature review show the key factors that determine fertiliser use (see Figure 1).
Size of
family farms Land
quality Investments
size Income
size Varieties of plants
Public consumption
needs
Figure 1: Factors related to the use of fertiliser.
Source: own composition
Methodology and data
The aim of the research is to identify the most signifi- cant factors affecting Lithuanian family farm fertiliser use and compare these results with the other selected countries.
Our future research raises the question of whether these fac- tors could be used for the design of the fertiliser tax. Taking into account the general regulation of the EU, it is important to evaluate whether the same criteria exist in Lithuania and other EU family farms.
By summarising the theoretical aspects and the previ- ous results of the scientific research concerning the factors related to the fertiliser use, we followed seven steps (Figure 2). Empirical calculations were performed by using the IBM SPSS Statistics 20 software.
The first step for our research was data collection. We used the data of Lithuanian family farms for the years 2003–
2017, obtained from the national FADN database. In Step 1 and Step 4, we created groups of family farms, accord- ing to their economic size. We regrouped the family farms into micro (>€8,000), small (€8,000–€25,000), medium (€25,000–€100,000), and large (<€100,000) farms as sug- gested by Vitunskienė (2014).
In Step 2, we studied the relationships between our pos- sible factors in a correlation matrix. In Step 3, we compared our empirical results with the factors found in the literature review. In Step 4, the other selected countries were compared with the Lithuanian results. In the context of climate change, it is important to consider the cases of different countries with the results of Lithuania. We chose three countries which used at least as much fertiliser per hectare as Lithuania and also three countries which used the most fertiliser, according to the FADN database in 2016 (Figure 3).
Step 5.
Calculation of regression model in the Lithuanian case and the selected countries.
Step 4.
Selection of countries for comparison with the Lithuanian case and data collection
of the selected countries.
Step 1.
Lithuanian family farms' data collection.
Step 2.
Calculation of correlation coefficient in the case of Lithuania.
Step 6.
Comparison of the results between Lithuania and
the selected countries.
Step 3.
Estimation of correlation strength between variables in the case of Lithuania.
Figure 2: Steps of the methodology of our research.
Source: own composition
0 50 100 150 200 250
Malta Netherlands
Belgium Lithuania
Latvia Austria
Portugal
EUR/ha
68 76 77
102
168
205
239
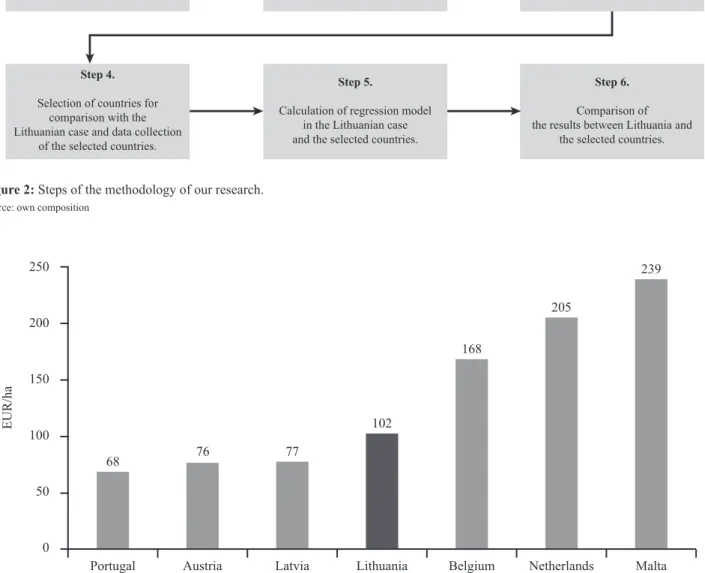
Figure 3: The use of the fertiliser in Lithuania and other selected countries (EUR/ha).
Note that Portugal, Austria, and Latvia use less, whereas Belgium, Netherlands, and Malta use more fertiliser than Lithuanian farmers.
Source: own composition
In Step 5, we were looking for the most suitable regres- sion model to determine the factors that predict the use of fertilisers in Lithuanian family farms and those of other selected countries. We applied the ordinary linear regression model. Our goodness of fit criteria were the level of mar- ginal significance (p-value), the coefficient of determination (R-square) and multicollinearity coefficient (VIF).
The majority of researchers agree that VIF greater than 10 clearly indicates multicollinearity problems (García et al., 2015; Akinwande et al., 2015). Unfortunately, no precise limit value for multicollinearity is available. García et al. (2015) suggested that VIF> 4 may lead to multicolline- arity, and this is the classical point of view. Other researchers suggest that the model needs to be reviewed when the VIF is over 5 (Akinwande et al., 2015) or 6 (Huang et al., 2008). In our regression models, we used the classic rule that VIF has to be between 1 and 6. The regression model is considered to be reliable if its p-value is less than 0.05. When constructing our best regression model, we applied the stepwise method.
In Step 6, we drew the conclusions and comparisons. Our objective was to examine whether the significant factors for the use of the fertiliser were similar among these countries.
This aspect is important for further research when setting fertiliser tax in Lithuania.
Results
According to the literature review, we calculated the cor- relation coefficients between fertiliser use and various invest- ments, financial results of family farms, plants’ output, and other factors in Lithuania. Some scientists admit that the use of fertiliser might be important for family farms’ investment in assets. According to the literature, the most important invest- ments were made in agricultural machinery and land. Accord- ing to the data on family farms of Lithuania in 2003–2017, the correlation coefficients indicate that there are moderate positive relationship between land (0.6301) and harvesters
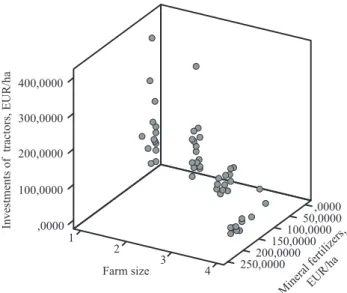
(0.5447). The situation can be interpreted that the increase in crop field will increase the use of fertiliser. Fertilisers will ensure production quantities that require harvesters to harvest crops. A low negative correlation exists with the investment in tractors (-0.335). As observable from Figure 3, there is a relationship in some cases, though quite low.
Figure 4 confirms the ideas of Felloni et al. (2001), Zhang et al. (2013) and Rehman et al. (2017) that, today, modern technology in agriculture ensures less waste in the use of fer- tiliser. Moreover, Figure 4 shows that if family farms’ invest- ments in tractors increase, then the use of mineral fertiliser decreases, which confirms again that the higher the number of modern tractors, the more effective is the use of mineral fertiliser.
Family farms play an important role in the food market.
Therefore, growing plant varieties disclose the needs for food consumption. We calculated the correlation between fertiliser use and the outputs of various crops. Results showed that the most important crops in Lithuania were wheat (correlation coefficient 0.9504), rape (correlation coefficient 0.9341), sugar beet (correlation coefficient 0.7195), field vegetables (correlation coefficient 0.5970), protein (correlation coeffi- cient 0.3760) and triticale (correlation coefficient 0.3252).
These crops increased the use of fertilisers. Only a few crops had negative correlations. The family farms which grow oats (correlation coefficient -0.4518), grain mix (correlation coefficient -0.4911), and other crops (correlation coefficient -0.5426) used less fertiliser.
General subsidies (correlation coefficient -0.3193) ensure less fertilisation in Lithuania. When evaluating the different types of subsidies, results show that subsidies to livestock (correlation coefficient-0.4520) have a negative correlation.
This is understandable as fertilisers are not used in animal husbandry. Subsidies to less-favoured areas of farming (correlation coefficient -0.6167) and organic farming (cor- relation coefficient -0.5997) also ensure a lower amount of fertiliser use. Unfortunately, sugar subsidy (correlation coef- ficient 0.4755) increased the use of fertilisers.
1 400,0000
250,0000200,0000150,0000100,000050,0000,0000 300,0000
200,0000 100,0000 ,0000
2 3
4 Farm size
Mineral fertilizers,EUR/ha
Investments of tractors, EUR/ha
Figure 4: Relationship between the use of fertiliser, investment in tractors and family farm size in Lithuania.
Source: own composition
1 1200,0000
200,0000 100,0000
,0000 1000,0000
800,0000 600,0000 400,0000 200,0000
2 3 4
Farm size Mineral fertilizers, EUR/ha
Output crops, EUR/ha
Figure 5: Relationship between the use of fertiliser, crop outputs and family farm size in Lithuania.
Source: own composition
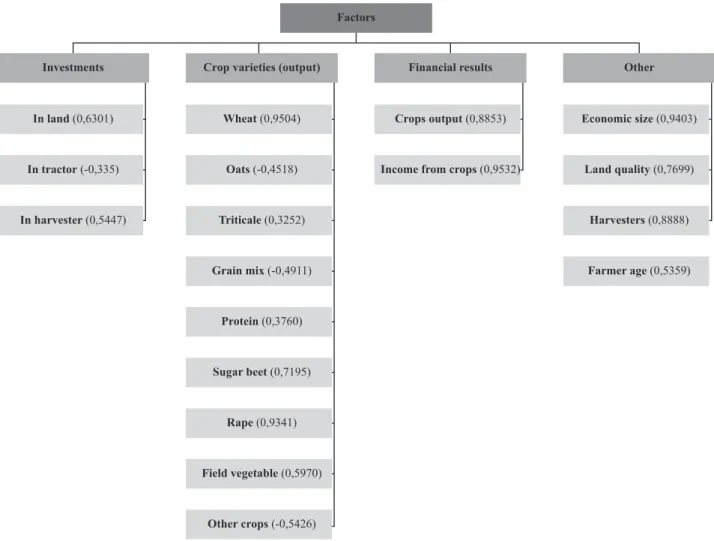
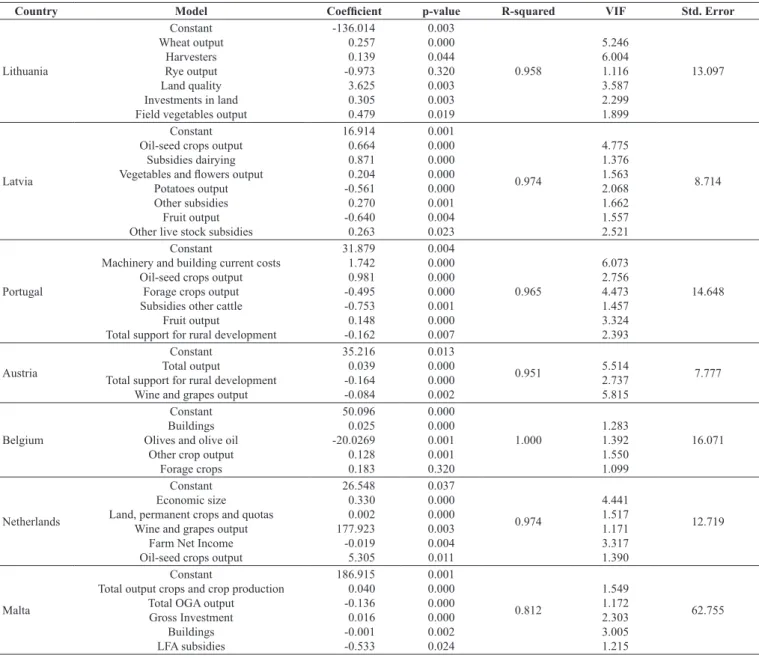
On the whole, the results confirm the importance of simi- lar factors related to the use of the fertilisers previously high- lighted by the literature review. The variables which have an impact on the use of fertiliser on family farms in Lithuania can be classified into four groups: investments, crop varie- ties, financial results, and other factors. These factors (Fig- ure 6) are important in fertiliser tax modelling. Therefore, we formed an ordinary least squares regression model using selected variables in Lithuania and the cases of the selected countries (see Table 2) to check the extent to which these factors are significant.
The best regression model was found for the Austrian case (R-squared is 0.951, standard error of the estimate is 7.777) and the Latvian case (R-squared is 0.974, standard error of the estimate is 8.714). The regression model is good enough in the case of Lithuania, yet VIF was left to 6, which, according to some researchers, can signal certain multicol- linearity problems. The same situation with the regression model exists in the Portugal and Austrian case. However, the R-square is high enough in Belgium (1.000), the Netherlands (0.974) and Portugal (0.965), which indicates the reliabil- ity of the variables. The lowest R-squared is in the Malta regression model (0.812). Moreover, in the case of Malta’s regression models, the standard error of the estimate ranged In line with our assumption, micro and small family
farms are able to be more productive than medium and large family farms, as previously confirmed by Rosset (2000) and Altieri (2009) (Figure 5).
Micro family farms are more productive than small fam- ily farms in Lithuania. What is more, in some cases, micro family farms are able to produce a higher yield of crops than medium family farms and use less fertiliser for production (Figure 5). While small family farms are not as productive as large family farms, they are still able to get the same output from crop production as medium family farms. This con- firms the idea of Rosset (2000) and Altieri (2009) that micro and small family farms are more sustainable and use less fertiliser. Consequently, the correlation coefficient between fertiliser use and economic farm size is high (0.9403). This leads to the willingness of medium and large farms to pro- duce larger quantities of crops and ensure financial results.
A high positive correlation exists between the use of fer- tiliser use and land quality (0.7699) in Lithuania. The rela- tionship shows that if land quality increases, the use of ferti- liser increases too, implying existing pollution problems. If soil productivity is good enough, but family farms use more mineral fertilisers for the plants, then the soil does not absorb these minerals and they pollute air, water and land.
Factors
Investments Crop varieties (output) Financial results Other
Economic size (0,9403) Land quality (0,7699)
Harvesters (0,8888) Farmer age (0,5359) Crops output (0,8853)
Income from crops (0,9532) Wheat (0,9504)
Oats (-0,4518) Triticale (0,3252) Grain mix (-0,4911)
Protein (0,3760) Sugar beet (0,7195)
Rape (0,9341) Field vegetable (0,5970)
Other crops (-0,5426) In land (0,6301)
In tractor (-0,335) In harvester (0,5447)
Figure 6: Correlation between fertilisers use and different factors at family farms in Lithuania.
Source: own composition
from 20 to 90 in different regression models, also indicating potential multicollinearity problems.
The results of the regression models confirm that the use of fertiliser is strongly related to cultivated plants. As we can see from Table 2, the results of the regression models in the Lithuanian case identify similar factors as the correla- tion coefficients. However, there were some differences. The regression model showed that the quality of land, harvesters, investment in land and various crops (wheat, rye and field vegetables) are still important. However, other factors with strong regression coefficients (investment in tractors and harvesters, economic size, farmer age, and other) did not fit into the regression model in the Lithuanian case.
The regression models were very different in all selected countries analysed. The relationship between the use of the fertiliser and agricultural machinery only existed in Lithu- ania and Portugal. 1 euro investment in agricultural machin- ery increased the fertiliser use by 1.742 in Portugal and by 0.139 in Lithuania. In the Lithuanian case, the regression model showed that 1 euro of investment in land increased the
use of fertiliser by 0.381. In the case of Malta, the regression model showed that 1 euro of investment in land increases the use of fertiliser by 0.016. This showed that investment is a more influential factor related to the use of fertiliser more in Lithuania than in Malta. No other selected country exhibits a relationship between the use of fertiliser and agricultural machinery or investment.
The results showed that subsidies were not important for fertiliser use for Lithuania. This was confirmed both by the correlation coefficient and the regression model. The com- parison of other countries’ regression models with the Lithu- anian regression model shows that subsidies have a relation- ship with the use of fertiliser in Latvia, Portugal, Austria, and Malta. 1 euro subsidy on dairy increase the use of fertiliser by 0.871, on other livestock by 0.263, and on other issues by 0.270 in Latvia. As we see, the subsidies are not properly distributed as subsidies promote unsustainable agriculture practices in Latvia. A different situation exists in Portugal, Austria, and Malta as subsidies decrease the use of fertiliser.
Table 2: Factors influencing fertiliser use.
Country Model Coefficient p-value R-squared VIF Std. Error
Lithuania
Constant Wheat output
Harvesters Rye output Land quality Investments in land Field vegetables output
-136.014 0.257 0.139 -0.973 3.625 0.305 0.479
0.003 0.000 0.044 0.320 0.003 0.003 0.019
0.958
5.246 6.004 1.116 3.587 2.299 1.899
13.097
Latvia
Constant Oil-seed crops output
Subsidies dairying Vegetables and flowers output
Potatoes output Other subsidies Fruit output Other live stock subsidies
16.914 0.664 0.871 0.204 -0.561 0.270 -0.640 0.263
0.001 0.000 0.000 0.000 0.000 0.001 0.004 0.023
0.974
4.775 1.376 1.563 2.068 1.662 1.557 2.521
8.714
Portugal
Constant
Machinery and building current costs Oil-seed crops output
Forage crops output Subsidies other cattle
Fruit output
Total support for rural development
31.879 1.742 0.981 -0.495 -0.753 0.148 -0.162
0.004 0.000 0.000 0.000 0.001 0.000 0.007
0.965
6.073 2.756 4.473 1.457 3.324 2.393
14.648
Austria
Constant Total output
Total support for rural development Wine and grapes output
35.216 0.039 -0.164 -0.084
0.013 0.000 0.000 0.002
0.951 5.514
2.737 5.815
7.777
Belgium
Constant Buildings Olives and olive oil
Other crop output Forage crops
50.096 0.025 -20.0269 0.128 0.183
0.000 0.000 0.001 0.001 0.320
1.000 1.283
1.392 1.550 1.099
16.071
Netherlands
Constant Economic size Land, permanent crops and quotas
Wine and grapes output Farm Net Income Oil-seed crops output
26.548 0.330 0.002 177.923 -0.019 5.305
0.037 0.000 0.000 0.003 0.004 0.011
0.974
4.441 1.517 1.171 3.317 1.390
12.719
Malta
Constant
Total output crops and crop production Total OGA output
Gross Investment Buildings LFA subsidies
186.915 0.040 -0.136 0.016 -0.001 -0.533
0.001 0.000 0.000 0.000 0.002 0.024
0.812
1.549 1.172 2.303 3.005 1.215
62.755
Source: own composition
The literature review showed that the use of fertiliser depends on the size of the family farm and in some cases, small family farms tend to be more sustainable. The results of the empirical research confirmed that this factor was important only in the Netherlands. The results of the empiri- cal research did not confirm the theoretical assumptions that the size of the family farm had an influence on fertiliser use.
Conclusions
The aim of this research was to ascertain the significant factors affecting fertiliser use by family farms in Lithuania with a view to the possible introduction of a fertiliser tax.
The comparison of the regression models between countries and Lithuania shows that the models are very different. Dif- ferences can be caused by regions, cultures, policies, farming practices and others issues. Therefore, to regulate the use of fertilisers by setting a fertiliser tax, it is necessary to take into account country-specific features. The factors influencing the use of fertiliser on family farms in Lithuania are invest- ment in land, land quality, and the planting of crops such as wheat, oats, sugar beet, and field vegetables. Identical factors were not found for other selected countries. Likewise, not all factors analysed in the literature review were validated in countries’ regression models.
The main limitation of the research is that FADN data for the different types of fertilisers (nitrogen, phosphorus and potassium) were started to be collected in 2014. In our research, we did not take into account different types of fer- tilisers. The results of various empirical research reveal that taxation can affect the use of fertilisers differently and tax base is built on different types of fertiliser use (Uri, 1998;
Gazzani, 2017). Therefore, this needs to be evaluated and re-analysed in future research. However, there are also con- troversies whether it is appropriate to set a fertiliser tax base separately for each type of fertiliser. It is easy to manipulate by types of fertilisers based on their costs.
The empirical research revealed that Lithuanian micro and small family farms used less fertilisers and were more productive in some cases than large family farms. However, the regression model did not confirm this. The results might have been influenced by the problem of expanding farm sizes in the EU. Also, micro family farms which use sim- plified accounting entries were not included in the FADN database of Lithuania. As a result, we are not sure to what extent micro family farms are sustainable.
Future studies might also consider the relationship between fertiliser tax rate and possible fertiliser reduction levels. Some studies disclose that a fertiliser tax rate between 10 per cent and 15 per cent may reduce the use of fertiliser by 5 percent (Gazzani, 2017). Further research could design a fertiliser tax rate and disclose influence on the productivity and financial results of the family farms’ agricultural produc- tion based on our regression models in Lithuania and in other countries analysed.
References
Akinwande, M.O., Dikko, H.G. and Samson, A. (2015): Variance inflation factor: as a condition for the inclusion of suppressor variable(s) in regression analysis. Open Journal of Statistics, 5 (7), 754–767. https://doi.org/10.4236/ojs.2015.57075 Altieri, M.A. (2009): Agroecology, small farms, and food sover-
eignty. Monthly Review, 61 (3), 102–113.
Birner, R. and Resnick, D. (2010): The political economy of poli- cies for smallholder agriculture. World Development, 38 (10), 1442–1452. https://doi.org/10.1016/j.worlddev.2010.06.001 Chen, C.F. and Chen, F.S. (2010): Experience quality, perceived
value, satisfaction and behavioral intentions for heritage tourists. Tourism Management, 31 (1), 29–35. https://doi.
org/10.1016/j.tourman.2009.02.008
Chowdhury, M.E. and Lacewell, R.D. (1996): Implications of alter- native policies on nitrate contamination of groundwater. Jour- nal of Agricultural and Resource Economics, 21 (1), 82–95.
https://www.jstor.org/stable/40986899
Čiulevičienė, V. and Kożuch, A.J. (2015): Effects of the environ- mental tax reforms. Management Theory and Studies for Rural Business and Infrastructure Development, 37 (4), 480–489.
http://doi.org/10.15544/mts.2015.40
Euractiv (2018): The future of fertilisers in Europe. Retrieved from https://en.euractiv.eu/wp-content/uploads/sites/2/special- report/EURACTIV-Event-Report-The-future-of-fertilisers-in- Europe.pdf (Accessed in September 2019)
Felloni, F., Wahl, T., Wandschneider, P. and Gilbert, J. (2001):
Infrastructure and agricultural production: cross-country evi- dence and implications for China. TW-2001-103. Washington State University: Pullman, USA.
Francis, D.D. (1992): Control mechanisms to reduce fertiliser ni- trogen movement into groundwater. Journal of Soil and Water Conservation, 47 (6), 444–448.
García, C.B., García, J., López Martín, M.M. and Salmerón, R.
(2015): Collinearity: Revisiting the variance inflation factor in ridge regression. Journal of Applied Statistics, 42 (3), 648–661.
https://doi.org/10.1080/02664763.2014.980789
Gazzani, F. (2017): Economic and Environmental Evaluation of Nitrogen Fertiliser Taxation: A Review. International Journal of Environment, Agriculture and Biotechnology, 2 (4), 1829–
1834. http://doi.org/10.22161/ijeab/2.4.47
Heady, C.J., Markandya, A., Blyth, W., Collingwood, J. and Taylor, P.G. (2000): Study on the relationship between environmental/
energy taxation and employment creation. Study prepared for the European Commission Directorate General XI. Retrieved from http://ec.europa.eu/environment/enveco/taxation/pdf/en- taxemp.pdf. (Accessed in July 2019)
Holm Pedersen, L. (2007): Ideas are transformed as they trans- fer: a comparative study of eco-taxation in Scandinavia.
Journal of European Public Policy, 14 (1), 59–77. https://doi.
org/10.1080/13501760601071653
Huang, D., Guan, P., Guo, J., Wang, P. and Zhou, B. (2008): Inves- tigating the effects of climate variations on bacillary dysentery incidence in northeast China using ridge regression and hierar- chical cluster analysis. BMC Infectious Diseases, 8 (130), 1–9.
https://doi.org/10.1186/1471-2334-8-130
Jongeneel, R.A. (2018): Research for AGRI Committee - The CAP support beyond 2020. Assessing the future structure of direct payments and the rural development interventions in the light of the EU agricultural and environmental challenges Policy. European Union, 2018. Retrieved from http://www.
europarl.europa.eu/RegData/etudes/STUD/2018/629174/
IPOL_STU(2018)629174_EN.pdf. (Accessed in August 2019) Karatay, Y.N. and Meyer-Aurich, A. (2018): A model approach for
yield-zone-specific cost estimation of greenhouse gas mitiga-
tion by nitrogen fertiliser reduction. Sustainability, 10 (3), 710–728. https://doi.org/10.3390/su10030710
Končius, D. (2007): The Effect of Periodical Liming and Fertili- zation on the Forms of Phosphates and on the Changes in its Fractional Composition in the Soil. Zemdirbyste/Agriculture, 94 (1), 74–88.
Kostov, P., Davidova, S. and Bailey, A. (2019): Comparative ef- ficiency of family and corporate farms: does family labour matter?. Journal of Agricultural Economics, 70 (1), 101–115.
https://doi.org/10.1111/1477-9552.12280
Kozlovskaja, A. (2012): Agricultural small and large producers financing impact on innovations and activity results. Manage- ment Theory and Studies for Rural Business and Infrastructure Development, 32 (3), 69–80.
Ladha, J.K., Pathak, H., Krupnik, T.J., Six, J. and van Kessel, C.
(2005): Efficiency of fertiliser nitrogen in cereal production:
retrospects and prospects. Advances in Agronomy, 87, 85–156.
https://doi.org/10.1016/S0065-2113(05)87003-8
Mengel, K., Hütsch, B. and Kane, Y. (2006): Nitrogen fertiliser ap- plication rates on cereal crops according to available mineral and organic soil nitrogen. European Journal of Agronomy, 24 (4), 343–348. https://doi.org/10.1016/j.eja.2005.12.001 Mergos, G.J. and Stoforos, C.E. (1997): Fertiliser demand in
Greece. Agricultural Economics, 16 (3), 227–235. https://doi.
org/10.1016/S0169-5150(97)00013-3
Mottershead D., Hart K., Maréchal A., Meredith S., Lorant A., Bas-Defossez F., Baldock, D., Bureau, J.C. and Matthews, A.
(2018). Research for AGRI Committee - Towards the CAP post 2020 - Appraisal of the EC Communication on ‘The Future of Food and Farming’ of 29 November 2017. Brussels, Belgium.
Retrieved from: http://www.europarl.europa.eu/RegData/
etudes/STUD/2018/617476/IPOL_STU(2018)617476_EN.pdf (Accessed in June 2019)
Pearce, D. and Koundouri, P. (2003): Fertiliser and pesticide taxes for controlling non-point agricultural pollution. Agricultural and Rural Development Department, World Bank Group, Washington DC, USA.
Rehman, A., Jingdong, L., Khatoon, R., Hussain, I. and Iqbal, M.S. (2017): Modern agricultural technology adoption its im- portance, role and usage for the improvement of agriculture.
Life Science Journal, 14 (2), 70–74. https://doi.org/10.7537/
marslsj140217.10
Ricker-Gilbert, J. and Jayne, T.S. (2012): Do fertiliser subsidies boost staple crop production and reduce poverty across the dis- tribution of smallholders in Africa? Quantile regression results from Malawi. In Selected paper prepared for presentation at the International Association of Agricultural Economists (IAAE) Triennial Conference, Foz do Iguaçu, Brazil (pp. 18–24). htt- ps://doi.org/10.22004/ag.econ.126742
Rosset, P. (2000): The multiple functions and benefits of small farm agriculture in the context of global trade negotiations. Develop- ment, 43 (2), 77–82. https://doi.org/10.1057/palgrave.develop- ment.1110149
Rougoor, C.W., Van Zeijts, H., Hofreither, M.F. and Bäckman, S.
(2001): Experiences with fertiliser taxes in Europe. Journal of Environmental Planning and Management, 44 (6), 877–887.
https://doi.org/10.1080/09640560120087615
Savci, S. (2012): An agricultural pollutant: chemical fertiliser. Inter- national Journal of Environmental Science and Development, 3 (1), 77–80. https://doi.org/10.7763/IJESD.2012.V3.191 Singh, B. and Jajpura, L. (2016): Sustainable agriculture: a key to
the healthy food and better environment, economic prosperity for farmers and a step towards sustainable development. Inter- national Journal of Current Microbiology and Applied Sciences, 5 (1), 148–156. http://doi.org/10.20546/ijcmas.2016.501.012 Söderholm, P. and Christiernsson, A. (2008): Policy effectiveness
and acceptance in the taxation of environmentally damag- ing chemical compounds. Environmental Science and Policy, 11 (3), 240–252. https://doi.org/10.1016/j.envsci.2007.10.003 Udeigwe, T.K., Teboh, J.M., Eze, P.N., Stietiya, M.H., Kumar, V.,
Hendrix, J. and Kandakji, T. (2015): Implications of leading crop production practices on environmental quality and human health. Journal of Environmental Management, 151, 267–279.
https://doi.org/10.1016/j.jenvman.2014.11.024
Uri, N.D. (1998): Environmental considerations in the fertiliser use decision. Environmental Geology, 34 (2-3), 103–110. https://
doi.org/10.1007/s002540050260
Vitunskienė, V. (2014): The role of CAP payments in supporting farms income in Lithuania and the European Union as a whole.
Science and Studies of Accounting and Finance: Problems and Perspectives, 9 (1), 281–289. https://doi.org/10.15544/
ssaf.2014.31
Vojtech, V. (2010): Policy measures addressing agri-environmental issues. OECD Food, Agriculture and Fisheries Papers. No. 24.
OECD, Paris, France.
Von Blottnitz, H., Rabl, A., Boiadjiev, D., Taylor, T. and Ar- nold, S. (2006): Damage costs of nitrogen fertiliser in Eu- rope and their internalization. Journal of Environmental Planning and Management, 49 (3), 413–433. https://doi.
org/10.1080/09640560600601587
Wunderlich, G. (1997): Land Taxes in Agriculture: Preferential Rate and Assessment Effects. American Journal of Economics and Sociology, 56 (2), 215–228.
Zhang, W.F., Dou, Z.X., He, P., Ju, X.T.,Powlson, D., Chadwick, D.
and Chen, X.P. (2013): New technologies reduce greenhouse gas emissions from nitrogenous fertiliser in China. Proceedings of the National Academy of Sciences, 110 (21), 8375–8380.
https://doi.org/10.1073/pnas.1210447110