r/( jt- 333
KFKI-1977-65
I , JÁNOSSY
L, ВАТА
STUDY OF ELASTIC PROPERTIES NEAR A NEMATIC-SMECTIC A TRANSITION
H u n g a ria n ^Academy o f ^Sciences CENTRAL
RESEARCH
INSTITUTE FOR PHYSICS
B U D A PE S T
KFKI-1977-65
STUDY OF ELASTIC PROPERTIES NEAR A NEMATIC-SMECTIC A. TRANSITION
I. Jánossy and L. Bata
Central Research Institute for Physics H-1525 Budapest P.O.B. 49., Hungary
Presented, at the Second Liquid Crystal Conference of Socialist Countries. Sunny Beach, Bulgaria, 27-30. Septembe
1977.
HU ISSN 0368-5330 ISBN 963 371 296 3
biphenyl near the nematic-smectic A transition are presented. The pretransi- tional increase of obeys the relation iSK^ ^ (T-T v , with V = 1.
АННОТАЦИЯ
Были измерены константы упругости деформации поперечного и продольного изгиба на октил-циано-бифениле. Вблизи нематико-смектического перехода уве
личивается по закону <5К^ ( Т - Т ^ ) , где v - 1.
KI VONAT
Oktil-ciano bifenil feszitési és hajlitási rugalmas állandóját mér
tük a nematikus-szmektikusA átmenet közelében. K, növekedése a fázisátmenet közelében a SK^ ^ (т-Tg^) , \> = 1 összefüggésnek tesz eleget.
1 . Introduction
In the last few years a large number of substance have been syntetised, which exhibit second order or weakly first order nematic-smectic A transition. Near transitions of these types pretransitional phenomena are observed in the nematic range, which are due to the presence of small clusters in which the smectic order has already developed.
A tipical pretransitional effect is the temperature d e pendence of the Frank-elastic constants near the transition.
While the splay elastic constant (K^) does not show any sharp change, the twist (K2) and bend (K^) elastic constants in
crease rapidly as the transition temperature is approached.
This fact is explained by the structure of the smectic A phase; in this phase only splay is allowed, twist and bend are forbidden. The gradual appearance of regions w i t h smectic order in the nematic phase leads to the increase of K 2 and
A number of measurements of the bend and twist elastic constants near nematic-smectic A transitions have been re
ported recently. The data are usually interpreted by assuming that the increment of or К 2 is proportional to some power of T-TgN (TgN transition temperature):
6 К 3 '■ <Т - T SN>‘V /1/
Different authors have found different values for v ; e.g. P.Cladis on CBOOA v = 0.52 [1] ; Pindak et. al. also on CBOOA v = 0.68 [2]; Cheung and Meyer on p-butoxybenzyli- dene-p'-ß methylbutylaniline, which has a weakly first order nematic-smectic A transition, have found v = 1 [3] . These data indicate the necessity of further experiments in order to clarify the situation.
In the present paper we report measurements of and K 3 on octyl-cyano-biphenyl (OCB). The material, syntetised in our laboratory, has a weakly first order nematic-smectic A tran
sition at 30.9 °C; the nematic-isotrop transition was found to be at 37.6 °C.
The elastic constants have been determined by measuring the amplitude of the splay deformation, induced by an electric field in a homogenously aligned sample. In the measurements the field has been kept constant and the temperature scanned.
As described in detail in Sec. 2., this method gives a precise determination of the transition temperature, and a check
whether the transition is of first or of second order. The measurements provide the anisotropy of the refractive indices also. The results are analysed in Sec. 3.
3
In Sec. 4. we describe the structures obtained in the smectic phase by cooling down the sample in a deformed st a t e .
2. Experimental method
In the experiments homogenously aligned sandwich-cells have been used (director parallel to the boundaries of the c e l l ) . OCB has a large positive dielectric anisotropy, thus the alignment can be deformed by an electric field. The theory of deformation in electric field has been published in [4J .
The deformation starts at a threshold voltage
For small deformations the angle between the director and the boundaries (0 ) is
/2/ a
0 = 0 sin ^rZ ( L sample thickness)
m jj /3/
0^ and the applied voltage, V, are related as
cr /4/
In the experiments ©m has been determined by measuring the
optical phase difference ( Дф ) between the ordinary and extraordinary components of a laser beam. For small d e f orma
tions
1 n
о n (n +n )
e v e o 7
Дф - Дф
К
with Дф = ДДь (n -n ) то A v e о 7
/5/
Thus measuring Дф as a function of V, and can be determined. From the measurement of ДФ0 , Дп = ng - nQ can be calculated. (In principle ng and nQ should be
known separately for the calculation of K^. However the factor 2
n /n (n +n ) changes little with the change of n^ , and
о e^ e о' о
nQ itself changes little with the temperature. In the c a l culation we have put n = 1.5.) The dielectric data are taken
о from [5] .
The approximation for small deformations presented above, works well only for K 3/K^ ^ 1 . For higher K^/K-j ratios ( > 3)
it is hard to measure in the limit where this approximation is valid. Thus near the transition, where K^/K.^ increases rapidly, the elastic constants were determined by comparing the m e a sured data with exactly calculated Дф(у) curves.
In the actual measurements the applied voltage has been fixed and the temperature has been decreased with a rate of
5
% 0.05°/min. The intensity of the laser beam which gives Дф is recorded on an X-Y recorder as the function of the t e m perature. A tipical plot is given on Fig. 1. As it can be seen, this method gives a precise determination of the tran
sition temperature, T g N . T gN has been reproduced in different runs within 0.02°.
Fig. 1.
Another advantage of this method is that it provides a sensitive check, whether the transition is of second or of first order. At a strictly second order transition goes to infinity, consequently 0^ becomes zero, i.e. Дф = 0фо . In our measurements a small difference was found between Дф and Дфо at the transition when field have been applied. This fact
clearly demonstrates the first-order character of the tran
sition .
3. Results and discussion
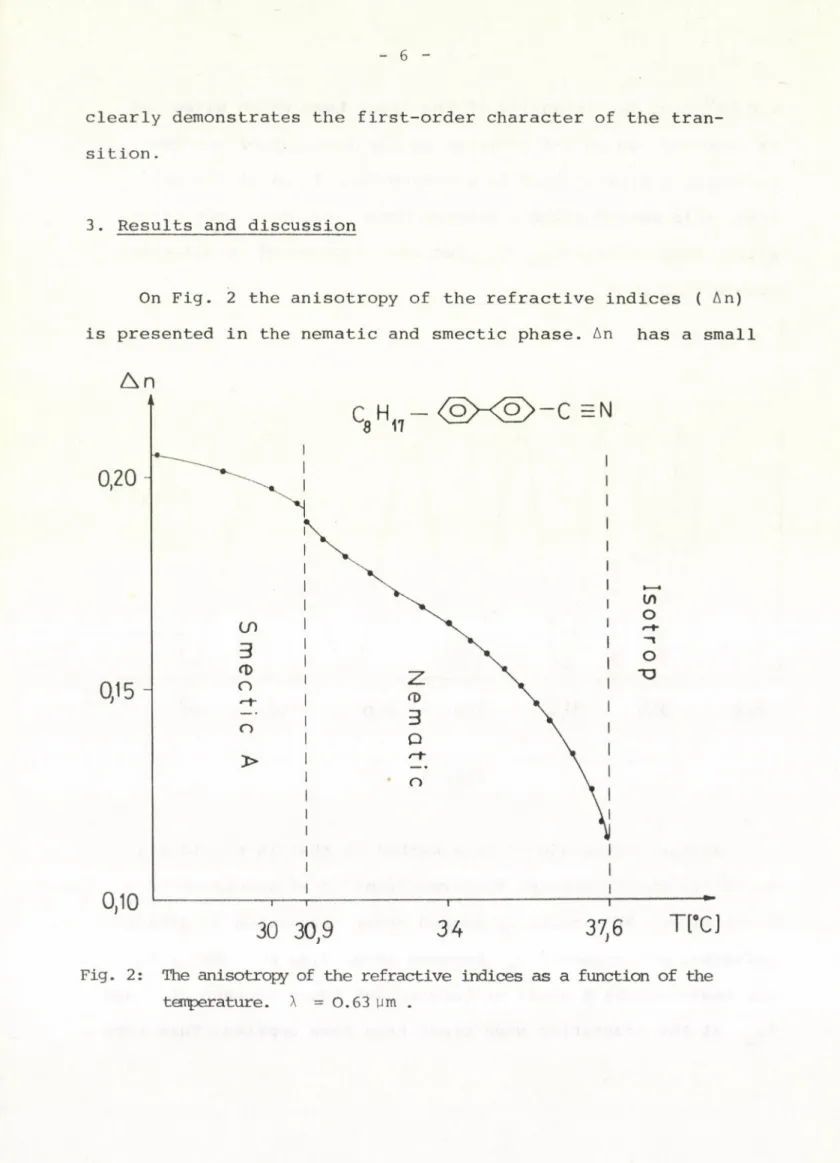
On Fig. 2 the anisotropy of the refractive indices ( An) is presented in the nematic and smectic phase. An has a small
A n
Fig. 2: The anisotropy of the refractive indices as a function of the temperature. A = 0.63 ym .
discontinuity ( ^ 1 %) at T g N , which indicates again that the transition is weakly first order.
The anisotropy of the refractive indices is in good approximation proportional to the orientational order para
meter. The shape of the An curve presented here agrees qualitatively with McMillan's calculation of the order para
meter [9]. However a deviation is found also; the curve has an inflexion at about the same temperature where the pretran- sitional effects appear. From this fact we conclude that the presence of small smectic regions has an observable influence on the orientational order parameter already in the nematic phase. This influence is neglected in McMillan's theory.
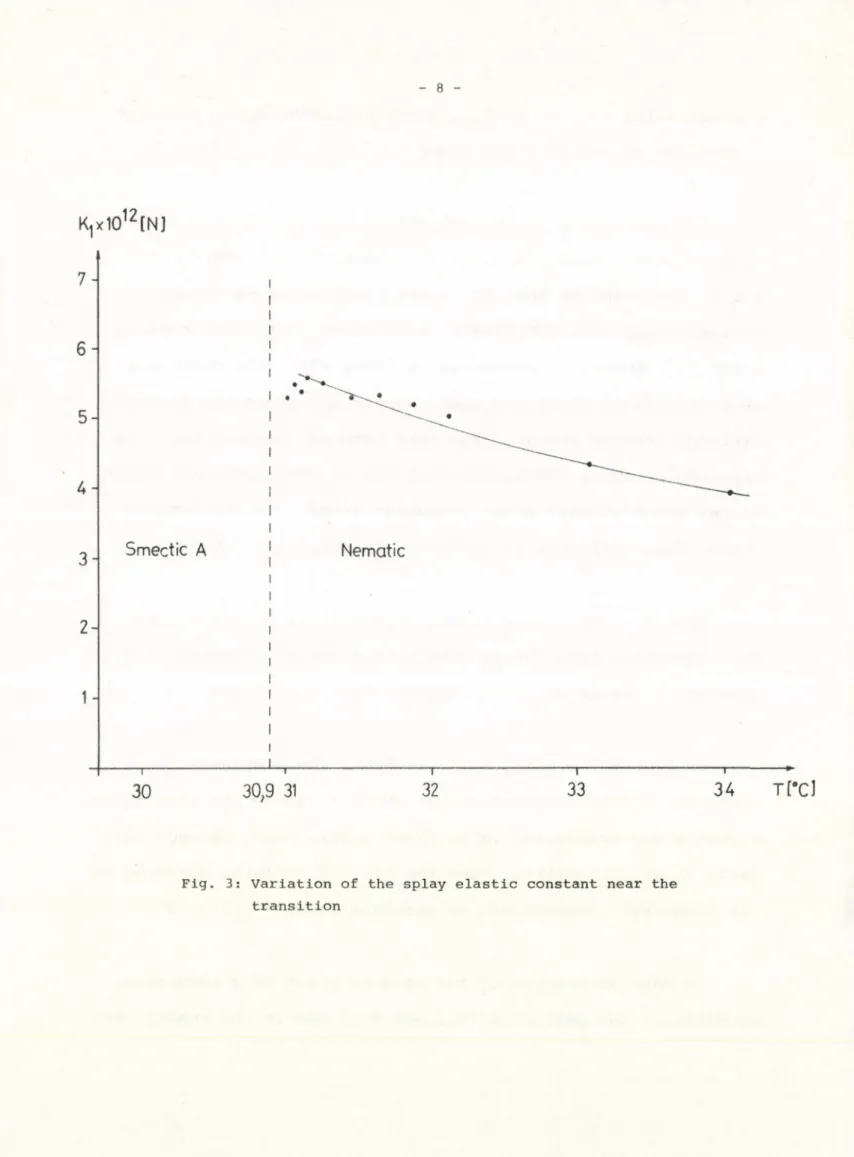
On Fig. 3 the splay elastic constant is presented near the transition temperature. There is a slight increase of , however, as excepted, no divergence have been found.
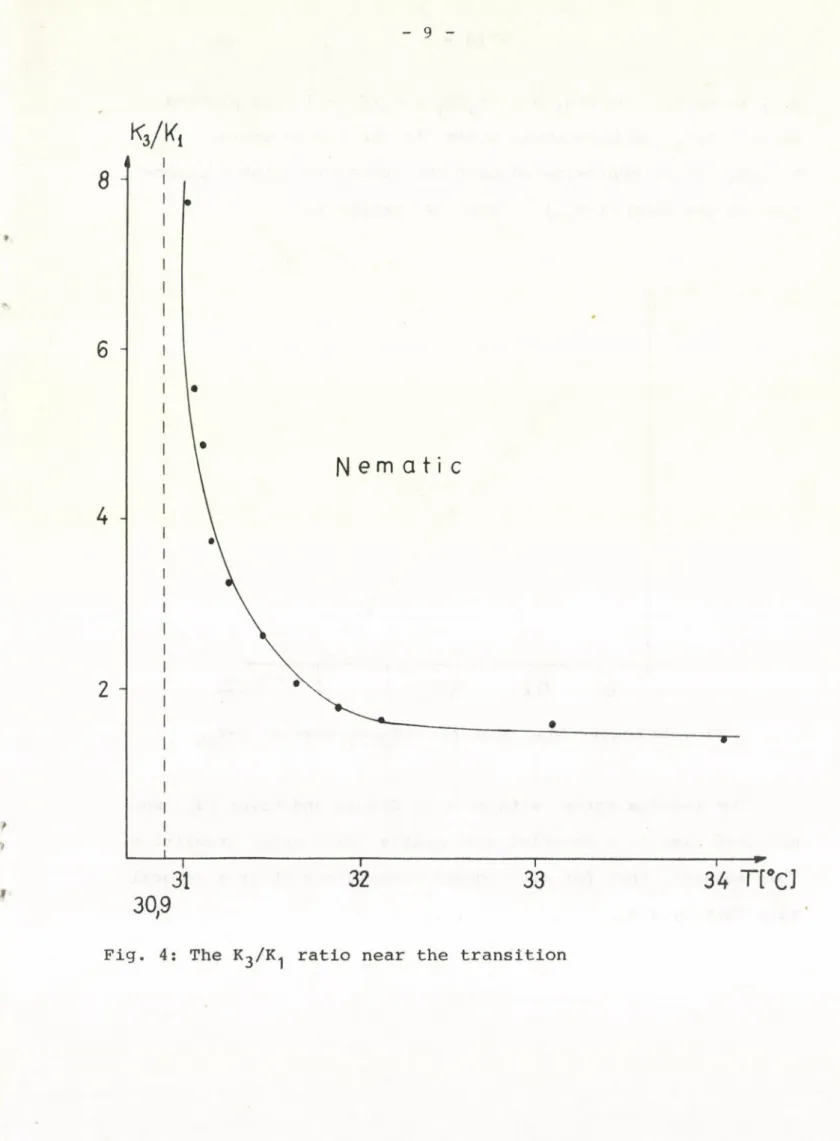
On Fig. 4 the K^/K^ ratio is áiown. The pretransitional increase of this ratio starts at about 1° above the transition.
Although the transition is of first order, K^/K^ becomes very large at the transition. From the Лф - Лфо values, measured at the transition temperature we estimate K-^/K-] ^ s n> ^
To make an analyse of the data in terms of a power-law, we estimate the part of K ^ / K ^ , which is due to the nematic or-
Fig. 3: Variation of the splay elastic constant near the transition
TfeJ
9
» ->
f
Кз/Ki
31 32 33 34 T [#cJ
30,9
Fig. 4: The K^/K^ ratio near the transition
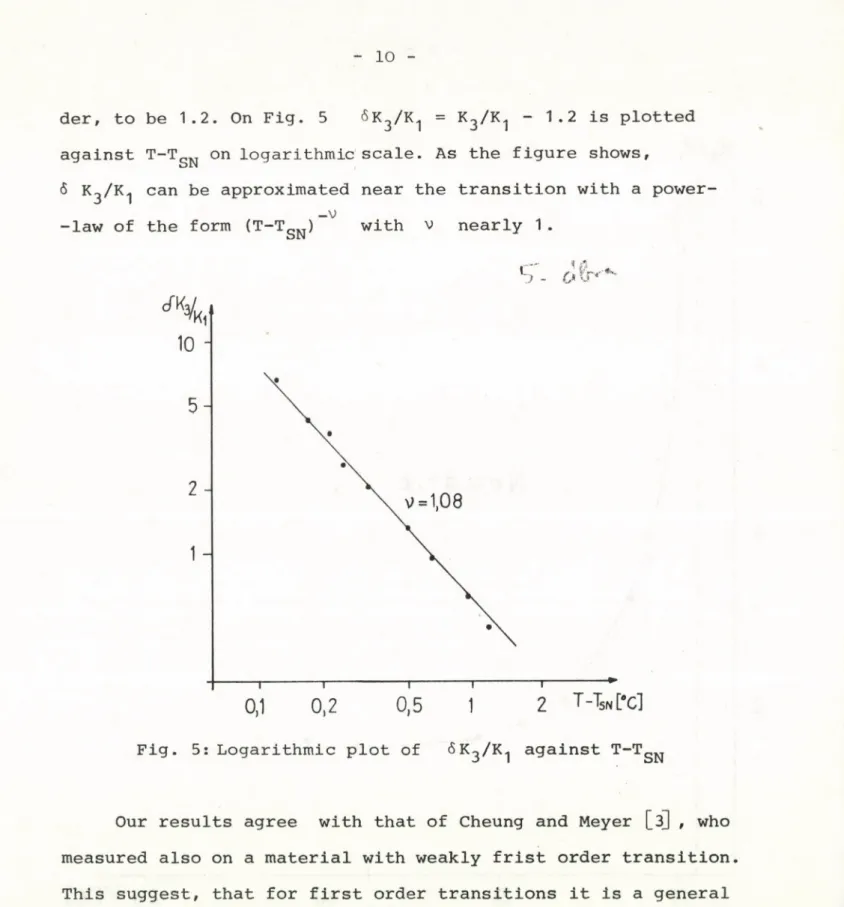
against T-TSN on logarithmic scale. As the figure shows,
5 K3/К3 can be approximated near the transition with a power- _v
-law of the form (T-TSN) with v nearly 1.
* A
S - C* Vr*' *'-
Fig. 5: Logarithmic plot of őK^/K^ against T-TgN
Our results agree with that of Cheung and Meyer
[з]
, whomeasured also on a material with weakly frist order transition.
This suggest, that for first order transitions it is a general rule that v = 1 •
11
4. "Frozen in" structure in smectic phase
As mentioned in the previous sections, when the sample is cooled in the presence of a deformation, induced by an elec
tric field, the deformation does not disappear when the tran
sition temperature is reached. At the transition we have
0 = 0m<V 'TSN > sinE Z -
It has been found, that this deformation freeze in if 0 m is not too large, i.e. it remains unchanged in the smectic phase even after the field is suppressed. This effect has been deduced from the birefringent measurements; the optical phase difference follows the same temperature dependence as A<J>q , but it is shifted with the value Афо (TgN) - Аф (Tg N ) .
It is confirmed by conoscopic observations also; the hiperbola are shifted when the phase transition is passed in a deformed state.
The arrangement of the smectic planes in the undeformed ( Qm = 0) and deformed ( 0 m ф О) states are shown on Fig. 6.
The deformation is mainly splay, however a weak bend is also present (proportional to 0 О ). Such a structure can be sta
in
bilised by formation of edge dislocations [б] . A relaxation to the homogenous orientation is not possible, as it would imply a hydrodynamic motion in which the planes had to split.
I I
a.; b.;
Fig. 6: Undeformed (a./) and deformed (b -/ ) smectic planes. --- - director; - - - planes.
We note that this type of deformation is different from the Parodi-type transition [7j . In the latter case a periodic array of defects is formed, while in our case the deformation is homogenous in the plane of the sample.
As 0 is increased, a growing number of focal conics m
are formed in the smectic phase, making impossible birefringent measurements. As observed in polarising microscope, the ec
centricity of the focal conics is decreasing as the deformation is increased. This is explained by the relation between the eccentricity of the ellipse (r) and the orientation in the middle of the sample, given in [8]:
ctg20 = r 2 - 1
^ m
When is small, r is large (elongated focal conics);
13
as 0 -* И , г
■ +1, i.e. the e l l i p s e b e c o m e s a circle,
m 2
It has been found that reheating the sample to nematic phase the contours of the focal conics remain visible at the surfaces of the cell. This fact indicates that the formation of focal conics alter slightly the surface orientation also.
Acknowledgements
We wish to thank Dr. K.Ritvay and K.Pinter for synthesis of O C B . We thank G.Szabó, József Attila University, Szeged, for his help in studying the smectic textures.
REFERENCES 1234*[б]
[1] P.E.Cladis: P h y s .Rev.Lett. 3±, 1200 (1973)
[2] R.S.Pindak et al.: P h y s .R e v .L e t t . 32, 43 (1974) [3] L.Cheung and R.B.Meyer: Phys.Lett. 4 3 A , 261 (1973) [4] L.Bata et al.: Solid State Comm. 1J5, 647 (1974) [53 L.Bata and A.Buka: this conference
[б] de Gennes: The physics of liquid crystals, Claredon Press, 1974, p.300
[7 I M.Goscianski et al.: J.Physique Lett. 26/ L-31 3 (1975) И C.Williams and M.Kleman: J.Physique Lett. 2^/ L-33 (1974) [93 W.L. McMillan: Phys. Rev. A. ^4, 1238 (1971)
!
Nyelvi lektor : Szabón János
Példányszám: 300 Törzsszám: 77-834 Készült a KFKI sokszorosító üzemében Budapest, 1977. augusztus hó