water
Article
Comparing the Adsorption Performance of
Multiwalled Carbon Nanotubes Oxidized by Varying Degrees for Removal of Low Levels of Copper, Nickel and Chromium(VI) from Aqueous Solutions
Marko Šoli´c1, Snežana Maleti´c1,* , Marijana Kragulj Isakovski1, Jasmina Niki´c1 , Malcolm Watson1, Zoltan Kónya2,3 and Jelena Triˇckovi´c1
1 Department of Chemistry, Biochemistry and Environmental Protection, Faculty of Sciences, University of Novi Sad, Trg Dositeja Obradovi´ca 3, 21000 Novi Sad, Serbia; marko.solic@dh.uns.ac.rs (M.S.);
marijana.kragulj@dh.uns.ac.rs (M.K.I.); jasmina.nikic@dh.uns.ac.rs (J.N.);
malcolm.watson@dh.uns.ac.rs (M.W.); jelena.trickovic@dh.uns.ac.rs (J.T.)
2 Department of Applied and Environmental Chemistry, University of Szeged, Rerrich Béla tér 1, H-6720 Szeged, Hungary; konya@chem.u-szeged.hu
3 MTA-SZTE Reaction Kinetics and Surface Chemistry Research Group, Rerrich Béla tér 1, H-6720 Szeged, Hungary
* Correspondence: snezana.maletic@dh.uns.ac.rs; Tel.:+381-21-485-2727
Received: 31 January 2020; Accepted: 3 March 2020; Published: 6 March 2020 Abstract:Functionalized multiwalled carbon nanotubes (MWCNTs) have drawn wide attention in recent years as novel materials for the removal of heavy metals from the aquatic media. This paper investigates the effect that the functionalization (oxidation) process duration time (3 h or 6 h) has on the ability of MWCNTs to treat water contaminated with low levels of Cu(II), Ni(II) and Cr(VI) (initial concentrations 0.5–5 mg L−1) and elucidates the adsorption mechanisms involved. Adsorbent characterization showed that the molar ratio of C and O in these materials was slightly lower for the oxMWCNT6h, due to the higher degree of oxidation, but the specific surface areas and mesopore volumes of these materials were very similar, suggesting that prolonging the functionalization duration had an insignificant effect on the physical characteristics of oxidized multiwalled carbon nanotubes (oxMWCNTs). Increasing the Ph of the solutions from Ph 2 to Ph 8 had a large positive impact on the removal of Cu(II) and Ni(II) by oxMWCNT, but reduced the adsorption of Cr(VI).
However, the ionic strength of the solutions had far less pronounced effects. Coupled with the results of fitting the kinetics data to the Elowich and Weber–Morris models, we conclude that adsorption of Cu(II) and Ni(II) is largely driven by electrostatic interactions and surface complexation at the interface of the adsorbate/adsorbent system, whereas the slower adsorption of Cr(VI) on the oxMWCNTs investigated is controlled by an additional chemisorption step where Cr(VI) is reduced to Cr(III). Both oxMWCNT3h and oxMWCNT6h have high adsorption affinities for the heavy metals investigated, with adsorption capacities (expressed by the Freundlich coefficientKF)ranging from 1.24 to 13.2 (mg g−1)/(mg l−1)n, highlighting the great potential such adsorbents have in the removal of heavy metals from aqueous solutions.
Keywords: adsorption; heavy metals; carbon nanotubes; adsorption mechanism
1. Introduction
Heavy metals, as naturally occurring elements, can originate from both natural and anthropogenic sources. However, the increasing release of these pollutants in more toxic and mobile forms has made
Water2020,12, 723; doi:10.3390/w12030723 www.mdpi.com/journal/water
Water2020,12, 723 2 of 18
anthropogenic sources a worldwide issue [1]. The main anthropogenic sources of heavy metals in the aquatic environment can be attributed to urbanization, industrialization (in particular the wastewater of modern chemical plants) and certain agricultural activities [1,2]. Metal processing and mining contribute to 48% of the total release of contaminants by the European industrial sector [3]. Heavy metals cannot undergo biodegradation processes and accumulate in the environment and living organisms at all levels of the food chain, making this group of pollutants even more noteworthy.
A number of health problems may result from human exposure, intake and eventual buildup of non-essential (e.g., Cr(VI) and Ni) and even essential heavy metals (e.g., Cu) [2,4,5].
For this reason, the permissible concentrations of toxic elements in drinking water, surface waters and wastewaters before discharge to recipients, are set to very low levels. For example, the WHO provisional guideline values for Cu, Ni and Cr are 2 mg L−1, 0.07 mg L−1and 0.05 mg L−1, respectively [6]. Emission levels for those metals in the most wastewater streams, according to the best available technologies, have been limited in the range of 0.01 to the 0.5 mg L−1[7,8].These concentrations are low, and thus, further treatment in order to comply with legislation is a difficult task. Conventional techniques such as chemical precipitation, coagulation and flocculation etc., are not efficient and are not able to remove low concentrations of target pollutants to permissible levels [2,9]. Techniques such as membrane filtration and ion exchange work well at low concentrations and achieve high efficacies, but suffer from disadvantages such as high operational cost and operational problems, etc. [1,10].
Adsorption can be an economically sustainable and viable solution for the removal of heavy metals from aqueous solutions. Adsorption has many advantages, such as simple operation, low cost, good Ph tolerance, and large industrial processing capacity [2,9,11,12]. However, there is still a need to develop and study new adsorbents, as many of the commonly applied adsorbent materials (activated carbons, zeolites, clay minerals, solid by-products of industrial processes and biosorbents) do not show satisfactory performance for the removal of heavy metals present in low concentrations [10].
Nanomaterials and especially carbon nanotubes (CNT) stand out as particularly promising materials to meet the requirements outlined above [4,10,11,13,14]. In order to achieve the desired level of efficiency for heavy metal removal, CNT functionalization has been widely investigated in recent years. The functionalization of CNT has already led to the development of new adsorbents for aqueous heavy metal treatments with state-of-the-art performance [10]. Even so, many review papers have recognized gaps in the current knowledge, whereby the majority of studies conducted concern the adsorption of very high concentrations of the heavy metals investigated, or do not explore the effects of preparation conditions on the functionalized nanomaterials (such as oxidation process duration, etc.) or the combined effects of different parameters on the adsorption process, or do not investigate the potential mechanism and chemistry involved in the heavy metals removal [1,4,10,11,13–16]. Oxidation of CNT is one of the simplest and therefore most economically viable functionalization techniques [10].
Regarding the removal of heavy metals such as Cu(II), Ni(II) and Cr(VI) by CNT, the literature data is very limited, with papers which deal with just one level of CNT oxidation and which investigate adsorption at high concentration levels above 10 mg L−1[17–23].
The aim of this paper was therefore to investigate how the duration of the oxidation process of multiwalled carbon nanotubes (oxMWCNT3h or oxMWCNT6h) effects their use for the treatment of water contaminated with low levels of Cu(II), Ni(II) and Cr(VI), and to give insight into the adsorption mechanism of these metals on the oxidized MWCNTs. In order to achieve this goal, the synthesized adsorbents have been extensively characterized and the adsorption process was characterized by examining the contact time, the heavy metals concentration, and the Ph and ionic strength of the solutions.
2. Materials and Methods
2.1. Materials and Chemicals
Oxidized multiwalled carbon nanotubes (oxMWCNTs) were synthesized (by chemical vapour deposition) at the University of Szeged, according to the method described elsewhere [24].
Water2020,12, 723 3 of 18
Functionalization of MWCNTs was also carried out at the aforementioned institution under varying conditions to provide two different adsorbents for this study, following this procedure: (Step 1) 10 g of pristine MWCNTs was mixed with 1 L of cc. HNO3for 1 h by means of magnetic stirring, (Step 2) the obtained suspension was oxidized under reflux for 3 h (oxMWCNT3h) or 6 h (oxMWCNT6h), then (Step 3) rinsed with eionized water until neutral Ph was obtained. The oxMWCNTs selected for this study were then used as received. Stock solutions of Cu(II) and Ni(II) (100 mg L−1) were prepared by diluting the appropriate metal standard solutions (1000 mg L−1), while the Cr(VI) stock solution (100 mg L−1) was obtained by dissolving K2Cr2O7in deionized water. The stock solutions were further diluted to the desired metals concentrations. All chemicals used in this research were analytical grade and were purchased from Merck Co. The experiments were performed using ultrapure deionized water (resistivity not less than 17.5 MΩ).
2.2. Adsorbents Characterisation
The specific surface areas, pore sizes, pore volumes and pore-size distributions of the investigated adsorbents were determined from nitrogen adsorption/desorption isotherms at 77 K, acquired by the AutosorbiQ Surface Area Analyzer (Quantachrome Instruments, USA). The specific surface areas were calculated using the multi-point Brunauer–Emmett–Teller (BET) method, while meso and micro pore volumes were obtained by the utilization of the desorption Barrett–Joyner–Halenda (BJH) isotherms and t-test method, respectively. Scanning electron microscopy (SEM) (TM3030, Hitachi High-Technologies, Japan) coupled with energy dispersive spectrometry (EDS) (Bruker Quantax 70 X-ray detector system, Bruker Nano, GmbH Germany) and transmission electron microscopy (TEM) (Philips CM10) were used to examine the materials morphological structures and surface elemental compositions. Identification of the functional groups present on the oxMWCNT3h and oxMWCNT6h was carried out by Fourier transform infrared (FTIR) spectrometry (Thermo-Nicolet Nexus 670 (USA) FTIR spectrometer), in the 4000–400 cm–1 range and in a diffuse reflection mode at a resolution of 4 cm–1. The points of zero charge (pHpzc) of the adsorbents were obtained by adjusting the Ph value of 0.1 M NaNO3solutions in the range from 2 to 6, followed by measuring the Ph change of the NaNO3/oxMWCNTs mixtures after 24 h of contact.
2.3. Adsorption Experiments
All adsorption studies were carried out in batch experiments conducted according to the following general procedure: (Step 1) 5 mg of oxMWCNT3h or oxMWCNT6h was weighed into 40 Ml glass vials, (Step 2) 30 Ml of background solution (NaNO3) was added to each vial, (Step 3) oxMWCNT3h/NaNO3
and oxMWCNT6h/NaNO3 suspensions were subjected to 30 min of sonication (to enhance the dispersion of the adsorbents) (Ultrasons 1 litre bath), followed by stirring at 180 rpm (to pre-equilibrate oxMWCNTs and NaNO3) for 24 h, (Step 4) stock solutions of Cu(II), Ni(II) or Cr(VI) were spiked to achieve desired concentrations of selected heavy metals, (Step 5) the Ph of adsorption systems was adjusted by adding 0.1 and/or 0.01 M NaOH or HNO3, (Step 6) the adsorption systems were stirred for a certain period of time at 180 rpm and constant temperature of 298 K, (Step 7) the solid and liquid phases were separated by filtering the samples through 0.45µm cellulose acetate membrane filters, (Step 8) the residual Cu(II), Ni(II) or Cr(VI) concentrations were determined using ICP-MS technique (Agilent Technologies 7700 Series ICP-MS). Method detection limits for the metals investigated were as follows: Cu(II): 0.001 mg L−1, Ni(II): 0.001 mg L−1, and Cr(VI): 0.001 mg L−1.
The following deviations from this general procedure were made in order to investigate a variety of operational parameters: (1) influence of contact time—adsorption systems were stirred for various durations, ranging from 5 min to 24 h for Cu(II) and Ni(II), and in the case of Cr(VI), from 5 min to 168 h (Step 6); (2) influence of initial metal concentration—initial Cu(II), Ni(II) or Cr(VI) concentrations were varied between 0.5 and 5 mg L−1(Step 4); (3) influence of Ph—initial sample Ph was adjusted to different values, ranging from 2 to 8 (Step 5); (4) influence of ionic strength—the NaNO3concentration in the background solutions was varied between 0.1 and 1 M (Step 2). Unless otherwise indicated,
Water2020,12, 723 4 of 18
operational parameters were: (1) contact time—24 h (Cu(II) and Ni(II)) and 96 h (Cr(VI)), (2) 1 mg L−1 initial metal concentration, (3) initial Ph=5 (Cu(II) and Ni(II)) and Ph=2.5 (Cr(VI)), (4) 0.1 M NaNO3 ionic strength. The decision to investigate the effect of Ph and ionic strength in this work was made on the basis of the importance that the scientific literature assigns to these parameters.
In order to establish that the observed removals of heavy metals were a consequence of their adsorption on oxMWCNT3h and oxMWCNT6h, and not the result of some other processes (e.g., adsorption on glass vials walls, precipitation, etc.), triplicate blank experiments without the addition of the adsorbents were performed, according to the procedures given above. The levels of Cu(II), Ni(II) or Cr(VI) detected in these runs were used in all calculations as initial adsorbate concentrations.
Experimental uncertainty, including instrumental errors, were determined using triplicates of the batch experiments and control samples in each adsorption series, with relative standard deviations falling mostly within±5% of the reported values.
The adsorption capacities of oxMWCNT3h and oxMWCNT6h for the heavy metals investigated were calculated using mass balance Equation (1). Removal efficiencies of Cu(II), Ni(II) or Cr(VI) were determined by Equation (2).
qt(or qe) = (C0−Ct(or Ce))
m V (1)
REt(or REe) = (C0−Ct(or Ce)) C0
×100 (2)
where:qtandqerepresent adsorption capacity per gram dry weight of the adsorbents at a specific time and at the state of equilibrium (mg g−1);C0,CtandCeare the initial, specific time and equilibrium adsorbate concentrations in the liquid phase (mg L−1);Vis the volume of the liquid phase (L);mis the dry weight of the adsorbent (g);REtandREeare the specific time and equilibrium adsorbate removal efficiencies (%).
2.4. Adsorption Kinetics and Isotherms Modelling 2.4.1. Adsorption Kinetics
In order to identify the adsorbate uptake rate, the rate-controlling step and to obtain insight into the possible mechanisms/reaction pathways of the investigated adsorption processes, four kinetic models (Lagergren pseudo-first order, pseudo-second order, Elovich and Weber–Morris (intra-particle diffusion)) were used to fit the experimental data.
The non-linear equations and parameters of the kinetic models tested, as well as information concerning their relationship to the potentially rate limiting adsorption steps, are provided in Table1.
Table 1.Adsorption kinetics models.
Model Model Equation Model Parameters
Lagergren pseudo-first order(a) qt=qe
1−e−k1t
k1—Lagergren pseudo-first order rate constant (h−1) Pseudo-second order(b) qt=1+kqe2k2t
2tqe k2—pseudo-second order rate constant (g mg−1h−1) h=k2qe2 h—initial adsorption rate (mg g−1h−1)
Elovich(c) qt=1βln(1+αβt) α—initial adsorption rate (g mg−1h−2)
β—extent of surface coverage and the activation energy for chemisorption (g mg−1)
Weber–Morris (intra-particle
diffusion)(d) qt=k3t0.5 k3—intra-particle diffusion rate constant (mg g min0.5) Note: Potential steps involved in heavy metal adsorption by porous adsorbents: (1) transport from bulk liquid phase to the external surface of the adsorbent; (2) passage through the liquid film attached to the solid surface;
(3) interactions with the adsorbent surface (limiting step in reaction-based models(a),(b)and(c); (4) diffusion into adsorbent internal sites (pores and interstitial channels) (limiting step in the diffusion-based(d)model) [25].
Water2020,12, 723 5 of 18
2.4.2. Adsorption Isotherms
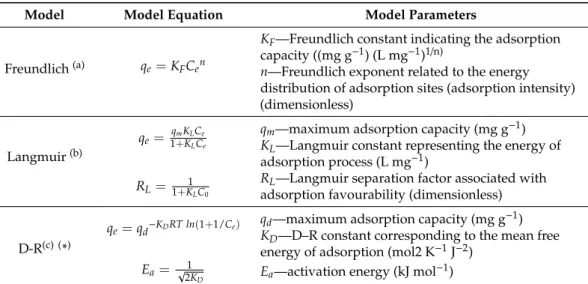
In order to obtain data concerning the maximum adsorption capacity of the adsorbents, as well as to get a better understanding of the adsorption mechanisms, the Freundlich, Langmuir and Dubinin–Radushkevic (D–R) isotherm models were used to analyze the experimental equilibrium data.
The non-linear mathematical expressions, parameters and the most significant assumptions of the three applied models, along with the equations for the separation factor (also called the equilibrium parameter) and adsorption activation energy, which are essential features of the Langmuir and D–R isotherms, are given in Table2.
Table 2.Adsorption isotherm models.
Model Model Equation Model Parameters
Freundlich(a) qe=KFCen
KF—Freundlich constant indicating the adsorption capacity ((mg g−1) (L mg−1)1/n)
n—Freundlich exponent related to the energy distribution of adsorption sites (adsorption intensity) (dimensionless)
Langmuir(b)
qe=1+KqmKLCe
LCe
qm—maximum adsorption capacity (mg g−1) KL—Langmuir constant representing the energy of adsorption process (L mg−1)
RL=1+K1
LC0
RL—Langmuir separation factor associated with adsorption favourability (dimensionless)
D-R(c) (*)
qe=qd−KDRT ln(1+1/Ce) qd—maximum adsorption capacity (mg g−1) KD—D–R constant corresponding to the mean free energy of adsorption (mol2 K−1J−2)
Ea= √1
2KD Ea—activation energy (kJ mol−1)
(a)An empirical equation describing multilayer adsorption onto energy-heterogeneous surfaces with interactions between adsorbed species. The stronger binding sites are occupied first and the binding strength decreases as site occupation increases.(b)A theoretical equation describing monolayer adsorption onto energy-homogenous surfaces with no lateral interaction and steric hindrance between the adsorbed molecules, even on adjacent sites. All binding sites are characterized by the same energy, which makes the binding strength identical throughout the adsorption process.(c)A semi-empirical equation describing adsorption with Gaussian energy distribution onto heterogeneous surfaces. It is usually applied to differentiate between physical and chemical adsorption of metal ions [26]. (*)Ris the universal gas constant (8.314 J mol−1K−1).
3. Results and Discussion
3.1. Adsorbents Characterization
The TEM images of oxMWCNT3h and oxMWCNT6h are shown in Figure1. The tubes are long and curved forming entangled oxMWCNTs networks. Note that the tubes have open ends as a result of the chemical functionalization (oxidation with cc. HNO3) [17]. The opening up of the tubes has led to defects on the sidewalls of the nanotubes and has shortened their length. The inner tube diameters of oxMWCNT3h and oxMWCNT6h, ranged from 7–12 and 9–18 nm respectively, while the outer tube diameters of these materials were 15–24 and 7–32 nm [27].
Water2020,12, 723 6 of 18
Water 2020, 12, x FOR PEER REVIEW 6 of 18
(a) (b)
Figure 1. TEM images of: (a) oxMWCNT3h and (b) oxMWCNT6h.
Scanning electron microscopy was also used to investigate the surface morphology of oxMWCNT3h and oxMWCNT6h (Figure S1). It is evident that the surface of oxMWCNTs mainly consists of aggregated nanotubes. EDS analysis of oxMWCNT3h and oxMWCNT6h confirms that C and O are the dominant elements on the surface of these materials. The molar ratios of C and O in these materials were lower for oxMWCNT6h (11.32:1 compared to 9.32:1), as a consequence of the higher rate of oxidation. Traces of N originates from the HNO3 which was used for functionalization of oxMWCNTs (Table S1).
The FTIR spectra of oxMWCNT3h and oxMWCNT6h are presented in Figure 2. Both spectra exhibit broad peaks at 3420 cm−1 which can be assigned to -OH stretching vibration of carboxylic and phenolic groups (-COOH and -COH). Absorption peaks at 2973 and 2923 cm−1 relate to the asymmetric and symmetric stretching vibrations of C–H originating from the surface of the tubes or from the sidewalls [20,28]. The peaks at 1630 and 1633 cm−1 can be attributed to bending vibration of –OH groups from physisorbed water molecules. The peaks at 1574, 1386, and 1396 cm−1, observed in FTIR spectra of oxMWCNT3h, are associated with asymmetric and symmetric vibration of –COO groups [17,28]. Absorption peaks at 1046, 1086, and 1163 cm−1 in FTIR spectra of oxMWCNT3hare are associated with deformation vibrations of the –OH in alcohol, phenolic and carboxyl groups [20,21,28]. Generally, these oxygen-containing functional groups provide numerous adsorption sites and thus increase the adsorption capacity of the MWCNTs for metal ions [17,20].
Figure 2. FTIR spectra of oxMWCNT3h and oxMWCNT6h.
The textural characteristics of oxMWCNT3h and oxMWCNT6h, including specific surface area, mesopore and micropore volumes and average pore size are shown in Table 3.
Table 3. Textural properties of oxMWCNT3h and oxMWCNT6h.
oxMWCNT3h oxMWCNT6h Specific surface area (m2 g−1) 277 273 Mesopore volume (2–50 nm) (cm3 g−1) 1.95 1.65
Micropore volume (<2 nm) (cm3 g−1) 8 × 10⁻³ 1 × 10⁻³
Average pore size (nm) 14.2 12.2
Figure 1.TEM images of: (a) oxMWCNT3h and (b) oxMWCNT6h.
Scanning electron microscopy was also used to investigate the surface morphology of oxMWCNT3h and oxMWCNT6h (Figure S1). It is evident that the surface of oxMWCNTs mainly consists of aggregated nanotubes. EDS analysis of oxMWCNT3h and oxMWCNT6h confirms that C and O are the dominant elements on the surface of these materials. The molar ratios of C and O in these materials were lower for oxMWCNT6h (11.32:1 compared to 9.32:1), as a consequence of the higher rate of oxidation. Traces of N originates from the HNO3which was used for functionalization of oxMWCNTs (Table S1).
The FTIR spectra of oxMWCNT3h and oxMWCNT6h are presented in Figure2. Both spectra exhibit broad peaks at 3420 cm−1which can be assigned to -OH stretching vibration of carboxylic and phenolic groups (-COOH and -COH). Absorption peaks at 2973 and 2923 cm−1relate to the asymmetric and symmetric stretching vibrations of C–H originating from the surface of the tubes or from the sidewalls [20,28]. The peaks at 1630 and 1633 cm−1can be attributed to bending vibration of –OH groups from physisorbed water molecules. The peaks at 1574, 1386, and 1396 cm−1, observed in FTIR spectra of oxMWCNT3h, are associated with asymmetric and symmetric vibration of –COO groups [17,28]. Absorption peaks at 1046, 1086, and 1163 cm−1in FTIR spectra of oxMWCNT3hare are associated with deformation vibrations of the –OH in alcohol, phenolic and carboxyl groups [20,21,28].
Generally, these oxygen-containing functional groups provide numerous adsorption sites and thus increase the adsorption capacity of the MWCNTs for metal ions [17,20].
Water 2020, 12, x FOR PEER REVIEW 6 of 18
(a) (b)
Figure 1. TEM images of: (a) oxMWCNT3h and (b) oxMWCNT6h.
Scanning electron microscopy was also used to investigate the surface morphology of oxMWCNT3h and oxMWCNT6h (Figure S1). It is evident that the surface of oxMWCNTs mainly consists of aggregated nanotubes. EDS analysis of oxMWCNT3h and oxMWCNT6h confirms that C and O are the dominant elements on the surface of these materials. The molar ratios of C and O in these materials were lower for oxMWCNT6h (11.32:1 compared to 9.32:1), as a consequence of the higher rate of oxidation. Traces of N originates from the HNO3 which was used for functionalization of oxMWCNTs (Table S1).
The FTIR spectra of oxMWCNT3h and oxMWCNT6h are presented in Figure 2. Both spectra exhibit broad peaks at 3420 cm−1 which can be assigned to -OH stretching vibration of carboxylic and phenolic groups (-COOH and -COH). Absorption peaks at 2973 and 2923 cm−1 relate to the asymmetric and symmetric stretching vibrations of C–H originating from the surface of the tubes or from the sidewalls [20,28]. The peaks at 1630 and 1633 cm−1 can be attributed to bending vibration of –OH groups from physisorbed water molecules. The peaks at 1574, 1386, and 1396 cm−1, observed in FTIR spectra of oxMWCNT3h, are associated with asymmetric and symmetric vibration of –COO groups [17,28]. Absorption peaks at 1046, 1086, and 1163 cm−1 in FTIR spectra of oxMWCNT3hare are associated with deformation vibrations of the –OH in alcohol, phenolic and carboxyl groups [20,21,28]. Generally, these oxygen-containing functional groups provide numerous adsorption sites and thus increase the adsorption capacity of the MWCNTs for metal ions [17,20].
Figure 2. FTIR spectra of oxMWCNT3h and oxMWCNT6h.
The textural characteristics of oxMWCNT3h and oxMWCNT6h, including specific surface area, mesopore and micropore volumes and average pore size are shown in Table 3.
Table 3. Textural properties of oxMWCNT3h and oxMWCNT6h.
oxMWCNT3h oxMWCNT6h Specific surface area (m2 g−1) 277 273 Mesopore volume (2–50 nm) (cm3 g−1) 1.95 1.65
Micropore volume (<2 nm) (cm3 g−1) 8 × 10⁻³ 1 × 10⁻³
Average pore size (nm) 14.2 12.2
Figure 2.FTIR spectra of oxMWCNT3h and oxMWCNT6h.
The textural characteristics of oxMWCNT3h and oxMWCNT6h, including specific surface area, mesopore and micropore volumes and average pore size are shown in Table3.
The specific surface areas of oxMWCNT3h and oxMWCNT6h, as well as the mesopore volume of these materials, were very similar, implying that the prolonged mixing time during functionalization has an insignificant effect on the physical characteristics of oxMWCNTs (Table1). Moreover, the specific surface area of these materials is significantly higher than the specific surface area of MWCNTs which functionalized differently, using H2O2and HNO3(in a ratio of 1:3 (v/v)) (196 m2g−1) [17]. The point of zero charges of oxMWCNT3h and oxMWCNT6h are 3.2 and 3.4, respectively (Figure S2).
Water2020,12, 723 7 of 18
Table 3.Textural properties of oxMWCNT3h and oxMWCNT6h.
oxMWCNT3h oxMWCNT6h
Specific surface area (m2g−1) 277 273
Mesopore volume (2–50 nm) (cm3g−1) 1.95 1.65 Micropore volume (<2 nm) (cm3g−1) 8×10⁻³ 1×10⁻³
Average pore size (nm) 14.2 12.2
3.2. Influence of Contact Time and Investigation of Adsorption Kinetics 3.2.1. Influence of Contact Time
The influence of contact time on the removal of Cu(II), Ni(II) and Cr(VI) by oxMWCNT3h and oxMWCNT6h, presented asqtvs.t, is shown in Figure3.
Water 2020, 12, x FOR PEER REVIEW 7 of 18
The specific surface areas of oxMWCNT3h and oxMWCNT6h, as well as the mesopore volume of these materials, were very similar, implying that the prolonged mixing time during functionalization has an insignificant effect on the physical characteristics of oxMWCNTs (Table 1).
Moreover, the specific surface area of these materials is significantly higher than the specific surface area of MWCNTs which functionalized differently, using H2O2 and HNO3 (in a ratio of 1:3 (v/v)) (196 m2 g−1) [17]. The point of zero charges of oxMWCNT3h and oxMWCNT6h are 3.2 and 3.4, respectively (Figure S2).
3.2. Influence of Contact Time and Investigation of Adsorption Kinetics 3.2.1. Influence of Contact Time
The influence of contact time on the removal of Cu(II), Ni(II) and Cr(VI) by oxMWCNT3h and oxMWCNT6h, presented as qt vs. t, is shown in Figure 3.
Figure 3. Adsorption of: (a) Cu(II), (b) Ni(II) and (c) Cr(VI) on oxMWCNT3h and oxMWCNT6h as a function of contact time (m = 5 mg, V = 30 mL (0.1 M NaNO3), C0 = 1 mg L−1, pH = 5 ± 0.1 (Cu(II) and Ni(II)) and 2.5 ± 0.1 (Cr(VI)), t = 5 min-24 h (Cu(II) and Ni(II)) and 5 min-168 h (Cr(VI)), agitation speed
= 180 rpm, T = 298 ± 2 K).
As can be seen in Figure 3, in the case of both investigated adsorbents, equilibrium for Cu(II) and Ni(II), was reached very quickly, in less than 20 min, indicating that the adsorption of these metals is predominantly controlled by the interactions taking place on the adsorbate/adsorbent surface. Throughout the entire studied duration, qt (and REt) values remained very stable, averaging 4.60 mg g−1 (85.1%), 4.39 mg g−1 (93.0%), 1.29 mg g−1 (25.2%) and 2.00 mg g−1 (39.5%) for Cu(II) and Ni(II), respectively. Unlike in the case of Cu(II), the difference in the affinity of the studied oxMWCNTs for Ni(II) proved evident already in this type of adsorption experiments. Similar results have been obtained by other authors [23,25,29].
In contrast, the overall Cr(VI) adsorption rate for the two examined oxMWCNTs was much lower, with approximately 96 h required to reach equilibrium. Over the monitored period of time, the rate of Cr(VI) removal changed—during the first 8 h it was very high, and then slowly started to decline as the systems gradually approached a state of equilibrium. This behavior immediately suggests that Cr(VI) adsorption kinetics are controlled by more than one process of different physical origins (e.g., film diffusion, surface interactions and intra-particle diffusion), or that they are limited by the action of a single, but highly complex phenomenon (e.g., the presence of surface interactions or diffusion within pores of different dimensions) [30]. Clearly, the increased contact time was followed by an increase in qt (and REt) values, resulting in equilibrium averages (qe and REe) of 2.92 mg g−1 (47.8%) and 3.21 mg g−1 (58.5%) for oxMWCNT3h and oxMWCNT6h, respectively.
It is also important to note that the duration of the MWCNTs oxidation treatment did not affect the rate at which the equilibrium was reached in any of adsorption systems investigated (oxMWCNT3h = oxMWCNT3h; Cu(II) = Ni(II) > Cr(VI)). Based on the results obtained by these experiments, in order to ensure the feasibility of subsequent experiments, the time given to reach
Figure 3.Adsorption of: (a) Cu(II), (b) Ni(II) and (c) Cr(VI) on oxMWCNT3h and oxMWCNT6h as a function of contact time (m=5 mg,V=30 mL (0.1 M NaNO3),C0=1 mg L−1, pH=5±0.1 (Cu(II) and Ni(II)) and 2.5±0.1 (Cr(VI)),t=5 min-24 h (Cu(II) and Ni(II)) and 5 min-168 h (Cr(VI)), agitation speed
=180 rpm, T=298±2 K).
As can be seen in Figure3, in the case of both investigated adsorbents, equilibrium for Cu(II) and Ni(II), was reached very quickly, in less than 20 min, indicating that the adsorption of these metals is predominantly controlled by the interactions taking place on the adsorbate/adsorbent surface.
Throughout the entire studied duration,qt(andREt)values remained very stable, averaging 4.60 mg g−1(85.1%), 4.39 mg g−1(93.0%), 1.29 mg g−1(25.2%) and 2.00 mg g−1(39.5%) for Cu(II) and Ni(II), respectively. Unlike in the case of Cu(II), the difference in the affinity of the studied oxMWCNTs for Ni(II) proved evident already in this type of adsorption experiments. Similar results have been obtained by other authors [23,25,29].
In contrast, the overall Cr(VI) adsorption rate for the two examined oxMWCNTs was much lower, with approximately 96 h required to reach equilibrium. Over the monitored period of time, the rate of Cr(VI) removal changed—during the first 8 h it was very high, and then slowly started to decline as the systems gradually approached a state of equilibrium. This behavior immediately suggests that Cr(VI) adsorption kinetics are controlled by more than one process of different physical origins (e.g., film diffusion, surface interactions and intra-particle diffusion), or that they are limited by the action of a single, but highly complex phenomenon (e.g., the presence of surface interactions or diffusion within pores of different dimensions) [30]. Clearly, the increased contact time was followed by an increase in qt(andREt) values, resulting in equilibrium averages (qeandREe)of 2.92 mg g−1(47.8%) and 3.21 mg g−1(58.5%) for oxMWCNT3h and oxMWCNT6h, respectively.
It is also important to note that the duration of the MWCNTs oxidation treatment did not affect the rate at which the equilibrium was reached in any of adsorption systems investigated (oxMWCNT3h= oxMWCNT3h; Cu(II)=Ni(II)>Cr(VI)). Based on the results obtained by these experiments, in order to ensure the feasibility of subsequent experiments, the time given to reach equilibrium in the studies
Water2020,12, 723 8 of 18
considering the influence of other selected operational parameters for Cu(II)/Ni(II) and Cr(VI) was set to be 24 and 96 h.
3.2.2. Adsorption Kinetics Modelling
Due to very rapid achievement of equilibrium, it was not possible to properly fit the Cu(II) and Ni(II) kinetics data to the kinetics models investigated. Further investigation of adsorption kinetics, utilizing the Lagergren pseudo-first order, pseudo-second order, Elovich and intra-particle diffusion models, was therefore only conducted in the case of Cr(VI).
Based on the R2values obtained by non-linear regression of the selected functions (Figure4a,b), the best fit model was chosen. The calculated parameters of the corresponding equations are listed in Table4. All the experimental data are in very good compliance with the Elovich model (R2>0.97), which is generally valid for systems that are characterized by active chemical adsorption (without desorption of products), a process which includes the occurrence of valence forces, forming through sharing or exchanging of electrons between the adsorbate and the energetically heterogeneous surface of the adsorbent. The suitability of this model, additionally confirmed by the lowχ2values (0.16 and 0.14;χ2determined by means of anχ2distribution table), also suggests that the observed decrease in Cr(VI) adsorption rate overtime on both oxMWCNTs is mainly due to the presence of different, complex surface interactions, the most important of which, in this respect, probably relates to very slow Cr(VI)/oxMWCNTs redox reactions (see Section3.4.) [31–33]. When it comes to Elovich coefficients, it is noticeable that theβvalues are similar for the two applied adsorbents, whereas theαis more than twice as high for oxMWCNT3h (supported by comparable behavior in the pseudo-second orderh values), therefore indicating a faster initial uptake for oxMWCNT3h.
Water 2020, 12, x FOR PEER REVIEW 8 of 18
equilibrium in the studies considering the influence of other selected operational parameters for Cu(II)/Ni(II) and Cr(VI) was set to be 24 and 96 h.
3.2.2. Adsorption Kinetics Modelling
Due to very rapid achievement of equilibrium, it was not possible to properly fit the Cu(II) and Ni(II) kinetics data to the kinetics models investigated. Further investigation of adsorption kinetics, utilizing the Lagergren pseudo-first order, pseudo-second order, Elovich and intra-particle diffusion models, was therefore only conducted in the case of Cr(VI).
Based on the R2 values obtained by non-linear regression of the selected functions (Figure 4a,b), the best fit model was chosen. The calculated parameters of the corresponding equations are listed in Table 4. All the experimental data are in very good compliance with the Elovich model (R2 > 0.97), which is generally valid for systems that are characterized by active chemical adsorption (without desorption of products), a process which includes the occurrence of valence forces, forming through sharing or exchanging of electrons between the adsorbate and the energetically heterogeneous surface of the adsorbent. The suitability of this model, additionally confirmed by the low χ2 values (0.16 and 0.14; χ2 determined by means of an χ2 distribution table), also suggests that the observed decrease in Cr(VI) adsorption rate overtime on both oxMWCNTs is mainly due to the presence of different, complex surface interactions, the most important of which, in this respect, probably relates to very slow Cr(VI)/oxMWCNTs redox reactions (see Section 3.4.) [31–33]. When it comes to Elovich coefficients, it is noticeable that the β values are similar for the two applied adsorbents, whereas the α is more than twice as high for oxMWCNT3h (supported by comparable behavior in the pseudo- second order h values), therefore indicating a faster initial uptake for oxMWCNT3h.
Figure 4. Non-linear regressions of kinetics data, obtained using Lagergren pseudo-first order, pseudo-second order, Elovich and intra-particle diffusion models for Cr(VI) adsorption on (a) oxMWCNT3h and (b) oxMWCNT6h.
Table 4. Parameters of Lagergren pseudo-first order, pseudo-second order, Elovich and intra-particle diffusion models for the adsorption of Cr(VI) on oxMWCNT3h and oxMWCNT6h.
oxFMWCNT3h oxFMWCNT6h
Lagergren pseudo-first order
R2 0.711 0.741
k1 (h−1) 0.697 0.322
χ2 2.051 3.750
R2 0.833 0.851
Pseudo-second order R2 0.833 0.851
Figure 4. Non-linear regressions of kinetics data, obtained using Lagergren pseudo-first order, pseudo-second order, Elovich and intra-particle diffusion models for Cr(VI) adsorption on (a) oxMWCNT3h and (b) oxMWCNT6h.
It is important to note that in most of the scientific literature, the intra-particle diffusion model is linearly fitted [34]. According to this approach, intra-particle diffusion plays a significant role in controlling the kinetics only ifqtvs. t0.5produces a straight line passing through the origin of the plot (a zero intercept). Put differently, the deviation from linearity indicates that the adsorption rate is limited by some other process or processes. Furthermore, many authors state that the occurrence of multilinearity in Weber–Morris plots confirms the involvement of intra-particle diffusion in investigated adsorption mechanism, but again, not it the context of the rate-limiting step [35].
Water2020,12, 723 9 of 18
Table 4.Parameters of Lagergren pseudo-first order, pseudo-second order, Elovich and intra-particle diffusion models for the adsorption of Cr(VI) on oxMWCNT3h and oxMWCNT6h.
oxFMWCNT3h oxFMWCNT6h
Lagergren pseudo-first order
R2 0.711 0.741
k1(h−1) 0.697 0.322
χ2 2.051 3.750
R2 0.833 0.851
Pseudo-second order
R2 0.833 0.851
k2(g mg−1h−1) 0.329 0.204
h(g mg−1h−1) 2.384 1.756
χ2 1.330 1.493
Elovich
R2 0.981 0.984
α(g mg−1h−2) 30.600 14.562
β(mg g−1h−1) 3.295 2.760
χ2 0.160 0.142
Weber–Morris (non-linear)
R12 0.066 0.342
ki(mg g−1h−0.5) 0.296 0.317
χ2 6.889 6.216
Weber–Morris (linear)
R12 0.902 0.926
ki(mg g−1h−0.5) 0.155 0.183
Ci(mg g−1) 1.270 1.195
χ2 13.003 11.490
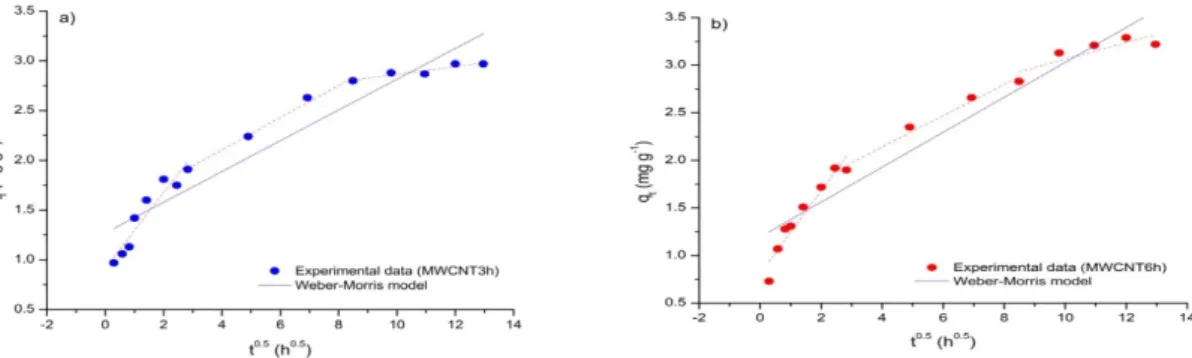
The results obtained using this approach are shown in Figure 5a,b, with the corresponding parameters given in Table4. As can be seen, both plots are multilinear (the red dashed lines) with the linear fit across the whole range of values yielding an intercept greater than zero (in Table2designated Ci). Therefore, as stated in the literature, it can be concluded that intra-particle diffusion, even if not the rate dominant factor, may be involved in the adsorption of Cr(VI) on oxMWCNT3h and oxMWCNT6h.
Given the results shown in the Elowich and Weber–Morris models, these adsorption processes (in terms of rate and mechanism) are most likely controlled by complex surface interactions [20,36,37].
Water 2020, 12, x FOR PEER REVIEW 9 of 18
k2 (g mg−1 h−1) 0.329 0.204
h (g mg−1 h−1) 2.384 1.756
χ2 1.330 1.493
Elovich
R2 0.981 0.984
α (g mg−1 h−2) 30.600 14.562 β (mg g−1 h−1) 3.295 2.760
χ2 0.160 0.142
Weber–Morris (non-linear)
R12 0.066 0.342
ki(mg g−1 h−0.5) 0.296 0.317
χ2 6.889 6.216
Weber–Morris (linear)
R12 0.902 0.926
ki(mg g−1 h−0.5) 0.155 0.183
Ci (mg g−1) 1.270 1.195
χ2 13.003 11.490
It is important to note that in most of the scientific literature, the intra-particle diffusion model is linearly fitted [34]. According to this approach, intra-particle diffusion plays a significant role in controlling the kinetics only if qt vs. t0.5 produces a straight line passing through the origin of the plot (a zero intercept). Put differently, the deviation from linearity indicates that the adsorption rate is limited by some other process or processes. Furthermore, many authors state that the occurrence of multilinearity in Weber–Morris plots confirms the involvement of intra-particle diffusion in investigated adsorption mechanism, but again, not it the context of the rate-limiting step [35].
The results obtained using this approach are shown in Figure 5a,b, with the corresponding parameters given in Table 4. As can be seen, both plots are multilinear (the red dashed lines) with the linear fit across the whole range of values yielding an intercept greater than zero (in Table 2 designated Ci). Therefore, as stated in the literature, it can be concluded that intra-particle diffusion, even if not the rate dominant factor, may be involved in the adsorption of Cr(VI) on oxMWCNT3h and oxMWCNT6h. Given the results shown in the Elowich and Weber–Morris models, these adsorption processes (in terms of rate and mechanism) are most likely controlled by complex surface interactions [20,36,37].
Figure 5. Linear regressions of experimental kinetics data, obtained using the intra-particle diffusion model for Cr(VI) adsorption on: (a) oxMWCNT3h and (b) oxMWCNT6h.
3.3. Modelling the Adsorption Isotherms (Influence of Initial Metal Concentration)
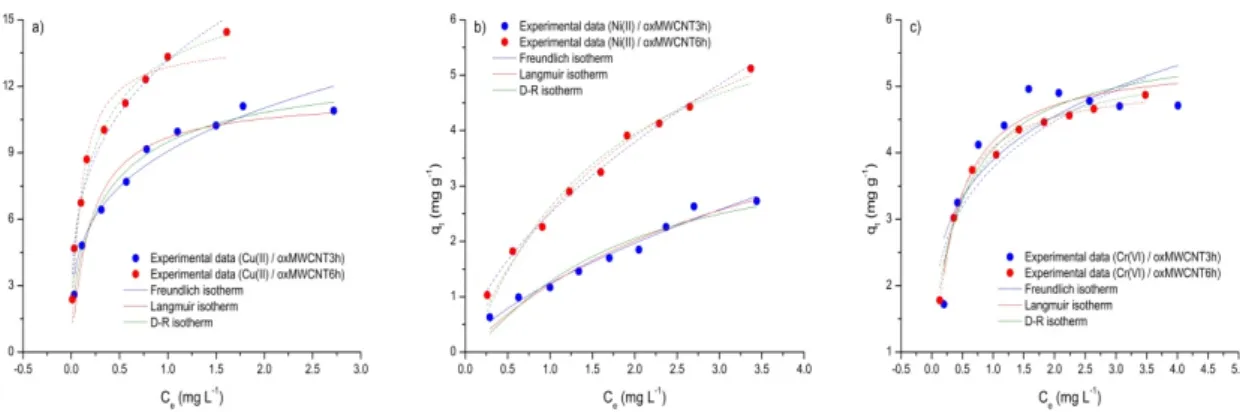
In order to describe the adsorption of Cu(II), Ni(II) and Cr(VI) on the oxMWCNTs investigated more precisely, the experimental data was analyzed using the Freundlich, Langmuir and D–R equations. The non-linear fitting curves resulting from these models are shown in Figure 6, while the parameters of these functions are given in Table 5.
Figure 5.Linear regressions of experimental kinetics data, obtained using the intra-particle diffusion model for Cr(VI) adsorption on: (a) oxMWCNT3h and (b) oxMWCNT6h.
3.3. Modelling the Adsorption Isotherms (Influence of Initial Metal Concentration)
In order to describe the adsorption of Cu(II), Ni(II) and Cr(VI) on the oxMWCNTs investigated more precisely, the experimental data was analyzed using the Freundlich, Langmuir and D–R equations.
The non-linear fitting curves resulting from these models are shown in Figure6, while the parameters of these functions are given in Table5.
Water2020,12, 723 10 of 18
Water 2020, 12, x FOR PEER REVIEW 10 of 18
Figure 6. Non-linear regressions of experimental isotherms, obtained using Freundlcih, Langmuir and D–R models for: (a) Cu(II), (b) Ni(II) and (c) Cr(VI) adsorption on oxMWCNT3h and oxMWCNT6h (m = 5 mg, V = 30 mL (0.1 M NaNO3), C0 = 0.5–5 mg L−1,pH = 5 ± 0.1 (Cu(II) and Ni(II)) and 2.5 ± 0.1 (Cr(VI)), t = 24 h (Cu(II) and Ni(II)) and 96 h (Cr(VI)), agitation speed = 180 rpm, T = 298
± 2 K).
Table 5. Parameters of Freundlich, Langmuir and D–R models for the adsorption of (a) Cu(II), (b) Ni(II) and (c) Cr(VI) on oxMWCNT3h and oxMWCNT6h.
oxFMWCNT3h oxFMWCNT6h Cu(II) Ni(II) Cr(VI) Cu(II) Ni(II) Cr(VI)
Freundlich
R2 0.951 0.970 0.706 0.976 0.993 0.920
KF(*) 9.066 1.242 3.892 13.165 2.506 3.777
n 0.281 0.662 0.225 0.286 0.598 0.244
χ2 0.474 0.062 0.858 0.695 0.031 0.217
Langmuir
R2 0.946 0.954 0.920 0.946 0.988 0.994
KL (l mg−1) 5.129 0.273 3.331 10.459 0.428 3.996 qmax(mg g−1) 11.567 5.691 5.422 14.086 8.455 5.100
RL 0.867–0.067 0.927–0.516 0.600–0.070 0.905–0.056 0.900–0.409 0.658–0.067
χ2 0.735 0.145 0.209 1.124 0.075 0.010
D–R
R2 0.985 0.922 0.863 0.991 0.975 0.986
qd (mg g−1) 13.017 4.014 5.764 17.238 7.035 5.509 Kd (mol2 K−1 J−2) 1.846 × 10⁻⁴ 6.683 × 10⁻⁴ 2.051 × 10⁻⁴ 1.555 × 10⁻⁴ 5.765 × 10⁻⁴ 1.920 × 10⁻⁴
Ea (kJ mol−1) 52.050 27.353 49.376 56.702 29.450 51.027
χ2 0.112 0.252 0.369 0.212 0.157 0.037
(*) (mg g−1)/(mg l−1)n.
High R2 (> 0.91) and low χ2 (< 1.12) values were obtained for all isotherms. The exception is the Freundlich and D–R isotherms of Cr(VI)/oxMWCNT3h, but even here the relatively low R2 values (0.71 and 0.86) have corresponding acceptable χ2 (0.86 and 0.37) values, suggesting that each of the three applied models is suitable for describing the adsorption of all the metals investigated on both oxMWCNT3h and oxMWCNT6h. The differences in the goodness of fit for Freundlich and Langmuir models are insignificant, so it is not possible to draw strong conclusions relating and number of adsorbate layers forming during the process.
Values of the Freundlich exponent n are less than 1 in each case, suggesting that all the processes can be characterized as favorable, with the adsorption of Cu(II) and Cr(VI) being good (0.1 < n < 0.5) and Ni(II) moderate (0.5 < n < 1) (Cu(II) ~ Cr(VI) > Ni(II)). This observation can be further substantiated by the RL factors, which lie within the range 0 to 1 (adsorption is irreversible, favorable, linear or unfavorable, when RL = 0, 0 < RL < 1, RL = 1, RL > 1, respectively). The generally high and significantly different KF and KL values obtained indicate the presence of selective adsorbents which have high affinities for the adsorption of the metals investigated.
Depending on how it is expressed, the adsorption capacity of oxMWCNT3h and oxMWCNT6h towards the selected metals exhibits the following trend: KF (relative)—Cu(II) > Cr(VI) > Ni(II), qm— Cu(II) > Ni(II) > Cr(VI), qd—Cu(II) > Cr(VI) > Ni(II) (oxMWCNT3h) and Cu(II) > Ni(II) > Cr(VI)
Figure 6.Non-linear regressions of experimental isotherms, obtained using Freundlcih, Langmuir and D–R models for: (a) Cu(II), (b) Ni(II) and (c) Cr(VI) adsorption on oxMWCNT3h and oxMWCNT6h (m=5 mg,V=30 mL (0.1 M NaNO3),C0=0.5–5 mg L−1,pH=5±0.1 (Cu(II) and Ni(II)) and 2.5±0.1 (Cr(VI)),t=24 h (Cu(II) and Ni(II)) and 96 h (Cr(VI)), agitation speed=180 rpm, T=298±2 K).
Table 5.Parameters of Freundlich, Langmuir and D–R models for the adsorption of (a) Cu(II), (b) Ni(II) and (c) Cr(VI) on oxMWCNT3h and oxMWCNT6h.
oxFMWCNT3h oxFMWCNT6h
Cu(II) Ni(II) Cr(VI) Cu(II) Ni(II) Cr(VI)
Freundlich
R2 0.951 0.970 0.706 0.976 0.993 0.920
KF(*) 9.066 1.242 3.892 13.165 2.506 3.777
n 0.281 0.662 0.225 0.286 0.598 0.244
χ2 0.474 0.062 0.858 0.695 0.031 0.217
Langmuir
R2 0.946 0.954 0.920 0.946 0.988 0.994
KL(l mg−1) 5.129 0.273 3.331 10.459 0.428 3.996
qmax(mg g−1) 11.567 5.691 5.422 14.086 8.455 5.100
RL 0.867–0.067 0.927–0.516 0.600–0.070 0.905–0.056 0.900–0.409 0.658–0.067
χ2 0.735 0.145 0.209 1.124 0.075 0.010
D–R
R2 0.985 0.922 0.863 0.991 0.975 0.986
qd(mg g−1) 13.017 4.014 5.764 17.238 7.035 5.509
Kd(mol2K−1J−2) 1.846×10⁻⁴ 6.683×10⁻⁴ 2.051×10⁻⁴ 1.555×10⁻⁴ 5.765×10⁻⁴ 1.920×10⁻⁴
Ea(kJ mol−1) 52.050 27.353 49.376 56.702 29.450 51.027
χ2 0.112 0.252 0.369 0.212 0.157 0.037
(*) (mg g−1)/(mg l−1)n.
High R2(>0.91) and lowχ2(<1.12) values were obtained for all isotherms. The exception is the Freundlich and D–R isotherms of Cr(VI)/oxMWCNT3h, but even here the relatively low R2values (0.71 and 0.86) have corresponding acceptableχ2(0.86 and 0.37) values, suggesting that each of the three applied models is suitable for describing the adsorption of all the metals investigated on both oxMWCNT3h and oxMWCNT6h. The differences in the goodness of fit for Freundlich and Langmuir models are insignificant, so it is not possible to draw strong conclusions relating and number of adsorbate layers forming during the process.
Values of the Freundlich exponentnare less than 1 in each case, suggesting that all the processes can be characterized as favorable, with the adsorption of Cu(II) and Cr(VI) being good (0.1<n<0.5) and Ni(II) moderate (0.5<n<1) (Cu(II) ~ Cr(VI)>Ni(II)). This observation can be further substantiated by theRL factors, which lie within the range 0 to 1 (adsorption is irreversible, favorable, linear or unfavorable, whenRL=0, 0<RL<1,RL=1,RL>1, respectively). The generally high and significantly differentKF andKLvalues obtained indicate the presence of selective adsorbents which have high affinities for the adsorption of the metals investigated.
Depending on how it is expressed, the adsorption capacity of oxMWCNT3h and oxMWCNT6h towards the selected metals exhibits the following trend: KF (relative)—Cu(II) > Cr(VI)> Ni(II), qm—Cu(II)>Ni(II)>Cr(VI),qd—Cu(II)>Cr(VI)>Ni(II) (oxMWCNT3h) and Cu(II)>Ni(II)>Cr(VI) (oxMWCNT6h). Furthermore, the Cu(II) and Ni(II) removals were more pronounced for oxMWCNT6h, while the Cr(VI) uptake was slightly higher in the case of oxMWCNT3h (KF,qm, as well asqdfor the
Water2020,12, 723 11 of 18
adsorption of Cr(VI) on the applied adsorbents differs much less compared to the two other metals).
These differences in the removal capacities of oxMWCNT3h and oxMWCNT6h (observed in the case of Cu(II) and Ni(II), and to a much lesser extent for Cr(VI)) are most likely due to the influence of the functionalization process length on the surface properties of the nanotubes (e.g., an increase in the quantity of various oxygen-containing groups with longer functionalization time; see Table S1), making them more suitable for the uptake of the divalent metals studied. Of the trends mentioned above, the experimental observations (qevalues) are most consistent with the values obtained by the Freundlich isotherm, so the assumptions behind this model can potentially be considered the most relevant for this study (see Table2) [37,38].
Adsorption energiesEa, calculated using the D-R model, are greater than 16 kJ mol−1, which implies that the formation of chemical bonds, as opposed to ion-exchange or non-specific physical interactions, dominantly controls all considered systems (adsorption is physical, ion-exchange or chemical type when 1 kJ mol−1<Ea<8 kJ mol−1, 8 kJ mol−1<Ea<16 kJ mol−1,Ea>16 kJ mol−1, respectively). This finding is consistent with the conclusions reached through non-linear modelling of the kinetics data [39].
A comprehensive overview of the capacity of other available adsorbents is given in the following papers [5,40,41]. As can be seen, oxMWCNT3h and oxMWCNT6h are, in most cases, characterized by a similar or lower adsorption capacity for Cu(II), Ni(II) and Cr(VI) compared to other materials.
Considering the non-uniformity of the experimental conditions applied in different studies (e.g., C0range, initial pH value,m/Vratio, etc.), as well as the specificity of those under which this research was conducted (very low and narrowC0range and lowm/Vratio) it is clear that the direct comparison of, for example, theqmaxvalues obtained herein with the results of other authors, though possible, provides an unrealistic picture when it comes to efficiency of investigated oxMWCNTs.
3.4. Influence of pH
The solution pH acidity is the one matrix property with the highest potential to affect the adsorption of heavy metals. The removal of Cu(II), Ni(II) and Cr(VI) by oxMWCNT3h and oxMWCNT6h, as a function of pH, is illustrated in Figure7.
Water 2020, 12, x FOR PEER REVIEW 11 of 18
(oxMWCNT6h). Furthermore, the Cu(II) and Ni(II) removals were more pronounced for oxMWCNT6h, while the Cr(VI) uptake was slightly higher in the case of oxMWCNT3h (KF, qm, as well as qd for the adsorption of Cr(VI) on the applied adsorbents differs much less compared to the two other metals). These differences in the removal capacities of oxMWCNT3h and oxMWCNT6h (observed in the case of Cu(II) and Ni(II), and to a much lesser extent for Cr(VI)) are most likely due to the influence of the functionalization process length on the surface properties of the nanotubes (e.g., an increase in the quantity of various oxygen-containing groups with longer functionalization time; see Table S1), making them more suitable for the uptake of the divalent metals studied. Of the trends mentioned above, the experimental observations (qe values) are most consistent with the values obtained by the Freundlich isotherm, so the assumptions behind this model can potentially be considered the most relevant for this study (see Table 2) [37,38].
Adsorption energies Ea, calculated using the D-R model, are greater than 16 kJ mol−1, which implies that the formation of chemical bonds, as opposed to ion-exchange or non-specific physical interactions, dominantly controls all considered systems (adsorption is physical, ion-exchange or chemical type when 1 kJ mol−1 < Ea < 8 kJ mol−1, 8 kJ mol−1 < Ea < 16 kJ mol−1, Ea > 16 kJ mol−1, respectively). This finding is consistent with the conclusions reached through non-linear modelling of the kinetics data [39].
A comprehensive overview of the capacity of other available adsorbents is given in the following papers [5,40,41]. As can be seen, oxMWCNT3h and oxMWCNT6h are, in most cases, characterized by a similar or lower adsorption capacity for Cu(II), Ni(II) and Cr(VI) compared to other materials.
Considering the non-uniformity of the experimental conditions applied in different studies (e.g., C0
range, initial pH value, m/V ratio, etc.), as well as the specificity of those under which this research was conducted (very low and narrow C0 range and low m/V ratio) it is clear that the direct comparison of, for example, the qmax values obtained herein with the results of other authors, though possible, provides an unrealistic picture when it comes to efficiency of investigated oxMWCNTs.
3.4. Influence of pH
The solution pH acidity is the one matrix property with the highest potential to affect the adsorption of heavy metals. The removal of Cu(II), Ni(II) and Cr(VI) by oxMWCNT3h and oxMWCNT6h, as a function of pH, is illustrated in Figure 7.
Figure 7. Adsorption of (a) Cu(II), (b) Ni(II) and (c) Cr(VI) on oxMWCNT3h and oxMWCNT6h as a function of pH (m = 5 mg, V = 30 mL (0.1 M NaNO3), C0 = 1 mg L−1, pH = 2–8 ± 0.1, t = 24 h (Cu(II) and Ni(II)) and 96 h (Cr(VI)), agitation speed = 180 rpm, T = 298 ± 2 K).
As can be seen, pH plays an important role in the behavior of all studied adsorption systems.
More specifically, Cu(II) uptake (qe and REe) sharply increases as initial pH goes from 2 to 6 and then, as the liquid phase becomes more basic, maintains a constant high level (0.04 to 5.28 mg g−1 (0.70 to 99.4%) and 0.04 to 4.68 mg g−1 (0.92 to 99.3%)). oxMWCNTs capacity for Ni(II) rises throughout the entire pH range investigated (0.02 to 4.53 mg g−1 (0.40% to 82.2%), whereas the Cr(VI) systems demonstrated the best removals at pH = 3 (3.43 (59.9%) and 3.30 (64.1%)).
Figure 7.Adsorption of (a) Cu(II), (b) Ni(II) and (c) Cr(VI) on oxMWCNT3h and oxMWCNT6h as a function of pH (m=5 mg,V=30 mL (0.1 M NaNO3),C0=1 mg L−1, pH=2–8±0.1,t=24 h (Cu(II) and Ni(II)) and 96 h (Cr(VI)), agitation speed=180 rpm, T=298±2 K).
As can be seen, pH plays an important role in the behavior of all studied adsorption systems.
More specifically, Cu(II) uptake (qeandREe) sharply increases as initial pH goes from 2 to 6 and then, as the liquid phase becomes more basic, maintains a constant high level (0.04 to 5.28 mg g−1(0.70 to 99.4%) and 0.04 to 4.68 mg g−1(0.92 to 99.3%)). oxMWCNTs capacity for Ni(II) rises throughout the entire pH range investigated (0.02 to 4.53 mg g−1(0.40% to 82.2%), whereas the Cr(VI) systems demonstrated the best removals at pH=3 (3.43 (59.9%) and 3.30 (64.1%)).
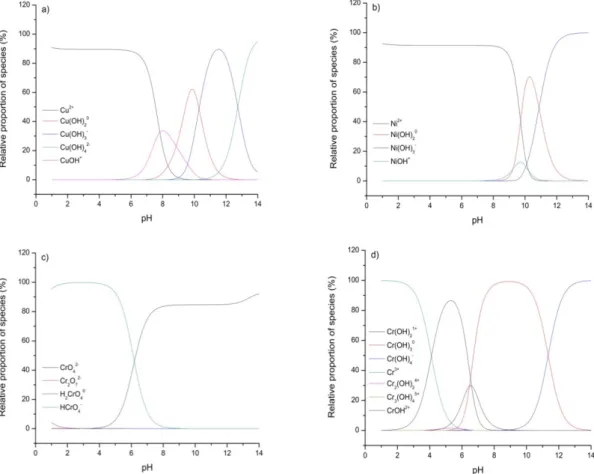
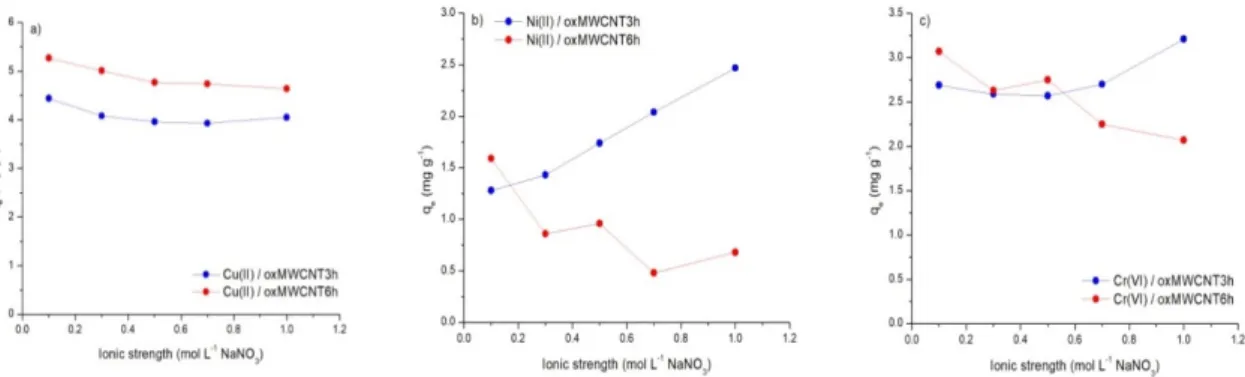
The influence of pH on adsorption can be explained by considering the effect this parameter has on the surface properties of the oxMWCNTs and the hydrolysis capacity of the selected metals. Depending