Acta Polytechnica Hungarica Vol. 11, No. 6, 2014
Use of Computer Simulation in Estimation of GSM Base Station Output Power
Mladen Mileusnić, Tomislav Šuh, Aleksandar Lebl, Dragan Mitić, Žarko Markov
Institute for Telecommunications and Electronics, IRITEL A.D. BELGRADE Batajnički put 23, 11080 Belgrade, Serbia
E-mail: mladenmi@iritel.com, suh@iritel.com, lebl@iritel.com, mita@iritel.com, Zarko.Markov@iritel.com
Abstract: In this paper we present how computer simulation can be used to estimate the mean output power and the probability cumulative distribution function of one base station output power in GSM. The basis of the method is adding the simulation of random distance between the mobile station (MS) and base transceiver station (BTS) to the known method of telephone traffic simulation. The simulation is a suitable method for the estimation of base station output power, especially in the case when it is not easy to calculate the output power’s dependence on these factors. A couple of numerical examples present the results of these simulations.
Keywords: computer simulation; random number generation; probability distribution function; GSM; base transceiver station; output power; telephone traffic
1 Introduction
The use of radio links and mobile communication is quickly increasing, which is why energy saving is of growing importance in this field. There are at least reasons for energy saving. The first one is growing cost of energy, and the second one is environmental preservation because of the detrimental effect of increased energy production [1] [2]. The program of energy saving is called GREEN Radio (Globally Resource-optimized and Energy-Efficient Networks). This program has several directions, but for this paper the most important direction pertains to telephone traffic characteristics that are used to save energy. This direction is often also called TANGO (Traffic-Aware Network planning and Green Operation). Energy consumption, i.e. instantaneous consumption of electrical power of one base station (Base Transceive Station, BTS) in the network of mobile telephones (GSM), depends on different factors: number of carriers, i.e.
number of traffic (TCH) channels, distribution of surface users’ density in the cell, influence of intra-cell connections, influence of half-rate connections, influence of
the limited number of traffic sources, and influence of the environment on signal attenuation.
The first carrier (BCCH) always has constant, i.e. greatest, power [3], and it is not considered in this paper. In the channels of other carriers the power is adjusted according to the instantaneous needs, i.e. in this case power control exists.
The density of surface users is important, because the distance between the base station and the user determines the base station output power for that channel. It is clear that less power is needed if more users are situated near the base station.
Intra-cell connections are established between the users, situated in the same cell [4]. The influence of intra-cell connections is seen as the increase of power per connection when the part of intra-cell traffic increases because each intra-cell connection seizes two channels.
On the contrary to the influence of intra-cell connections, influence of half-rate connections [5] decreases emission power per connection. In this paper it is considered that the results, obtained for full-rate connections, are conservative, i.e.
that they are on the safe side in relation to the model with half-rate connections.
The influence of a limited number of traffic sources (Engset model) increases model efficiency. Unfortunately, this increase is less than the decrease of efficiency caused by intra-cell connection establishment [6].
The environmental influence on signal attenuation is such that the signal is attenuated as a function of the distance between the user and the base station at a degree between two and five.
One of the important factors is instantaneous number of mobile telephone connections, i.e. instantaneous value of telephone traffic. Minimizing of the transmitter power leads to the minimizing of self-interference in the system, i.e. to maintenance of requested quality of service (Quality of Service, QoS) in the conditions of optimal output emission power in BTS. The third component of the problem of battery backup in BTS, which is used if the primary power source of the electric power network is interrupted, or if alternative energy source is used. If all these reasons are considered, it is necessary to know the output power of BTS as a function of all factors, that influence the emission power in the corresponding cell. As the accurate calculation of this dependence is sometimes very complex, in this paper we present the method for this dependence determination by computer simulation. The method is proved by simulation of one simple case: we consider a group of traffic channels containing two to four carriers (14 to 30 TCH channels), signal attenuation is related to the square of the distance between the user and the base, there are no intra-cell and half-rate connections, users’ density distribution is uniform in the whole cell, there is a great number of users in the model (Erlang model).
Section 2 deals with model presentation. This section also gives some important assumptions and the list of designations, which are used in the paper. Section 3 presents the process of simulation, and Section 4 gives the results of simulation.
2 Model, Assumptions and Designations
Let us consider one BTS with dynamic power control in a GSM network [3] [7].
The network uses FDMA (Frequency Division Multiple Access) and TDMA (Time Division Multiple Access), implemented within each carrier. The number of carriers used in one BTS is denoted by Nf, and the number of time slots used on each carrier by Ns (=8). The number of traffic channels, Nt, used for telephone connection establishment is slightly lower than the total number of channels, i.e.
Nt < Nc = Nf ·Ns, because some of the channels are used for signalling. The offered traffic to all traffic channels in BTS is given by A. The total served (handled) traffic is Y. The call loss (or blocking), caused by lack of idle traffic channels, is denoted by B.
A distribution function of random variables will be denoted by F. For example: let us consider the random variable X with one of its values x. As it is well known, the (cumulative) probability distribution function (CDF) of a random variable X, FX(x), presents the probability that X is less or equal to x:
( ) ( )
FX x P Xx
The probability density function of X is denoted by fX(x) and it is, for continuous random variables, equal to the derivative of the distribution function FX(x).
The output power of one traffic channel (W) is defined as mean power during the useful part of GSM burst.
The output power of one traffic channel as part of total BTS power is ω = W/8.
The mean output BTS power is mean value of power as sum of all traffic channels powers, WBm=Σωi, i=1,2,... Nt, Fig. 1.
Figure 1
Symbolic presentation of output power for one BTS with 8 traffic channels: W1 - output power of first traffic channel, ω1 - output power of first channel as part of mean BTS output power, ω1=W1/8, WBm –
mean output power of BTS, WBm=Σ ωi, i=1,2,...8
We shall make some assumptions, which simplify the model, but do not decrease the quality of analysis.
A1. The output power of the BTS is adjusted for all active traffic channels on all carriers only according to the user’s distance.
A.2. Mobile stations (MS) are uniformly distributed in the cell area. The cell area is the circle with radius R. This assumprion is adopted in order to enable calculations. Generally, users can be arbitrary distributed.
A3. The output power of one channel (W) depends on the random distance, (D), between MS and BTS:
( )
wg d (1)
where wmax = g(R) is the largest emission power of one channel.
The distance between BTS and MS, D, is a random variable and its distribution function:
( ) ( )
F dD P Dd (2)
represents probability that the distance is less or equal to some value d. This assumption means that output power of one traffic channel is continuous random variable (as also D), which is in practice not completely true, because the output power changes in steps of 2 dB. The distribution density of random variable D is fD(d).
A4. The number of users, i.e. mobile stations Nms in one cell, which is overlaid by the considered base station, is much higher than the number of traffic channels, i.e. Nms>>Nt. This assumption allows us to use the well-known Erlang model for traffic calculations, [7], section 2.4.4. As in A2, this assumption is adopted in order to make calculation easier. The model can also be Engset if this assumption is not valid.
3 Simulation
Computer simulation of telephone traffic process has been well-known for a long time. A detailed description of this process can be found in [8] and [9], although these are not the oldest references from this area. This method, called roulette method or Monte Carlo method, is first used for the determination of call loss in telephone systems, where it was not always easy to derive mathematical formulas for the calculation. The interesting characteristic of the method is the following one: the real process in telephone system happens in continuous time, and the computer simulation happens in discrete moments of time. This inconsistency makes no problem for the determination of time-relations in queueing systems, [10].
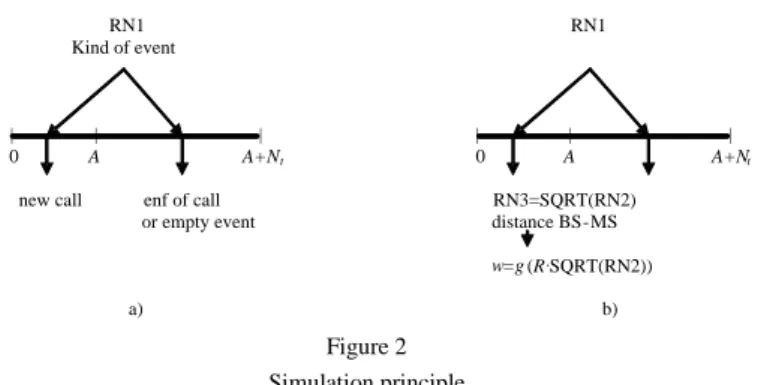
The simulation of telephone traffic in a fully available group, as in the group of radio channels in one GSM cell, is based on the generation of a random number RN1 with uniform distribution in the interval (0, A+Nt).
| | | |
RN1 RN1 Kind of event
| | 0 A A+Nt 0 A A+Nt
new call enf of call RN3=SQRT(RN2) or empty event distance BS-MS
w=g(R·SQRT(RN2)) a) b)
Figure 2 Simulation principle
The new call is generated if it is 0<RN1<A, and the end of the connection on channel K (K=1,2,..Nt) happens if channel K is busy and if the generated number is situated in the interval K-1<RN1<K, Fig 2a). If it is K-1<RN1<K, and channel K is free, this is an empty event. It is obvious that in this process of simulation the main random variable is the number of instantaneous connections j in the system.
In order to determine the characteristics of output power of channel with power control in GSM by simulation, the process of traffic simulation must be upgraded in such a way that, for the new call, the random distance between MS and BTS, is generated, Fig. 2b). According to the assumption A2, the cumulative distribution function (CDF) of the distance is calculated in the following way. The probability that MS-BTS distance is equal or smaller than x is the the probability that the location of MS is in the circle with radius x, i. e.
2 2
2 2
( ) ( ) , 0
D x x
F x P d x x R
R R
(3)
The desirable distribution of random numbers in this simulation can be obtained from the uniform distribution by inverse transform method, [11] or [12]. In the case of uniform users’ density in the cell, equation (3), it is necessary to generate numbers with the inverse quadratic distribution. So, the random numbers, which determine the distance between BTS and MS, are calculated as the square root of the uniformly distributed random numbers. It means that random distance BTS- MS (d) can be obtained in simulation from the random number RN2, which has the uniform distribution in the range (0,1), by implementing the operation d=R·RN3=R·SQRT(RN2), as presented in [11] or [12]. Finally, the output power of one connection in simulation process is obtained as the random variable w, which is the function of the random distance BTS-MS, according to (1).
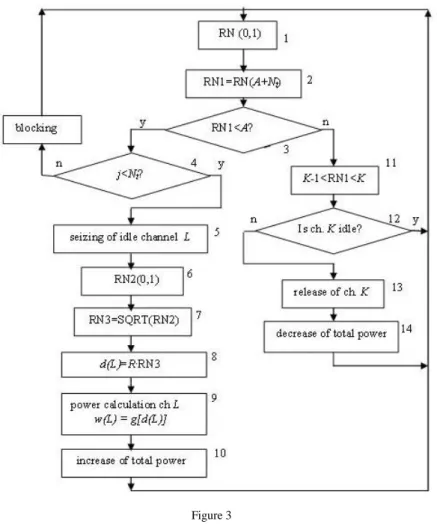
A flow chart of the program for simulation is presented in Fig. 3. Steps in simulation are: 1. random number (RN1) generation, 2. multiplication of this number by A+Nt, 3. decision whether generated random number RN1 means the new call or connection interruption, 4. new call – are there free channels, 5.
seizing of free channel L, 6. random number (RN2) generation, 7. and 8.
determination of random distance BTS-MS in the new connection using channel L, 9. calculation of the power for the new connection on channel L, 10. increase of
total power by the value of the power of new connection, 11. generated random number corresponds to the channel K, 12. checking whether channel K is busy, 13.
release of channel K, if it is busy, 14. decrease of total power by the power of channel K.
The mean value of output power and CDF of the probability of output power for one active channel and for the group of channels in one BTS can be obtained using the simulation, whose flow chart is presented in Fig. 3.
Figure 3 Flow chart of simulation
4 Example
Let us consider a GSM cell where the dependence of output power on the distance between BTS and MS is presented by the quadratic function, i.e.:
w a d2 (4)
For independent random variable, the distance BTS-MS, d, we can define CDF FD(x) as expressed by (3). The output power of one busy channel, w, as the function of random variable d, has the CDF FW(y), according to [13, section 5.3, equation (5.9)]:
2 max
( ) 0, 0 ( )
0 ( ) , 0
( ) 1,
W
W
D
W
F y y
y y
F y P w y P d
a a
y y y
P d F y w
a a a R
F y
wmax y
(5)
because it is always d>0.
Let us suppose that for the considered cell we have R=10 km and wmax = g(R)=40 W, (class 4). The CDF of the probability of output power w and ω for one active channel are obtained by calculation and simulation and presented in Fig. 4.
Figure 4
CDF of the probabilities of w and ω for one active channel
From Fig. 4 and equation (5) can be concluded that mean output power of one active channel is wm=0.5·wmax.
The mean output power of one BTS, WBm, is the sum of mean powers of all active traffic channels in all states. This sum depends on mean output power of one active channel and on traffic, i.e. on the number of active channels. It is the sum of probabilities that j (j=1,2,...,Nt) channels are occupied, according to truncated Poisson distribution, [14], that holds for Erlang group, ERL(j,A,Nt), multiplied by j·ωm i. e. by the mean output power of these j channels:
1
( , , )
Nt
Bm m t
j
W j ERL j A N
(6)where ωm =wm/8. It is obvious that the value of mean power of BTS depends on traffic, and that it can be in the range 0≤ WBm ≤ Nt·wmax/8.
From telephone traffic theory it is known that the equation
1
( , , ) (1 )
Nt
t j
j ERL j A N Y B A
(7)presents the value of served traffic in Erlang model, [14]. That’s why the mean output power of one BTS is WBm=ωm·(1-B)·A.
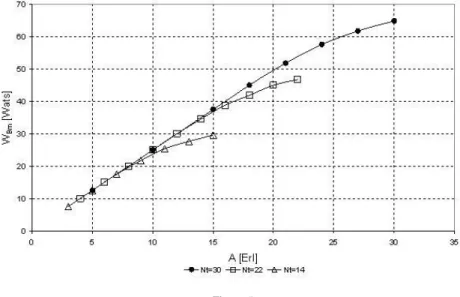
Fig. 5 presents mean output power of one BTS as the function of the value of offered traffic for the values: Nt=14, Nt=22 and Nt=30. These values are obtained by the calculation and by simulation. In the simulation the number of connections per channel was at least 1000. In all cases of simulation from Fig. 4 and Fig. 5 differences between the values obtained by the calculation and simulation are negligible.
Figure 5
Mean output power of one BTS in the function of traffic, Nt = 14, 22 and 30 channels
Figs. 6a) and 6b) present CDF of output power of one BTS, FWB(w), which is obtained by simulation with R=10 km, wmax = g(R)=40 W. The system is simulated for the group of 14 channels, and for two values of offered traffic: A=5 Erl (low traffic) and A=13 Erl (heavy traffic). The call loss in the first case is negligible (B=0.05%), and in the second case the traffic load is great and it causes great call loss (B=15%).
cummulative distribution of the base station power, N=14
0 0,1 0,2 0,3 0,4 0,5 0,6 0,7 0,8 0,9 1
0 10 20 30 40 50 60
x [Wats]
FWB(x)
A=5Erl A=13Erl
Figure 6a)
CDF of output power for one BTS with Nt=14 channels, A=5 Erl and A=13 Erl
cummulative distribution of the base station power, N=14
0,9 0,91 0,92 0,93 0,94 0,95 0,96 0,97 0,98 0,99 1
20 25 30 35 40 45 50
x [Wats]
FWB(x)
A=5Erl A=13Erl
Figure 6b)
CDF of output power for one BTS with Nt=14 channels, A=5 Erl and A=13 Erl (detailed)
Figs. 7a) and 7b) present CDF of output power of one BTS, FWB(w), in the similar GSM cell as in Figs. 6, but for Nt=22 channels. In this case the low traffic (which causes traffic loss B=0.05%) is 10.2 Erl, and heavy traffic 21.9 Erl (B=15%).
cummulative distribution of the base station power, N=22
0 0,1 0,2 0,3 0,4 0,5 0,6 0,7 0,8 0,9 1
0 10 20 30 40 50 60 70 80
x [Wats]
FWB(x)
A=10.2Erl A=21,9Erl
Figure 7a)
CDF of output power for one BTS with Nt=22 channels, A=10.2 Erl and A=21.9 Erl
cummulative distribution of the base station power, N=22
0,9 0,95 1
36 41 46 51 56 61 66 71 76
x [Wats]
FWB(x)
A=10.2Erl A=21,9Erl
Figure 7b)
CDF of output power for one BTS with Nt=22 channels, A=10.2 Erl and A=21.9 Erl (detailed)
Figs. 8a) and 8b) present CDF of output power of one BTS, FWB(w), in the case when Nt=30. In this case the low traffic (which causes traffic loss B=0.05%) is 15.9 Erl, and heavy traffic 21.9 Erl (B=15%).
cummulative distribution of the base station power, N=30
0 0,1 0,2 0,3 0,4 0,5 0,6 0,7 0,8 0,9 1
0 20 40 60 80 100 120
x [Wats]
FWB(x)
A=15.9Erl A=31Erl
Figure 8a)
CDF of output power for one BTS with Nt=30 channels, A=15.9 Erl and A=31 Erl
cummulative distribution of the base station power, N=30
0,9 0,91 0,92 0,93 0,94 0,95 0,96 0,97 0,98 0,99 1
52 62 72 82 92 102
x [Wats]
FWB(x)
A=15.9Erl A=31Erl
Figure 8b)
CDF of output power for one BTS with Nt=30 channels, A=15.9 Erl and A=31 Erl (detailed)
From the detailed Figs. 6b), 7b) and 8b) we can conclude how much power is necessary to satisfy 95% connections. So, from the detailed Fig. 6b), presented for 14 channels, it can be seen that, in the case of smaller offered traffic (5 Erl), the mean power of 24 W is satisfactory for 95% of connections, while in the case of greater traffic (13 Erl) it is necessary to provide 39.6 W for the same goal. From Fig. 7b) it follows that, for 22 chanels, the power of 42 W satisfies 95% of connections in the case of smaller offered traffic (10.2 Erl), and 61 W is necessary for greater offered traffic (21.9 Erl). The corresponding values for 30 channels, from Fig. 8b), are 60 W for smaller offered traffic (15.9 Erl) and 83 W for greater offered traffic (31 Erl).
30 40 50 60 70
12 14 16 18 20 22 24 26 28 30 32
Number of channels Nt
0 5 10 15 20
ΔW [%] ΔW [Wats] 25
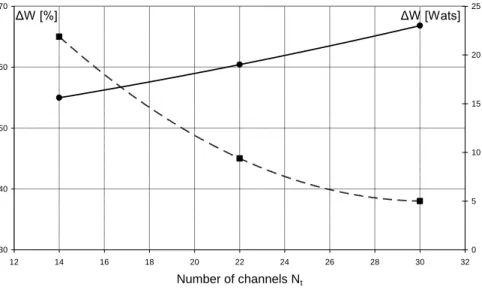
Figure 9
Difference of necessary power for 95% of connections in the case of small and great traffic as the function of the number of traffic channels
Fig. 9 presents the dependence of difference of necessary power (ΔW) for 95% of connections in the case of great and small traffic from the number of channels.
The difference is presented as the absolute value (ΔW[Wats]) and as the relative value (ΔW[%]). The relative value of the difference is calculated in relation to the smaller traffic.
Remark: the method of simulation is verified comparing the results obtained by simulation with the results of measurements presented in [15]. Unfortunately, the results of measurements from [15] are for a network without power control. That’s why this model is a very simple case.
Conclusion
The program for the simulation of telephone traffic can be upgraded in order to estimate the output power of one BTS in GSM. The program takes into account all
components, which can have influence on the output power in real situation: the number of traffic (TCH) channels, offered traffic, the distribution of surface users’
density in the cell, the influence of intra-cell connections, the influence of half- rate connections, the influence of a limited number of traffic sources, and the environmental influence on signal attenuation. The program can be used to estimate the mean output power of one BTS and the CDF of the probability of output power. The calculation of CDF of total output power of one BTS can be very complex, because it requires the calculation of the probability density function for the sum of random values for each channel’s power (convolution).
That’s why this simulation method is very important, especially in the case when the dependence of output power on the distance between MS and BTS is expressed by a complicated function. The main condition enabling the implementation of this simulation, is that the distribution function of the distance between MS and BTS. If CDF of the distance between MS and BTS is a complicated function, its inverse function can be obtained by mathematical programs, as MATLAB or MATHEMATICA.
The other important implementation of the simulation is to determine the BTS output power for very complex models, where it is difficult to obtain the results by calculation. These are the models with intra-cell traffic, the Engset model, models with complex distribution of users’ density in the cell, and models with a different environmental influence on signal attenuation.
The credibility of the results of this paper’s simulations are supported by comparison of its results to direct calculations.
References
[1] Niu, Z.: Advances in Green Communications and Networks, VTC2012- Spring
[2] Choi, J.: Green Radio, Approaches and Performance Analysis, (2012):
http://ccit.kaist.ac.kr/Lecture%20Notes/Green%20Radio%202.pdf, August 2012
[3] Heine, G.: GSM Networks: Protocols, Terminology and Implementation, Artech House, 1999
[4] Jovanović, P., Šuh, T., Lebl, A., Mitić, D., Markov, Ž.: Influence of Intra- cell Connections on the Traffic Calculation of Radio Resources in Mobile Network, Frequenz, Vol. 67, Issue 9-10, September 2013, pp. 315-320 [5] Winands, E. M. M., Wieland, J., Sanders, B.: Dynamic Half-Rate
Connections in GSM, AEU, Vol. 60, Issue 7, July 2006, pp. 504-512 [6] Šuh, T., Jovanović, P., Lebl, A., Mitić, D., Markov, Ž.: Comparison of the
Influence of Intra-Cell Traffic and Finite Number of Mobile Phones on the Determination of Number of Channels in the BTS of GSM Network, Frequenz, Vol. 68, Issue 3-4, March 2014, pp. 171-176
[7] Ebersprächer, J., Vögel, H.-J. and Bettstetter, Ch.: GSM, Switching, Services and Protocols, John Wiley & Sons, 1999
[8] Olsson, K. M.: Simulation on Computers. A Method for Determining the Traffic-Carrying Capacities of Telephone Systems, TELE, Vol. XXII, No.
1, 1970
[9] Kosten, L.: Simulation in Teletraffic Theory, 6th ITC, Münich, 1970 [10] Rodrigues, A. and de los Mozos, J. R.: Roulette Model for the Simulation
of Delay-Loss Systems, ITT Electrical Communication, Vol. 47, No. 2, 1972
[11] Jeruchim, M. C., Balaban, Ph. and Shanmugan, K. S.: Communication Systems, Modeling, Methodology and Techniques, Kluwer Academic Publishers, second edition, section 7.2.2., 2002
[12] Akimaru, H., Kawashima, K.: Teletraffic, Theory and Application, Springer, section 7.3.3., 1992
[13] Papoulis, A.: Probability, Random Variables, and Stochastic Processes, McGraw-Hill, 1965
[14] Iversen, W. B.: DTU Course 34340, Teletraffic Engineering and Network Planning, Technical University of Denmark, 2011
[15] Colombi, D., Thors, B., Persson, T., Wiren, N., Larsson, L. E., Jonsson, M., Tomevik, C.: Downlink Power Distribution for 2G and 3G Mobile Communication Networks, Radiation Protection Dosimetry, Vol. 157, No.
4, March 2013, pp. 477-487


