Data Descriptor: Transcriptome-
wide analysis of a baculovirus using nanopore sequencing
Zsolt Boldogkői, Norbert Moldován, Attila Szűcs & Dóra Tombácz
Autographa californica multiple nucleopolyhedrovirus(AcMNPV) is a prototypic baculovirus infecting specific insects. AcMNPV contains a large double-stranded DNA genome encoding a complex transcriptome. This virus has a widespread application as a vector for the expression of heterologous proteins. Here, we present a dataset, derived from Oxford Nanopore Technologies (ONT) long-read sequencing platform. We used both cDNA and direct RNA sequencing techniques. The dataset contains520,310AcMNPV and1,309,481 host cell reads using the regular cDNA-sequencing method of ONT technique, whereas altogether6,456 reads were produced by using direct RNA-sequencing. We also used a Cap-selection protocol for certain ONT samples, and obtained2,568,669reads by using this method. The raw reads were aligned to the AcMNPV reference genome (KM667940.1). Here, we openly released the‘static’and the dynamic transcript catalogue of AcMNPV. This dataset can be used for deep analyses of the transcriptomic and
epitranscriptomic patterns of the AcMNPV and the host cell. The data can be also useful for the validation of different bioinformatics software packages and analysis tools.
Design Type(s) transcription profiling design • gene expression analysis objective Measurement Type(s) transcriptional profiling assay • cDNA
Technology Type(s) RNA sequencing • DNA sequencing Factor Type(s) Species
Sample Characteristic(s) Spodoptera frugiperda • SF-9cell • Autographa californica multiple nucleopolyhedrovirus
Department of Medical Biology, Faculty of Medicine, University of Szeged, Szeged, 6720, Hungary.
Correspondence and requests for materials should be addressed to Z.B. (email: boldogkoi.zsolt@med.u- szeged.hu) or D.T. (email: tombacz.dora@med.u-szeged.hu)
OPEN
Received:23July2018 Accepted:23October2018 Published:4December2018
Background & Summary
Baculoviruses are a diverse group of viruses infecting insect larvae of the ordersDiptera, Hymenoptera, and Lepidoptera1. By far the most widely studied member of Baculoviridae family is theAutographa californica nucleopolyhedrovirus (AcMNPV), of which the complete genome sequence has been determined and annotated2. AcMNPV has a circular, double-stranded 134-kpb DNA genome, packaged in a rod-shaped capsid. AcMNPV has been used as a model in studies of the molecular pathogenesis of baculoviruses3. Additionally, this virus is a popular vector for the expression of heterologous proteins4. Although the previously published short-read Illumina RNA sequencing provides high-quality data5, the long-read sequencing (LRS) dataset is more beneficial; the LRS methods are more applicable for global RNA profiling, as they can greatly improve and expand the reference set of transcripts6–14, even if they have a relatively high error-rate and a low throughput.
In this study, the Oxford Nanopore Technologies (ONT) MinION long-read sequencing device was used to characterize the static and dynamic (including nine different post-infection time points) AcMNPV and host cell (Spodoptera frugiperda isolate Sf9) transcriptomes following various library preparation approaches, such as full-length cDNA-sequencing, direct RNA-sequencing (dRNA-seq) to avoid the potential false products from reverse-transcription or PCR, and cDNA-sequencing on 5′Cap- selected samples (Cap-seq) for the more precise detection of the transcription start sites. The applied full- length sequencing protocols capture the entire polyA(+) fraction of AcMNPV transcriptome.
Two MinION flow cells were used for the cDNA sequencing, while one and two flow cells were applied for the Cap-seq and dRNA-seq methods, respectively.
The cDNA sequencing of the static (mixed) sample yielded altogether 95,953 sequencing reads mapped to the AcMNPV genome strain E2 (GeneBank accession: KM667940.1) with an average coverage of 503x; (Table 1). Table 2 contains the detailed information about the read counts from different time points. The Cap-seq method resulted in 488,847 reads (2,108-fold coverage) AcMNPV-specific reads. The average read-lengths for the cDNA-seq vary between 689–1139 bp, while the Cap-seq and dRNA-seq resulted in an average read length of 718 bp and 613 bp, respectively (Table 2, Figs 1 and 2). The reads were also aligned to the host cell genome (BioProject accession: PRJNA380964, Tables 3 and 4, Figs 1 and 2).
Here, we present a large dataset of AcMNPV transcriptome derived from LRS experiments for thefirst time, including various techniques applied (Fig. 1). Our aim with this study was to provide a dataset that can be used for identifying mRNAs, non-coding transcripts, and transcript isoforms, such as the transcriptional start and end sites, along with splice variants of this baculovirus, as well as to define full- length transcripts by using a combination of various library preparation approaches for long-read sequencing. The barcoded samples derived from different time points can also be used for the kinetic characterization of AcMNPV transcripts, as well as for the analysis of gene expression of the host cells during viral infection15. Moreover, these data allow the comparison of different library preparation methods. Furthermore, our dataset can also be used for the identification of modified nucleotides and for obtaining epitranscriptomic data.
Methods
Figure 3 gives an overview of the methodological workflow used in the present study. The utilized reagents are listed in Table 5.
Cells, viruses and infection conditions
The Sf9 epithelial cell line (derived from the parentalSpodoptera frugiperda cell line) was used for the propagation of a LacZ expressing recombinant Autographa californica multiple nucleopolyhedrovirus (AcMNPV) in Sf-900 II SFM insect cell culture medium (Thermo Fisher Scientific). Cultivation of the infected cells was carried out in Corning Spinner Flasks (Sigma Aldrich/Merck) at 26 °C, the speed of the shaker was set to 70 rpm. The LacZ gene was inserted to the promoter region of polh gene (βgal- AcMNPV). The virus stock was obtained from SOLVO Biotechnology Inc. (Szeged, Hungary). Cells were infected with a multiplicity of infection of 2 plaque forming unit/cell. After infection, cells were incubated
cDNA- seq
95953 840 1060.76±2.39 702.89±1.56 2.83±0.01 5.92±0.01 7.31±0.01 503.45 816
dRNA- seq
2425 504 612.53±8.04 595.96±8.35 2.02±0.04 8.62±0.05 6.10±0.04 10.79 678
Cap-
seq 488847 627 723.10±0.53 577.88±0.45 2.75±0.00 3.70±0.00 4.81±0.00 2108.69 529
Table 1. Summary table of the cDNA-, dRNA and Cap-sequencing reads - from the mixed samples - mapped to the AcMNPV genome.Read N50 is defined as the length N for which 50% of all bases in the reads are in a sequence of length LoN.
for 0, 1, 2, 4, 6, 16, 24, 48 or 72 h pi, thenfive ml from the samples were centrifuged at 2000 rpm at 4°C, followed by washing with phosphate-buffered saline (PBS) and centrifuged again by setting the same parameters. Cells were stored at−80°C until use.
RNA extraction
Purification of total RNA. The NucleoSpin®RNA kit (Macherey-Nagel) was used to isolate RNA from viral infected cells for sequencing, as was described in our previous publications10. In short, samples were lysed by incubation in a chaotropic ion containing solution (supplied by the kit), then samples were treated with DNase I solution (provided by the kit). Total RNAs were eluted from the membrane in RNase-free water. To remove the probable residual DNA contamination, samples were handled by Ambion® TURBO DNA-free™ Kit (Thermo Fisher Scientific). The RNA samples were quantified by Qubit®. 2.0 Fluorometer using Qubit RNA BR Assay Kit (Life Technologies) and then they were stored at
−80 °C until further use.
Ribosomal RNA depletion. For the CAP-selection protocol, the ribosomal RNA (rRNA) was eliminated from the total RNA samples using the Epicentre Ribo-Zero™Magnetic Kit H/M/R (Illumina).
Sample Number of aligned reads
Median of read lengths
Average of readlengths±SE
Average of aligned read lengths±SE
Average Insertion frequency (%)±SE (%)
Average Deletion frequency (%)±SE (%)
Average Mismatch frequency (%)±SE (%)
Coverage N50
0h 135 1010 1139.68±53.61 638.67±40.74 4.05±0.21 3.51±0.17 5.84±0.25 0.64 661
1h 90 902 1037.20±70.43 624.51±51.52 4.08±0.29 3.52±0.22 5.72±0.26 0.42 660
2h 870 577 753.84±15.58 541.90±13.17 3.78±0.07 3.29±0.07 5.08±0.11 3.52 596
4h 21557 592 789.73±3.07 601.71±2.99 3.66±0.01 3.51±0.01 5.14±0.02 96.82 881
6h 19989 730 908.66±3.72 714.37±3.61 3.66±0.01 3.41±0.01 5.11±0.02 106.59 1025
16h 84201 582 689.09±1.27 492.74±1.23 3.63±0.01 3.17±0.01 5.14±0.01 309.69 509
24h 145127 593 738.07±1.04 543.22±1.01 3.66±0.01 3.14±0.00 5.11±0.01 588.47 598
48h 92564 617 737.39±1.26 535.93±1.14 3.68±0.01 3.16±0.01 5.15±0.01 370.30 517
72h 59824 633 867.47±2.41 650.31±2.16 3.56±0.01 2.99±0.01 4.94±0.01 290.40 894
Table 2. Summary statistics of the cDNA sequencing reads–derived from the different time points - aligned to the AcMNPV genome.Read N50 is defined as the length N for which 50% of all bases in the reads are in a sequence of length LoN.
Figure 1. Barplotfigure shows the read lengths of the static dataset.(a) Thefigure illustrates the average read lengths of the cDNA-Seq, dRNA-Seq and Cap-Seq samples, as well as the weighted arithmetic mean values from the individual time points. (b) This plot shows the average mapped read lengths of the different samples. AVG: Weighted arithmetic mean.
Isolation of polyadenylated RNA. For the cDNA and Direct RNA sequencing, the polyA(+) fraction of the RNA samples were purified using the Qiagen Oligotex mRNA Mini Kit, according to the“Spin Columns”protocol of the kit.
Thefinal concentrations of the rRNA depleted and the PolyA(+) RNA samples were determined with Qubit RNA HS Assay Kit (Life Technologies).
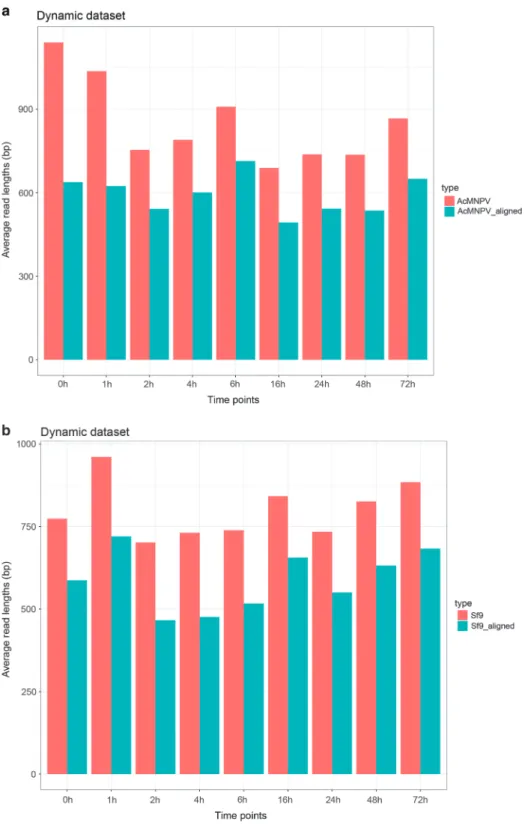
Figure 2. Barchart diagram represents the sequencing read length of the cDNA-sequencing of samples from various time points.(a) AcMNPV (b) Sf9.
Sample Number of aligned reads
Median of read lengths
Average of read lengths±SE
Average of aligned read lengths±SE
Average Insertion frequency (%)±SE (%)
Average Deletion frequency (%)±SE (%)
Average Mismatch frequency (%)±SE (%)
Coverage N50
cDNA- seq
210987 942 1236.91±2.07 879.06±1,71 3.49±0.01 5.75±0.00 6.66±0.01 0.361 1073
dRNA- seq
4031 284 499.18±16.11 274.47±6.03 3.21±0.11 5.03±0.09 3.72±0.06 0.002 466
Cap- seq
2079822 672 726.81±0.27 591.93±0.24 2.89±0.00 4.27±0.00 5.41±0.00 2.394 617
Table 3. Summary table of the cDNA-, dRNA and Cap-sequencing reads - from the mixed samples - mapped to the host genomeRead N50 is defined as the length N for which 50% of all bases in the reads are in a sequence of length LoN.
Sample Number of aligned reads
Median of read lengths
Average of read lengths±SE
Average of aligned
read lengths±SE Average Insertion
frequency (%)±SE (%) Average Deletion
frequency (%)±SE (%) Average Mismatch frequency (%)±SE (%)
Coverage H50
0h 169794 680 773.75±0.99 586.81±0.94 3.69±0.01 3.77±0.01 4.94±0.01 0.19 649
1h 20346 642 961.12±6.74 719.88±6.50 3.54±0.02 3.24±0.02 4.54±0.02 0.03 796
2h 27209 588 701.67±2.77 466.31±2.64 3.41±0.02 3.53±0.02 4.62±0.02 0.02 765
4h 46519 611 730.90±1.90 475.63±1.87 3.36±0.02 3.35±0.01 4.44±0.01 0.04 611
6h 60076 627 738.99±1.68 517.17±1.59 3.52±0.01 3.58±0.01 4.72±0.01 0.06 438
16h 275282 683 841.67±1.11 656.40±1.08 3.85±0.00 3.54±0.00 4.92±0.00 0.35 617
24h 299940 641 733.99±0.71 550.25±0.69 3.79±0.00 3.61±0.00 4.96±0.00 0.32 621
48h 80781 687 826.03±1.86 632.02±1.77 3.83±0.01 3.58±0.01 5.00±0.01 0.10 610
72h 118547 750 883.51±1.32 683.21±1.28 3.97±0.01 3.79±0.01 5.19±0.01 0.16 1629
Table 4. Summary statistics of the cDNA sequencing reads–derived from the different time points - aligned to the Sf9 genomeRead N50 is defined as the length N for which 50% of all bases in the reads are in a sequence of length L<N.
Figure 3. Dataflow diagram shows the detailed overview of the study design.
cDNA synthesis, library preparation and sequencing
The Oxford Nanopore Technologies MinION real-time device was used for cDNA and direct RNA sequencing.
Oxford Nanopore 1D cDNA sequencing - mixed RNA sample
Viral and Sf9 transcripts were sequenced on MinION sequencer following the 1D Strand switching cDNA by ligation protocol (Version: SSE_9011_v108_revS_18Oct2016). The ONT Ligation Sequencing Kit 1D (SQK-LSK108) was used for the library preparation. The PolyA(+)-selected RNAs were used for cDNA production. Equal amount of RNAs from the different time points were mixed together.
75 ng from the mixed sample (Table 6) was subjected to reverse transcription. Poly(T)-containing anchored oligonucleotides [(VN)T20; ordered from Bio Basic, Canada, (Table 7)] and dNTPs (10 mM, Thermo Fisher Scientific) was added to the RNA. The sample was incubated at 65°C for 5 min and then the strand-switching oligo [containing three O-methyl-guanine RNA bases (PCR_Sw_mod_3G; Bio Basic, Canada)], buffer and DTT [both are supplemented by the SuperScript IV Reverse Transcriptase kit (Life Technologies)] were added. The mixture was treated with a recombinant ribonuclease inhibitor (RNase OUT™, Life Technologies), and then it was incubated for 2 min at 42 °C. Two-hundred units from the 200U SuperScript IV Reverse Transcriptase enzyme were added to the sample. The generation of the first strand cDNA was performed at 50 °C for 10 min, then the strand switching step [when the reverse transcriptase adds 1–3 non-templated cytosines to the 3’end of the cDNA strand, and a primer (which was added to the RT reaction) anneals to the non-templated cytosines. This incorporates a PCR-priming sequence to the end of the full-length cDNAs] at 42 °C for 10 min. The enzyme inactivation step was at 80 °C for 10 min. Five μl from the cDNA was amplified using KAPA HiFi DNA Polymerase enzyme (Kapa Biosystems) and Ligation Sequencing Kit Primer Mix (included in the 1D Kit). The Applied Biosystems Veriti Thermal Cycler was used following the ONT 1D Kit’s recommendations: preliminary denaturation at 95 °C for 30 s (1 cycle); denaturation for 15 sec at 95 °C (15 cycles); annealing for 15 sec at 62 °C (15 cycles); extension for 4 min at 65 °C (15 cycles);final elongation step was for 10 min at 65 °C.
NEBNext End repair/dA-tailing Module (New England Biolabs) was applied for end repair, whereas NEB Blunt/TA Ligase Master Mix (New England Biolabs) was utilized for adapter ligations. The adapter sequences were provided by the 1D kit. Agencourt AMPure XP magnetic beads (Beckman Coulter) were used for sample purification after each enzymatic reaction. For the quantification of the libraries, the Qubit Fluorometer 2.0 and the Qubit (ds)DNA HS Assay Kit (both from Life Technologies) was used.
The sequencing-ready libraries were loaded on R9.4 SpotON Flow Cells, and the Albacore v1.2.6 software was used for base calling.
Oxford Nanopore 1D cDNA sequencing –different time points
For the analysis of the dynamic changes of the global full-length transcriptome of the AcMNPV, the RNA samples from different post infection time-points were individually sequenced. CDNAs were generated from the polyA(+) RNA samples from 0, 1, 2, 4, 6, 16, 24, 48 or 72 h pi. The starting amounts of RNA samples are summarized in Table 7. The preparation of cDNA libraries was carried out according the above mentioned 1D protocol, until the end-repair step. After this, the 1D PCR barcoding (96) genomic DNA protocol (version: PBGE96_9015_v108_revS_18Oct2016, updated 25/10/2017) was followed,
Macherey- Nagel RNA
Qiagen Oligotex mRNA mini Kit - SuperScript III - Direct RNA Sequencing Kit
SuperScript IV KAPA HiFi PCR Kit Ligation Sequencing Kit 1D
PCR Barcoding Expansion 1-96+Ligation Sequencing Kit 1D
- Epicentre Ribo-Zero™
Magnetic Kit H/M/R Lexogen Teloprime Kit enzymes & reagents Lexogen Teloprime PCR mix Ligation Sequencing Kit 1D
Table 5. Summary table of the reagents and chemistries used for the sequencing.
Sample Starting material (ng) Amount of the library after PCR (ng) Amount of the loaded library onto theflow cell (ng)
cDNA 75 475 170
dRNA 100 no PCR 46
Cap-seq 216 120 90
Table 6. Overview table of the amount of utilized nucleic acids for cDNA, dRNA and Cap-seq from mixed samples.
starting with the Barcode Adapter ligation step. Tenμl from the samples were mixed with 6.5μl Barcode Adapter (Table 8) and 17μl Blunt/TA Ligase Master Mix (1/3 reaction volumes were applied compared to the protocol’s recommendations). After 10 min incubation at room temperature, the samples were purified by using XP beads. Samples were amplified by PCR using KAPA HiFi DNA Polymerase and 1μl from one of the PCR Barcodes (Table 8), as recommended by the 1D PCR barcoding protocol. Table 8 shows the sample concentrations after the amplification. Samples were mixed together according to the Table 8 and altogether two libraries were prepared from them. The second end-prep and adapter ligation steps were carried out following the previously mentioned protocol. The ready libraries were washed by XP beads, and then they were load on the SpotONflow cell.
MinION cDNA sequencing on Cap-selected samples. The TeloPrime Full-Length cDNA Amplifica- tion Kit (Lexogen) was used to obtain full-length, capped RNAs with the exact 5’-ends. A mixed total RNA sample (containing RNA from 1, 2, 4, 6, 16, 24, 48 and 72 h pi) was subjected to rRNA-depletion and then, 216 ng from the ribo-depleted sample was used for reverse transcription (RT), double-stranded (ds)cDNA production and library preparation. First, the RNA was mixed with RT buffer and an oligodT containing primer (both are derived from the kit, Table 7). The RT mixture was heated to 70 °C for 30 seconds and then it was cooled down to 37 °C for 1 min. The RT enzyme and reagents (supplied by the kit) were added to the sample and the reaction was kept at 37 °C for an additional 2 min. Temperature was increased to 46 °C for 50 min. Silica columns (from the Lexogen kit) were used to purify the RNA- cDNA hybrid. An adapter was ligated to the cDNA by base-pairing of the 5’C to the cap structure of the RNA templates by using a double-strand specific ligase from the kit. Ligation reaction was carried out at 25°C, overnight, then the sample was purified using the silica columns. The Second-Strand Mix and the Enzyme Mix from the Teloprime kit were used to produce dscDNA. The cDNA synthesis was performed in a Veriti PCR thermal cycler, applying the following settings: 98 °C for 30 s, 50 °C for 90 s, 72 °C for
Sequencing method Name, availability Catalog # Sequence (50->30)
cDNA-seq Poly(T)-containing anchored primer [(VN)T20 - ONT recommended,
custom made (Bio Basic) - 5phos/ ACTTGCCTGTCGCTCTATCTTC(T)20VN
dRNA-seq RT adapter - Direct RNA Sequencing Kit (Oxford Nanopore Technologies)
SQK-RNA001 GAGGCGAGCGGTCAATTTTCCTAAGAGCAAGAAGAAGCCTTTTTTTTTT
Cap-seq TeloPrime Full-Length cDNA Amplification Kit (Lexogen) 013.08 & 013.24 TCTCAGGCGTTTTTTTTTTTTTTTTTT
Table 7. The list of different, oligod(T)-containing primers used in this study for the reverse transcription reactions.
Sample Starting material (ng) Amount of the library
after PCR (ng)
Amount of the loaded library onto theflow cell
Barcode #
1h 58 1224 ng 440 ng C2
2h 59 684 ng C3
4h 54 612 ng C4
6h 53 744 ng C5
16h 54.5 738 ng 410 ng C6
24h 60 570 ng C7
48h 52.5 351 ng C8
72h 56 360 ng C9
0h 50 600 ng C1
Table 8. Overview table of the amount of utilized nucleic acids for cDNA- seq for dynamic transcriptome analysis.
Primer 50->30
fw AACGTGCTGTTGAATTATGTGG
rev AAACTGTTATCAATTAGTTTCGTTT
Table 9. The sequence of the gene-specific primers used for the PCR amplification of 104.1 gene of AcMNPV.
dsDNA HS quantitation assay (Life Technologies) was used to measure the sample quantity. The specificity of the gained PCR product was analysed by using real-time PCR reaction: the Rotor-Gene Q qPCR cycler (Qiagen) was used, a gene specific primer (104.1, 10μM each; Table 9), ABsolute qPCR SYBR Green Mix (Thermo Fisher Scientific), and cDNA was mixed in 20μlfinal volume. The initial denaturation step was 94 °C for 15 min, and it was followed by 35 cycles of 94 °C for 25 s, 60 °C 25 s and 72 °C 6 s.
The PolyA(+)-CAP-selected samples were also subjected to MinION sequencing following the 1D Strand switching cDNA by ligation method. These cDNA samples were end-repaired and then they were ligated with the 1D adapters. Finally, they were loaded on the ONT R9.4 SpotON Flow Cells.
Direct RNA sequencing. The ONT’s Direct RNA sequencing (DRS) protocol (Version:
DRS_9026_v1_revM_15Dec2016) was used for amplification-free sequencing. Total RNAs from 7 time points (1, 2, 4, 6, 16, 24, 48 and 72 h pi) were mixed together, and then the PolyA(+) fraction was isolated from the mixture. One hundred ng from the sample (Table 6) was mixed with the oligodT-containing T10
adapter (RT adapter; part of the ONT Direct RNA Sequencing Kit; SQK-RNA001; ONT) and T4 DNA ligase (2 M U/ml; New England BioLabs). After 10 min incubation at room temperature, thefirst-strand cDNA synthesis was carried out in 40μlfinal volume using the SuperScript III Reverse Transcriptase enzyme (Life Technologies), following the DRS protocol: first the sample was incubated at 50 °C for 50 min, then the temperature was increased–in order to inactivate the enzyme–to 70 °C for 10 min in a Veriti PCR Cycler. Samples were purified with Agencourt AMPure XP Beads (Beckman Coulter). The beads were handled with RNase OUT (40 U/μl; Life Technologies) before usage: 2U enzyme was measured to 1μl bead. Washed RNA-cDNA hybrids were eluted in 20μl Ambion Nuclease-Free Water (Thermo Fisher Scientific). The sample was ligated to RMX sequencing adapter by using T4 DNA ligase and NEBNext Quick Ligation Reaction Buffer (New England BiceoLabs). Ligation reaction was performed at room temperature for 10 min. Samples were purified with the RNase inhibitor-treated XP beads using Wash Buffer (provided by the DRS Kit) and then eluted in 21μl Elution Buffer (DRS Kit).
The concentration of the adapter-ligated RNA-cDNA hybrids was detected by using the Qubit 2.0 Fluorometer and Qubit dsDNA HS Assay Kit (Life Technologies). Samples were loaded onto the R9.4 SpotON Flow Cell.
Data on the quality of sequencing reads - mapped to the AcMNPV and Sf9 genomes - including insertions, deletions, and mismatches, as well as the coverages are summarized in Tables 1–4.
Read processing
The Albacore software v1.2.6 (ONT) was used for base calling of the data from‘static’cDNA and dRNA sequencing, while the newer version of the software (v.2. 0.1) was utilized for the CAP-selected and dynamic datasets. The software was able to identify barcodes on 82% of the barcoded reads. The sequencing reads were aligned by using GMAP16, with the following settings: gmap -d Genome.fa –nofails -f samse File.fastq>Mapped_file.sam. The Porechop tool v0.2.3 was used with default setting except using flag –untrimmed to split original fastq file by barcodes. The quality information of the dataset was obtained by using our in-house scripts.
Code Availability
1. Albacore v2.0.1: https://github.com/Albacore/albacore
2. GMAP: http://research-pub.gene.com/gmap/ (version 2015-12-31) 3. Porechop v.0.2.3: https://github.com/rrwick/Porechop
4. Custom routines have been archived on Github (https://zenodo.org/record/1034511).
Data Records
Data from the mixed samples including cDNA-, dRNA- and Cap-seq (Data Citation 1), as well as the data from the dynamic dataset (Data Citation 2) have been uploaded to the European Nucleotide Archive. All sequencing reads were mapped to the KM667940.1 genome. All data can be used without restrictions.
Technical Validation
The quantity of the purified RNAs (including the total RNAs, the polyA-selected RNAs, as well as the rRNA-depleted samples), the produced cDNA samples and thefinal sequencing libraries were measured by Qubit 2.0 (Life Technologies)fluorometer using the Qubit RNA Broad-Range, High Sensitivity RNA and High Sensitivity dsDNA Assay Kits.
Usage Notes
This dataset provided here, was produced primarily to determine the complexity, to analyse the isoforms (potential splice variants, as well as transcriptional start and stop site variations) and the dynamic properties of AcMNPV transcriptome. The uploaded binary alignment (BAM)files contain reads already mapped to the KM667940.1 AcMNPV reference genome, as well as to the host genome (PRJNA380964)
using GMAP v2017-04-2415. The raw FastQfiles have also been uploaded for each sample to extend the potential usage of the data.
The provided dataset can be further analysed using bioinformatics tools, such as Tombo17, bedtools18 and samtools19, or using different visualization tools such as the IGV20, Geneious21 or Artemis22. The uploadedfiles have not been trimmed, they contain terminal poly(A) sequences as well as the 5′and 3′
adapters, which can be used to determine the orientations of the reads.
References
1. Martignoni, M. E. & Iwai, P. J.A catalog of viral diseases of insects, mites, and ticks. Report No. PNW-GTR-195. U.S. (Department of Agriculture, 1986).
2. Ayres, M. D., Howard, S. C., Kuzio, J., Lopez-Ferber, M. & Possee, R. D. The Complete DNA Sequence of Autographa californica Nuclear Polyhedrosis Virus.Virology202,586–605 (1994).
3. Guzo, D., Rathburn, H., Guthrie, K. & Dougherty, E. Viral and host cellular transcription in Autographa californica nuclear polyhedrosis virus-infected gypsy moth cell lines.J. Virol.66,2966–2972 (1992).
4. HU, Y. Baculovirus as a highly efficient expression vector in insect and mammalian cells.Acta Pharmacol. Sin.26, 405–416 (2005).
5. Chen, Y.-R.et al.W. The Transcriptome of the Baculovirus Autographa californica Multiple Nucleopolyhedrovirus in Tricho- plusia ni Cells.J. Virol.87,6391–6405 (2013).
6. Tombácz, D.et al.Full-Length Isoform Sequencing Reveals Novel Transcripts and Substantial Transcriptional Overlaps in a Herpesvirus.PLoS One.11,e0162868 (2016).
7. Chen, S.-Y., Deng, F., Jia, X., Li, C. & Lai, S.-J. A transcriptome atlas of rabbit revealed by PacBio single-molecule long-read sequencing.Sci. Rep7,7648 (2017).
8. Tombácz, D.et al.Long-Read Isoform Sequencing Reveals a Hidden Complexity of the Transcriptional Landscape of Herpes Simplex Virus Type 1.Front. Microbiol8,1079 (2017).
9. Moldován, N.et al.Multi-Platform Sequencing Approach Reveals a Novel Transcriptome Profile in Pseudorabies Virus.Front.
Microbiol8,2708 (2018).
10. Moldován, N.et al.Third-generation Sequencing Reveals Extensive Polycistronism and Transcriptional Overlapping in a Baculovirus.Sci. Rep8,8604 (2018).
11. Balázs, Z.et al.Long-Read Sequencing of Human Cytomegalovirus Transcriptome Reveals RNA Isoforms Carrying Distinct Coding Potentials.Sci. Rep7,15989 (2017).
12. Tombácz, D.et al.Transcriptome-wide survey of pseudorabies virus using next- and third-generation sequencing platforms.Sci.
Data5,180119 (2018).
13. Park, S.-G.et al.Long-read transcriptome data for improved gene prediction in Lentinula edodes.Data in Brief15, 454–458 (2017).
14. Wang, B.et al.Unveiling the complexity of the maize transcriptome by single-molecule long-read sequencing.Nat. Commun.7, 11708 (2016).
15. Tombácz, D.et al.Characterization of the Dynamic Transcriptome of a Herpesvirus with Long-read Single Molecule Real-Time Sequencing.Sci. Rep7,43751 (2017).
16. Wu, T. D. & Watanabe, C. K. GMAP: a genomic mapping and alignment program for mRNA and EST sequences.Bioinformatics 21,1859–1875 (2005).
17. Ono, S., Noguchi, Y., Sahara, R., Kawazoe, Y. & Ohno, K. TOMBO: All-electron mixed-basis approach to condensed matter physics.Comput. Phys. Commun.189, 20–30 (2015).
18. Quinlan, A. R. & Hall, I. M. BEDTools: aflexible suite of utilities for comparing genomic features.Bioinformatics26, 841–842 (2010).
19. Li, H.et al.The Sequence Alignment/Map format and SAMtools.Bioinformatics25,2078–2079 (2009).
20. Robinson, J. T.et al.Integrative genomics viewer.Nat. Biotechnol.29,24–26 (2011).
21. Kearse, M.et al.Geneious Basic: an integrated and extendable desktop software platform for the organization and analysis of sequence data.Bioinformatics28,1647–1649 (2012).
22. Rutherford, K.et al.Artemis: sequence visualization and annotation.Bioinformatics16,944–945 (2000).
Data Citations
1.European Nucleotide ArchivePRJEB24943 (2018).
2.European Nucleotide ArchivePRJEB27818 (2018).
Acknowledgements
This work was supported by the Swiss-Hungarian Cooperation Programme: SH/7/2/8 and by the NKFIH OTKA K 128247 to ZB. The work was also supported by the NKFIH OTKA FK 128252 and by the Bolyai János Scholarship of the Hungarian Academy of Sciences to DT. We would like to thank ErnőDuda Jr (SOLVO Biotechnology Ltd) for the AcMNPV stock.
Author Contributions
Z.B. designed the experiment, took part in sequencing, data analysis and wrote thefinal manuscript. N.M.
took part in sequencing experiments and data analysis. A.S. conducted bioinformatics analysis. D.T.
performed the sequencing, took part in data analysis and drafted the manuscript. All authors read and approved thefinal paper.
Additional Information
Competing interests: The authors declare no competing interests.
How to cite this article: Boldogkői, Z.et al. Transcriptome-wide analysis of a baculovirus using nanopore sequencing.Sci. Data. 5:180276 doi: 10.1038/sdata.2018.276 (2018).
Publisher’s note: Springer Nature remains neutral with regard to jurisdictional claims in published maps and institutional affiliations.
medium or format, as long as you give appropriate credit to the original author(s) and the source, provide a link to the Creative Commons license, and indicate if changes were made. The images or other third party material in this article are included in the article’s Creative Commons license, unless indicated otherwise in a credit line to the material. If material is not included in the article’s Creative Commons license and your intended use is not permitted by statutory regulation or exceeds the permitted use, you will need to obtain permission directly from the copyright holder. To view a copy of this license, visit http://creativecommons.
org/licenses/by/4.0/
The Creative Commons Public Domain Dedication waiver http://creativecommons.org/publicdomain/
zero/1.0/ applies to the metadatafiles made available in this article.
© The Author(s) 2018