Behavioral
Ecology ISBE
International Society for Behavioral Ecology Behavioral Ecology (2020), XX(XX), 1–14. doi:10.1093/beheco/araa112
Address correspondence to I. Maák. E-mail: bikmakk@gmail.com.
© The Author(s) 2020. Published by Oxford University Press on behalf of the International Society for Behavioral Ecology.
This is an Open Access article distributed under the terms of the Creative Commons Attribution License (http://creativecommons.org/licenses/by/4.0/), which permits unrestricted reuse, distribution, and reproduction in any medium, provided the original work is properly cited.
Original Article
Habitat features and colony characteristics influencing ant personality and its fitness consequences
István Maák,
a,Gema Trigos-Peral,
aPiotr Ślipiński,
aIrena M. Grześ,
bGergely Horváth,
cand Magdalena Witek
aa
Museum and Institute of Zoology, Polish Academy of Science, Wilcza 64, 00-679 Warszawa, Poland,
b
Department of Environmental Zoology, Institute of Animal Sciences, Agricultural University, Al.
Mickiewicza 24/28, 30-059 Kraków, Poland, and
cBehavioural Ecology Group, Department of Systematic Zoology and Ecology, ELTE Eötvös Loránd University, Egyetem tér 1–3, 1053 Budapest, Hungary
Received 22 September 2019; revised 22 August 2020; editorial decision 14 September 2020; accepted 1 October 2020.
Several factors can influence individual and group behavioral variation that can have important fitness consequences. In this study, we tested how two habitat types (seminatural meadows and meadows invaded by Solidago plants) and factors like colony and worker size and nest density influence behavioral (activity, meanderness, exploration, aggression, and nest displacement) variation on dif- ferent levels of the social organization of Myrmica rubra ants and how these might affect the colony productivity. We assumed that the factors within the two habitat types exert different selective pressures on individual and colony behavioral variation that affects colony productivity. Our results showed individual-/colony-specific expression of both mean and residual behavioral variation of the studied behavioral traits. Although habitat type did not have any direct effect, habitat-dependent factors, like colony size and nest den- sity influenced the individual mean and residual variation of several traits. We also found personality at the individual-level and at the colony level. Exploration positively influenced the total- and worker production in both habitats. Worker aggression influenced all the productivity parameters in seminatural meadows, whereas activity had a positive effect on the worker and total production in invaded meadows. Our results suggest that habitat type, through its environmental characteristics, can affect different behavioral traits both at the individual and colony level and that those with the strongest effect on colony productivity primarily shape the personality of in- dividuals. Our results highlight the need for complex environmental manipulations to fully understand the effects shaping behavior and reproduction in colony-living species.
Key words: aggression, behavioral syndrome, colony size, exploration, nest displacement, residual intraindividual variation.
INTRODUCTION
Studies on behavioral variation, including research on animal personality—nonrandom among-individual behavioral varia- tion consistent over time and/or ecological situations (i.e., change in conditions)—have become a prominent field of behavioral ecology in the last two decades (Réale et al. 2007; Sih et al. 2012).
Behavioral traits, like aggression, boldness, activity, or exploration, are frequently used by ecologists to test whether animals are re- peatable and whether distinct behaviors are correlated (Sih et al.
2010). If correlated, they are referred to as “behavioral type” in the context of an individual unit of a group and “behavioral syn- drome” as the property of groups, for example, populations (Sih et al. 2010). Most personality-related studies have been conducted on vertebrates, nevertheless, a substantial number of research con- ducted on a wide range of arthropod taxa also reported personality differences (e.g., insects: Kralj-Fišer and Schuett 2014; Planas-Sitja et al. 2015; Santostefano et al. 2017; Niemelä et al. 2019; crust- aceans: Briffa 2013; Horváth et al. 2019).
Nowadays, animal behavioral studies dedicate more attention to the degree of behavioral plasticity of individuals and its adaptive significance (e.g., Dingemanse et al. 2010; Keiser et al. 2018), as
Downloaded from https://academic.oup.com/beheco/advance-article/doi/10.1093/beheco/araa112/5970335 by 81728827 user on 08 January 2021
individuals can show variation in their reaction to changes in the environment (behavioral plasticity; see Dingemanse et al. 2010;
Westneat et al. 2011; Dingemanse and Wolf 2013; Mitchell and Biro 2017). However, even after accounting for environmentally in- duced intraindividual variation, a considerable residual variation remains, the so-called residual intraindividual variance in a phe- notype (e.g., Westneat et al. 2013). A growing number of both the- oretical and empirical studies suggest that residual intraindividual variation (hereafter: rIIV; see Biro and Adriaenssens 2013; Briffa 2013; Briffa et al. 2013), or in other words, the “rigidity” of an individual’s mean behavior in a certain environment should be considered as potentially independent components of indi- vidual behavioral strategy (Dingemanse et al. 2010; Briffa 2013;
Dingemanse and Wolf 2013; Westneat et al. 2013, 2015; Mitchell et al. 2016).
In social insects, natural selection acts not only on individuals but mostly at the colony level (perceived as a reproductive unit) (Korb and Heinze 2004), thus social species are excellent for studying the effect of behavioral variation on colony fitness, as this can be meas- ured at different levels of their organization. Moreover, similarly to workers, which are usually sterile individuals performing different tasks inside the nest, colonies also display consistent behavioral dif- ferences, showing in this way both individual and colony-level per- sonality (Jandt et al. 2014; Jeanson and Weidenmüller 2014; Wright et al. 2019). Therefore, considering colonies of social insects, var- ious levels of behavioral variation can be measured: intraindividual variability of workers, among-individual variation of workers within the same colony, and behavioral variation among colonies coming from the same population. However, the proximate mech- anisms affecting intraindividual variability as well as its wider eco- logical significance are still little explored and not studied in social insects (Keiser et al. 2018).
In general, the factors influencing individual and colony person- ality can be ascribed to two main categories: genetic and environ- mental (Wright et al. 2019). Many biotic and abiotic environmental characteristics, such as, for example, colony size (Dornhaus et al.
2012), population density (Modlmeier and Foitzik 2011), nest struc- ture (Pinter-Wollman et al. 2012), or the experience gained by cer- tain group members (Jeanson and Weidenmüller 2014; Gordon 2016) can influence the variability of collective behaviors or the mixture of different individual behaviors in a group (Pruitt and Goodnight 2014). Moreover, age and the social and local environ- ment (e.g., food availability, competition, predation, and climate) can influence the gene expression of individuals and determine their personality (Bengston and Jandt 2014; Wright et al. 2019).
However, the main issue is to understand the mechanisms leading to individual and group differences in the behavior.
Pinter-Wollman (2012) pointed out that the personality of social groups can depend on the personalities of the individuals com- prising them. Based on some new results, a direct linear link be- tween individual and colony behavior can be found, suggesting that the colony personality can be the average personality of workers involved in a given task (Carere et al. 2018). However, colonies of social insects can differ not only in their average worker person- ality but also in worker personality distribution, which represents the level of among-individual variance within the colony. It was demonstrated that such variation has significant fitness conse- quences as, for example, higher intracolonial variance in aggression has a positive influence on ant colony productivity (Modlmeier and Foitzik 2011). Environmental variability can also induce changes in group behavior (Pinter-Wollman et al. 2012; Gordon et al. 2013;
Bengston and Jandt 2014). Such plasticity may allow groups to cope with short-term environmental variation, but it is less well known if environmental conditions can create fixed or long-term effects on colony personality (Bengston and Jandt 2014). Although, the most probable scenario is a combination of all these factors (Pinter-Wollman 2012): mean colony personality, its distribution among colony members, and environmental influence.
Behavioral differences of group members can impact group per- formance and fitness (Wray et al. 2011; Bengston and Dornhaus 2014; Modlmeier et al. 2012, 2014; Blight et al. 2016). Moreover, individual behavioral traits, such as aggression, exploration, and boldness were found to have important fitness consequences in many different species (Smith and Blumstein 2008), including ants (Modlmeier and Foitzik 2011; Modlmeier et al. 2012). These studies also suggested that environmental factors such as habitat quality or population density can be associated with behavioral variation. Some papers have already shown the effect of climatic gradients on ant behavioral syndrome and its fitness consequences (Bengston and Dornhaus 2014; Segev et al. 2017). Contrary to previous studies, we wanted to directly analyze the relationship be- tween habitats, behavioral traits, and productivity of ant colonies on various levels of social organization. We would like to empha- size that our study is the first one performed on social insects to demonstrate the effect of habitat type and other habitat-related fac- tors on among- and intraindividual behavioral variation (i.e., be- havioral plasticity, rIIV), but also within and among colonies in nest displacement efficiency.
For our study, we chose a metapopulation system, formed by ant colonies living in seminatural wet meadows and meadows in- vaded by Solidago sp. plants. Our previous studies performed on ants inhabiting these two habitat types demonstrated different brood investments (Grześ et al. 2018) and that Myrmica ant colo- nies living in invaded meadows are smaller in size and also have lower nest densities (Lenda et al. 2013; Grześ et al. 2018; Trigos- Peral et al. 2018). Moreover, workers have to forage over longer distances probably because protein resources are the main limiting factor in invaded meadows (Lenda et al. 2013; Trigos-Peral et al.
2018). Such differences among ant colonies suggest that different habitat types can be characterized by various environmental and colony traits, as colonies have to face various selective pressures.
Furthermore, as a response to various selective pressures, different behavioral traits may affect differently the colony productivity in these two habitat types.
In this study, we studied four behavioral traits measured at individual-level (aggression and foraging behavior characterized by exploration, meandering, and activity) and one at colony level (nest displacement) in a Myrmica rubra ant metapopulation system inhabiting seminatural and invaded meadows. Our main goals were to test 1) the effects of various environmental and colony characteristics (habitat type and traits depending on the habitat type, as colony size, intra- and interspecific nest density, as well as the worker size) on the mean (i.e., among-individual and colony variation) and rIIV (i.e., intraindividual and colony rigidity) of be- havioral traits measured at individual and colony levels; 2) whether there are consistent individual differences among habitats (i.e., be- havioral types) and between-individual correlations among func- tionally different behavioral traits (i.e., behavioral syndromes). We also tested 3) whether the mean and variance of the behavioral traits measured at different levels (individual and colony) have an effect on the productivity parameters (different brood types) of ant colonies living in invaded and seminatural habitats.
Downloaded from https://academic.oup.com/beheco/advance-article/doi/10.1093/beheco/araa112/5970335 by 81728827 user on 08 January 2021
Meadows invaded by Solidago plants seem to create more homo- geneous environment thus we hypothesize lower behavioral trait variation of workers and colonies from this habitat type compared to ants living in seminatural meadows. According to the results of other studies (e.g., Modlmeier and Foitzik 2011; Maák et al. 2019), we also assumed that habitat and colony characteristics, mostly nest density and colony size will strongly influence both behavioral trait variation and plasticity of individuals and colonies. We also ex- pected that the level of rIIV differs between habitats. As previous studies suggest, a positive interaction between individual state and rIIV exists (DiRienzo and Montiglio 2016; Lichtenstein et al. 2017), thus we expect larger individuals to express higher rIIV. Moreover, we hypothesized that habitat type will affect the behavioral types of workers and colonies and that functionally different behavioral traits will show different behavioral syndromes on individual and colony levels. Finally, we assumed that because of various selec- tive pressures occurring in two habitat types, the effect of different behavioral traits on colony productivity will be different between the two habitat types. We assumed that in seminatural meadows, as a response to intraspecific competition, colonies with higher ag- gression level will have higher productivity, whereas in the invaded meadows, higher exploration skills and activity of workers will en- hance the productivity of Myrmica colonies.
MATERIAL AND METHODS Field data collection
The study was conducted at the beginning of August 2016 on the M. rubra metapopulation system occurring in grasslands near the city of Kraków (50°01′N/19°53′E) in a meadow complex occupying the flat-bed of the Vistula River valley, at an altitude of 200–240 m above sea level. Recently, many meadows have been invaded by goldenrod (Solidago spp.). Three seminatural meadows and three meadows invaded by goldenrod were randomly selected on the study site with a minimum distance of 1 km and a max- imum distance of 5 km among meadows. Meadows were separated from each other by a watercourse, forest, and a human settlement.
Seminatural meadows were those that had a surface covered 100%
by native plants, mainly Molinion caeruleae, but also with a high abundance of Sanguisorba officinalis and some rare plant species, such as Gentiana pneumonanthe, Gladiolus imbricatus, Iris sibirica, or Trollius europaeus. Meadows invaded by goldenrods were nearly pure stands (covered 90–100%) of Solidago plants, with only a few other plant species (Moroń et al. 2009).
Twelve M. rubra colonies were collected from three meadows with the main plant community formed by the Molinietum caeruleae association (further on seminatural habitats) and 11 colonies were collected from three grasslands invaded by goldenrod (further on invaded habitats). Nests were separated by a distance of at least 20–30 m to cover a large area from each meadow in order to in- clude potential habitat heterogeneity and to avoid the overlapping of the home ranges of focal colonies. We assessed the density of all other ant species nests around each M. rubra colony in a square of 9 m2, with the chosen M. rubra nest in the middle of the square.
During the statistical analyses, we considered separately the number of Myrmica nests (med: 1, min/max: 0/9) and all the nests belonging to other species found around our focal colonies (fur- ther on the number of allospecific nests; med: 1, min/max: 0/3).
About 10 ants from each of the found nests were taken to the labo- ratory for identification using the keys of Czechowski et al. (2012).
Afterwards, all focal colonies were excavated and transferred to the laboratory. In all the cases, we excavated a larger area around the nests and ensured that no more ants were present in the sur- rounding area (such procedure was used in all nest dimensions).
Myrmica ant colony size and productivity parameters
In the laboratory, for each colony we counted: 1) the number of adult workers (further on colony size; median: 1636, min/max:
219/5964) and 2) queens, 3) the number of ant larvae, 4) the number of ant pupae, which were divided into worker, male and queen (gyne) pupae, and 5) the number of winged queens and 6) males. The number of queens, larvae, and workers were correl- ated (Spearman rank correlation: 606.65 < S < 1117.9, P < 0.03, ρ > 0.45), so we decided to use only the number of workers (envi- ronmental factor at the individual-level but intrinsic at the colony level) in our statistical analysis. Information on the total number of larvae, pupae and winged sexual forms produced by the colony al- lowed us to calculate total colony production.
Colony rearing
After assessing colony size, each M. rubra colony was placed and maintained in a plastic container (24 × 15 × 12 cm) under iden- tical laboratory conditions for 3 weeks before the beginning of the behavioral assays. Box walls were coated with paraffin to prevent ants from escaping, whereas the bottom of the nest was filled with plaster. A small piece of wet sponge was added to each colony to maintain appropriate humidity, and it was covered by a flowerpot saucer with a notched entrance to provide a suitable and dark place for ants and their brood. Ants were fed twice per week with a 50%
glucose solution and frozen fly larvae. All colonies were reared in their original size; therefore, the colonies were provisioned with spe- cific amount of food according to their colony size.
Behavioral observations
After three weeks of acclimatization, from each colony, we choose 12 older workers (foragers) on the basis of the melanization level of the cuticle (Cammaerts-Tricot 1974). Selected ants had a dark-brown colored cuticle on their head and gaster. According to the classification presented by Cammaerts-Tricot (1974), these workers were 4–6 months old. Workers were used in three be- havioral assays: aggression, exploration, and locomotion. Each ant was individually marked using a personalized color combi- nation on the thorax and abdomen with the help of Art Deco enamel paint markers. For the period of the behavioral assays, the selected ants were separated from the original colony and kept inside small plastic containers (18 × 12 × 6 cm) with a wet sponge covered by a flowerpot saucer. The behavioral tests were performed 24 h after the removal of the workers and were con- ducted over the three following days. Workers from the same colony were always tested for all behavioral assays on the same day with a random order of the behavioral tests. There were 1 h breaks between the assays performed on the same day.
Altogether, we conducted three trial series, thus each worker was tested nine times (three times for aggression, three for explora- tion, and three for locomotion). In the analyses testing the effects of different characteristics on the mean- and residual variance of the behavioral traits, in those investigating the behavioral syn- drome and consistency (repeatability), but also in models testing the effect of behavioral traits on the productivity parameters
Downloaded from https://academic.oup.com/beheco/advance-article/doi/10.1093/beheco/araa112/5970335 by 81728827 user on 08 January 2021
at individual-level, we included only workers that were tested nine times (three times per assay, Ntrials = 681, Nindividuals = 227:
Nseminatural = 122, Ninvaded = 105). In the analyses testing the effect of mean and SD of behavioral traits on productivity, we included all the workers and trials that were performed (Ntrials = 750;
Nseminatural = 400, Ninvaded = 350). The reduced sample size was due
to the death or escape of some of the individuals (Nseminatural = 22,
Ninvaded = 27) during behavioral observations. After the behavioral
tests, we measured the head width of workers in order to express their body size (µm; further on worker size). The head of each ant was measured using a metallographic microscope under 100× magnification based on digital photographs taken with a digital camera (Panasis, ver. 2.4.2, Huvitz).
Aggression assays
Aggression was measured by confronting each worker with a freshly defrosted dead non-nestmate worker coming from one of the other colonies used during the experiments. We used dead workers as op- ponents to eliminate behavioral differences between our stimuli and to concentrate our interest on the response of the worker. Ants were killed by freezing at −20 °C and were thawed 10 min before the ex- periments. We used a new corpse for every worker tested. Before each aggression assay, a plastic cylinder coated with fluon (diam- eter: 3 cm) was put inside the box to segregate a small space with the focal ant inside (after each test the cylinder was slightly replaced within the box to avoid the potential effects of chemical traces left behind by alive or dead ants). After 30 s, we gently introduced the defrosted corpse of a non-nestmate. The initial encounter, which was defined as the first behavior of the focal ant with the corpse, was recorded and scored as follows: fleeing (rapid movement of the focal ant in the opposite direction) = 0; antennation = 1; mandible opening = 2; biting or stinging = 3.
Exploration assays
To measure how ants explore a new environment, we tested indi- vidual exploration ability (further on exploration). We used a trans- parent plastic box (18 × 12 × 6 cm) with a sheet of gridded paper (twenty-four 9 cm2 squares) fixed under its bottom. Before the start of each observation, the focal ant was carefully placed inside the tube (5.7 cm long Falcon plastic tube covered with aluminum foil), which was always placed at the same specific location (on the middle grid line in the left side of the box). The entrance of the tube was locked with a plastic cork for 2 min. After this time, the plastic cork was carefully removed, and we measured the time spent by the worker to emerge from the refuge. If the ant left the refuge, the number of new squares (exploration) that were entered during its path was recorded and used in future analysis. Each observation lasted for 3 min. The plastic boxes and tubes were cleaned with al- cohol and changed between the trials. They were reused only after every fourth trial.
Locomotion assays
Locomotory assays were performed to test the physical proper- ties of ant movement. The locomotion of workers was studied by tracking the movement of a worker in a Petri dish (10 cm diam- eter). Before the video tracking, the ant was gently placed with the use of a soft pincette into a small plastic cylinder coated with fluon (diameter: 3 cm) in the center of the Petri dish. The ants were al- lowed to acclimatize for 2 min; after this period, the cylinder was removed and the individuals could freely move inside the dish. The
movement of the ant was recorded for 3 min by using a Microsoft LifeCam Studio camera (1280 × 720 pixels resolution) placed 20 cm above the Petri dish. The locomotive behavior of each ant was analyzed by automated tracking software (EthoVision® XT v. 12; Noldus Information Technology 2016). A threshold move- ment of 0.05 cm was used as an input filter to eliminate system noise or slight body movements that were not associated with lo- comotion (Bernadou et al. 2015). Two behavioral parameters were calculated from each digitized paths: 1) total distance traveled by an individual (further on activity) during the three minutes of ob- servations (cm) and (2) meandering (°/cm; further on meandering):
mean absolute change in the direction of movement of the ant rel- ative to the distance moved (Bernadou et al. 2015). The Petri dishes were cleaned with alcohol and changed between the trials.
Nest displacement assays
To assess nest displacement ability, we selected 15 old workers, 5 young workers (to ensure brood care) as well as 10 ant larvae of similar size from each colony and transferred them to a plastic box (30 × 16 × 10 cm). Inside the box, we prepared a flowerpot saucer nest as described before. After the ants were transferred, we waited 24 h for their acclimatization. Before the start of the experiment, we placed the same flowerpot saucer construction at the opposite end of the plastic box, which was followed by the removal of the old flowerpot saucer nest (to imitate nest destruction). The ants were removed by slight shakes and knocks, but without touching them with foreign objects. The observation started at the time of the removal of the old flowerpot saucer and we recorded the trans- port time of the first and last larvae into the new nest chamber.
However, we used only the time of transport of the last larvae in further analysis (further on nest displacement efficiency) as it in- cludes both important characteristics defining nest displacement ef- ficiency (the time needed for new nest site discovery and the time span between the first and last larval transport) (see also Maák et al.
2019). We repeated this experimental procedure three times for each colony by selecting different workers and larvae each time and by using different boxes and nest chamber elements.
Ethical note
The stress caused to ants during their collection in the field and their transport to the laboratory was minimized as much as pos- sible. In the laboratory, colonies were maintained under nearly natural living conditions, thereby maximizing their welfare and sur- vival. During the experiments, we performed only behavioral ob- servations and non-invasive contacts with the ants. No individuals were intentionally harmed or subjected to stressful situations. After the end of the experiments, colonies were kept in the laboratory until their natural death.
Statistical analyses
Effect of habitat and colony characteristics on mean- and residual variance
In order to model individual differences in among-individual var- iance and rIIV, we applied a double hierarchical general linear modeling (DHGLM) approach (see Westneat et al. 2013; Cleasby et al. 2015; Houslay and Wilson 2017). This method allows for iter- ations between two linear mixed-effect models, one explaining the mean and the other explaining residual dispersion, thus made pos- sible the simultaneous modeling of the mean and residual variance level effects. We have to note here that based on three behavioral
Downloaded from https://academic.oup.com/beheco/advance-article/doi/10.1093/beheco/araa112/5970335 by 81728827 user on 08 January 2021
measurements per individual predictability estimates presented here might be of low precision (see Cleasby et al. 2015) and thus, our results regarding this analysis must be treated with caution.
However, we believe our results are still informative in that individ- uals consistently differ in residual intraindividual variance and co- variation between among- and intraindividual behavioral variance may arise. As this notion might be novel in the field of social-insect research, we find it useful to present this aspect of the study.
We fitted a mean model (equation 1.1) with the fixed effects of worker size (β 1), colony size (β 2), number of Myrmica nests (β 3), number of allospecific nests (β 4), habitat type (β 5; factor with levels 0 or 1), and number of repeats (number of behavioral assays; β 6).
The model also included the random intercept effect of individual identity (ID), giving a predicted value for the intercept of each IDj
(j = 1: NID). We also fitted a random intercept of colony identity to control for colony effects, giving a predicted value for each of the 23 colonies (k) as a deviation from the fixed effects. We defined alternative models in the lme4 R package (Bates et al. 2015) and examined their goodness of fit relative to the model described in equation 1.1 by using likelihood ratio test. These investigations re- vealed that both random intercept terms are significant (P < 0.001 for both IDµj and colony k).
The residual model (equation 1.2) was fitted with the fixed ef- fects of worker size, colony size, number of Myrmica nests, number of allospecific nests and habitat (with “γ” representing fixed effect coefficients), and also a random intercept of ID, that modeled in- dividual differences in rIIV. Following the methods of Mitchell et al. (2016), we allowed for a covariance (equation 1.3) between predicted mean values of activity (IDµj, equation 1.1) and predicted log-standard deviation (I Dσεj, Equation 1.2) among individuals.
µjk∼β0+β1worker size +β2colony size +β3Myrmicanests +β4 allospecif ic nests +β5habitat type +β6repeats +I Dµj+ colonyk
(1.1) loge(σε)j∼ γ0+ γ1worker size +γ2colony size +γ3Myrmica nests +γ4allospecif ic nests +γ5habitat type+IDσεj,
(1.2) I Dσεj∼ MVN(0, Ω): ΩID=
ñσI D2µ
COVI Dµ,I Dσω2I D
σε
ô (1.3) We analyzed each behavioral trait separately. For nest displace- ment, we could estimate variance on the between-colony and within-colony level, thus the models were built in the same way as described above, the only difference being that colony identity was fitted as a sole random intercept. Aggression, meandering, and nest displacement were log-transformed to achieve normality.
Behavioral scores and continuous fixed effects were centered (stand- ardized to mean = 0, standard deviation = 1) to aid model fitting and to facilitate comparison of variance parameters. Therefore, variances of random intercepts in the mean model can be inter- preted as proportions of the total phenotypic variances of the dataset. The normality of random effects and the residual variation were checked visually in plots of predicted random effect values fitted versus residual values. All parameters were given uninforma- tive priors. Model code is available via the Supplementary Material.
Behavioral syndrome and consistency
To test for among-trait (co)variation at the among-colony, among- individual, and intraindividual (residual) level, we ran two
separate multivariate mixed-effect models. In the first model, the four individual-level behavioral traits were fitted as response vari- ables, habitat type as an explanatory factor, while “colony” and
“individual” were random effects. A second model was fitted to estimate among-colony and within-colony (co)variation across nest displacement and the other behavioral traits. However, from this model, only the among-colony (co)variation of the behavioral traits and the nest displacement was taken into account, as the within- colony (residual) (co)variation was measured on different levels in the traits. In this model, the five behavioral traits were response variables, habitat type as an explanatory factor, and “colony” was used as a random effect. Based on our model, we decomposed phenotypic correlations into among-colony, among-individual, and intraindividual (residual) correlations, using among-colony and among-individual phenotypic correlations as an indicator of behavioral syndromes (see Garamszegi et al. 2012; Herczeg and Garamszegi 2012; Dingemanse and Dochtermann 2013). The re- sults are given as correlation coefficients and their 95% credibility intervals.
The consistency of each behavioral trait at the colony (12 indi- viduals per colony) and individual (3 repetitions per individual) level were calculated with intraclass correlations (RICC, Lessels and Boag 1987) by using LMM-based (Gaussian data fit, Nbootstrap = 1000) cal- culations (Nakagawa and Schielzeth 2010) with colony and indi- vidual identity as random factors.
Colony and individual behavioral traits affecting productivity parameters
The effects of themean and the SD (referring to the among- individual variance) of colony level behavioral traits on the total production of the colonies were analyzed only altogether for the two habitats. In the GLM (negative binomial error, maximum like- lihood fit, N = 23), total production was included as dependent variable, habitat type was included as a fixed factor, while the mean (aggression, exploration, activity, meandering, and nest dis- placement) and SD (aggression, exploration, activity, meandering, and nest displacement) of the behavioral traits were included as covariates/explanatory variables. The same model construction but separate models were used for testing the effect of different behav- ioral traits on the number of new gynes (gyne pupae + winged), males (gyne pupae + winged), and workers (larvae + pupae).
Considering the period of the year and species biology (Radchenko and Elmes 2010), all the larvae were treated as worker larvae.
The effects of individual behavioral traits (measured at the individual-level) on total colony production were analyzed with GLMMs (negative binomial error, maximum likelihood fit, Ntotal= 681), except the total production in invaded meadows, where LMM was used (Gaussian error, maximum likelihood fit; N = 681). In the full models, behavioral traits were included as fixed effects, while individual ID as a combined random factor. The same model con- struction but separate models were used for testing the effect of dif- ferent behavioral traits on the number of new gynes (gyne pupae + winged), males (male pupae + winged), and workers (larvae + worker pupae). Having information already about the effect of dif- ferent habitat type (invaded vs. seminatural) on colony productivity parameters (Grześ et al. 2018), the analyses on the effect of the dif- ferent individual behavioral traits were conducted separately for the two habitats types (Nseminatural = 366, Ninvaded = 315). New males were found only in a low number of colonies from the invaded habitats, so the results of these analyses were not included.
Downloaded from https://academic.oup.com/beheco/advance-article/doi/10.1093/beheco/araa112/5970335 by 81728827 user on 08 January 2021
All statistical analyses were carried out in the R Statistical Environment (R Core Team 2019). Models were fitted in the Bayesian, Markov Chain Monte Carlo software JAGS (Plummer 2003), through the rjags interface (Plummer et al. 2019).
Multivariate mixed models were fitted using the MCMCglmm function from the MCMCglmm R package (Hadfield 2010), which implements a Bayesian framework for model fitting with long it- erations (1 300.000 with 300 000 burn-in periods); the Markov chain was sampled at each 1000th iteration. Consistency was calculated with the rpt function (rptR package, Stoffel et al.
2017). All LMMs and GLMMs were performed using the lmer or glmer function, respectively (lme4 package, Bates et al. 2013), automated model selection with the help of the dredge function (MuMIn package, Bartoń 2013). If models were overdispersed, negative binomial error structure was applied (see Lindén and Mäntyniemi 2011). Linear models were performed using the lm function; GLMs with the glm.nb function and automated model selection with the help of the stepAIC function (MASS package, Venables and Ripley 2002). All variables were standardized be- fore the analysis (Gotelli and Ellison 2004).
RESULTS
Effect of habitat and colony characteristics on mean- and residual variance of ant behavior
Based on our models, mean individual activity (described by total distance traveled) became lower across the trials (Table 1). Both random effect terms (individual and colony ID) explained varia- tion in the mean activity (activity had an individual and a colony- specific expression; Table 1). We found that individual activity was less predictable (i.e., high rIIV) when more Myrmica nests were
around (Table 1), while the pattern was the opposite regarding the number of allospecific nests around the focal colonies (Table 1).
Individual random effects term explained variation (substantial among-individual variation) in rIIV (Table 1). For the remaining nonsignificant effects, see Table 1. We found no significant corre- lation between individual mean and rIIV of activity (rInt,rIIV = 0.21 [−0.13–0.56]).
Mean and rIIV of individual meanderness was not affected by any of the habitat and colony characteristics. Meanderness had an individual and a colony-specific expression (Table 1). There was substantial among-individual variation in rIIV (Table 1). For the remaining nonsignificant effects, see Table 1. More mean- dering individuals also tended to be less predictable (rInt,rIIV = 0.98 [0.61–0.81]).
The mean individual exploration was not affected by any of the fixed effects (Table 1); however, it had both an individual and a colony-specific expression (Table 1). Individual exploration was more predictable (i.e., low rIIV) with larger colony size (Table 1).
There was also a substantial among-individual variation in rIIV (Table 1). For the remaining nonsignificant effects, see Table 1.
Individuals with larger rIIV (i.e., low predictability) tended to be less explorative (rInt,rIIV = −0.96 [−0.99 to −0.89]).
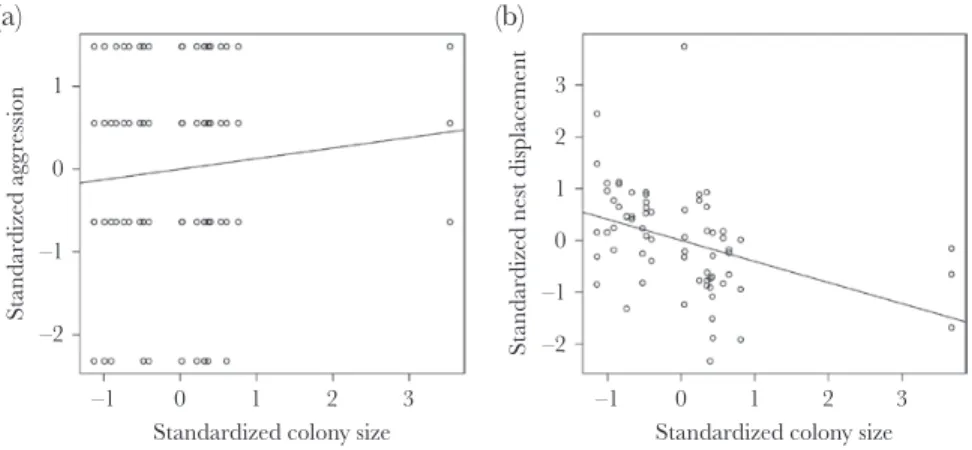
The individual mean aggression increased with colony size (Table 1; Figure 1A). Moreover, aggression had both an individual and a colony-specific expression (Table 1). The residual level of aggression was not affected significantly by any of the fixed ef- fects, but there was a substantial among-individual variation in rIIV (Table 1). We found no significant correlation between in- dividual mean behavior and rIIV of aggression (rInt,rIIV = 0.09 [−0.17–0.38]).
The only behavior estimated on the colony level was nest dis- placement efficiency. According to our model, the mean nest
Table 1
Sources of variation in activity, exploration, meanderness, and aggression of M. rubra ants. Estimates were derived from a double hierarchical general linear model
Activity Meanderness Exploration Aggression
Model Posterior mean (95% CrI) Posterior mean (95% CrI) Posterior mean (95% CrI) Posterior mean (95% CrI)
(a) Mean β β β β
Intercept −0.11 (−0.75–0.58) 0.13 (−0.59–0.85) −0.1 (−0.81–0.69) 0.35 (−0.23–0.51)
Worker size −0.06 (−0.18–0.06) 0.007 (−0.07–0.09) 0.05 (−0.06–0.15) −0.03 (−0.15–0.02)
Colony size 0.16 (−0.07–0.38) −0.072 (−0.31–0.14) 0.14 (−0.31–0.37) 0.11 (0.007–0.21)
Nr. of Myrmica nests 0.04 (−0.21–0.28) −0.067 (−0.29–0.16) 0.04 (−0.21–0.29) −0.004 (−0.19–0.25) Nr. of other nests −0.22 (−0.45–0.007) 0.21 (−0.005–0.44) −0.09 (−0.32–0.15) −0.14 (−0.38–0.03)
Habitat type 0.08 (−0.38–0.49) −0.15 (−0.61–0.32) 0.03 (−0.64–0.54) −0.29 (−0.42–0.15)
Nr. of repeats −0.17 (−0.21 to −0.12) 0.01 (−0.02–0.04) −0.01 (−0.05–0.04) 0.004 (−5.570e−06–0.07)
σ 2 σ 2 σ 2 σ 2
Individual (random intercept) 0.58 (0.45–0.67) 0.36 (0.28–0.44) 0.45 (0.38–0.54) 0.57 (0.48–0.65)
Colony (random intercept) 0.43 (0.27–0.66) 0.43 (0.22–0.66) 0.49 (0.24–0.86) 0.61 (0.36–0.9)
(b) Residual variation γ γ γ γ
Intercept −0.69 (−0.98 to −0.37) −1.02 (−1.44 to −0.6) −0.44 (−0.75 to −0.15) −7.82 (−11.06 to −0.18)
Worker size 0.03 (−0.06–0.12) −0.06 (−0.18–0.07) −0.06 (−0.15–0.04) 0.19 (−0.82–1.21)
Colony size −0.07 (−0.16–0.01) −0.13 (−0.25–0.002) −0.16 (−0.26 to −0.07) −0.26 (−1.8–1.04) Nr. of Myrmica nests 0.097 (0.01–0.18) 0.02 (−0.11–0.16) −0.05 (−0.15–0.05) −0.35 (−1.19–0.49) Nr. of other nests −0.098 (−0.19 to −0.001) 0.07 (−0.05–0.2) 0.01 (−0.08–0.1) −0.04 (−0.36–0.46)
Habitat type 0.13 (−0.06–0.32) 0.21 (−0.07–0.48) 0.05 (−0.15–0.24) −0.98 (−2.99–1.24)
σ 2 σ 2 σ 2 σ 2
Individual (random intercept) 0.26 (0.01–0.42) 0.7 (0.59–0.81) 0.4 (0.31–0.49) 7.68 (0.07–9.99) Worker size, colony size, number of nearby Myrmica nests, number of nearby allospecific nests, habitat type (factor with two levels: Seminatural vs. Solidago) and Day (day of behavioral trial) were fitted as fixed effects without interactions. Posterior means and 95% credible intervals (CrI) are shown. Effects strongly supported by the model (95% CI not overlapping) are in bold font. Effects on (a) means and (b) the residual variation.
Downloaded from https://academic.oup.com/beheco/advance-article/doi/10.1093/beheco/araa112/5970335 by 81728827 user on 08 January 2021
displacement efficiency increased with colony size (Figure 1B) and with allospecific nest density (Table 2). Nest displacement had a colony-specific expression (Table 2). Moreover, there was also a substantial among-colony variation in the residual variation (among-individual variation in this case; Table 2). We found no sig- nificant correlation between among- and within-colony variation in nest displacement (r = −0.35 [−0.99–0.73]). For the remaining nonsignificant effects, see Table 2.
Behavioral syndrome
We found no effect of habitat type on the among-trait (co)var- iation measured at individual (effect = 0.07, CrI [−0.16–0.37], pMCMC = 0.52) and colony (effect = 0.02, CrI [−0.19–0.3],
pMCMC = 0.94) levels. The behavioral syndrome at individual- level involved all the studied traits (activity, exploration, aggression, and meanderness; Table 3). Individuals that were more active, were also more explorative and aggressive, whereas showed a less mean- dering pathway. However, at colony-level, we found a behavioral syndrome related to foraging involving activity, exploration, and meanderness (Table 3). Within individuals, only the activity and meanderness were correlated (Table 3).
Behavioral consistency
The colony-level consistency of the studied behavioral traits was low but significant for all of the studied behavioral traits (Table 4).
The lowest consistency values at the colony-level were found for ag- gression (R = 0.13), whereas the highest for nest displacement effi- ciency (R = 0.41; Table 4). On the other hand, the consistency of the behavioral traits was much higher at individual-level with the lowest value found for exploration (R = 0.22; Table 4).
We also considered behavioral consistency separately for the two habitat types. In the seminatural habitat, colony-level consist- ency (R = 0.16–0.37) became higher than in the invaded meadows (R = 0.11–0.13; Supplementary Table S1), except nest displace- ment efficiency (Rseminatural = 0.36; Rinvaded = 0.42; Supplementary Table S1). On the other hand, the individual-level consistency be- came lower (every behavioral trait: R = 0.16–0.28) compared to the invaded meadows (R = 0.27–0.38; Supplementary Table S1).
Colony behavioral traits affecting productivity parameters
The total production of Myrmica colonies was higher with higher among-individual variation of workers (SD) in the terms of aggres- sion, mean exploration, and mean meanderness but became lower with the higher mean (Figure 2A) and variability (SD) of nest dis- placement, and variability of the meanderness (Table 5). The pro- duction of workers was positively affected by the mean exploration and meanderness but also when colonies were more variable (SD) in terms of aggression and activity (Table 5). On the other hand, mean and higher variability of nest displacement but also higher variability of meanderness had a negative effect on the production of new workers (Table 5). The production of new gynes was af- fected positively by the mean for aggression (z = 3.2, P = 0.001;
Figure 2B). Mean exploration (z = -1.05, P = 0.29) and mean ac- tivity (z = 1.24, P = 0.22) were also included in the best model, but their effect was not significant.
1
(a) (b)
0
–1
–1 0
Standardized colony size
1 2 3 –1 0
Standardized colony size
1 2 3
Standardized aggression
–2
3 2 1 0 –1 Standardized nest displacement –2
Figure 1
The effect of standardized colony size on the standardized aggression (A) and standardized nest displacement efficiency (B). The black lines are plotted using the formula of linear regression (y ~ x).
Table 2
Sources of variation in nest displacement behavior of M. rubra ants. Estimates were derived from a double hierarchical general linear model
Model Posterior mean (95% CrI)
(a) Mean β
Intercept 0.11 (−0.74–0.91)
Head size −0.1 (−0.41–0.22)
Colony size −0.49 (−0.86 to −0.18)
Nr. of Myrmica nests 0.06 (−0.27–0.4)
Nr. of allospecific nests −0.32 (−0.61 to −0.02)
Habitat type −0.09 (−0.59–0.43)
Nr. of repeats −0.1 (−0.26–0.07)
σ 2
Colony (random intercept) 0.34 (0.08–0.67)
(b) Residual variation γ
Intercept −0.03 (−1.17–0.97)
Head size 0.06 (−0.32–0.44)
Colony size 0.12 (−0.22–0.48)
Nr. of Myrmica nests 0.14 (−0.23–0.53)
Nr. of allospecific nests −0.02 (−0.42–0.4)
Habitat type −0.19 (−0.85–0.52)
σ 2
Colony (random intercept) 0.5 (0.16–0.95)
Head size, colony size, number of nearby Myrmica nests, number of nearby allospecific nests, habitat type (factor with two levels: Seminatural vs. Solidago) and Day (day of behavioural trial) were fitted as fixed effects without interactions. Posterior means and 95% credible intervals (CrI) are shown.
Effects strongly supported by the model (95% CI not overlapping) are in bold font. Effects on (a) means and (b) the residual variation.
Downloaded from https://academic.oup.com/beheco/advance-article/doi/10.1093/beheco/araa112/5970335 by 81728827 user on 08 January 2021
Individual behavioral traits affecting the production parameters
In the seminatural habitats, total production and the production of new workers were positively affected by workers’ aggression and exploration, and negatively by meanderness (Table 6). The production of new gynes was also positively affected by workers’
aggression and negatively by the meanderness (Table 6). In the in- vaded habitat, total production and the production of new workers were positively affected by workers’ activity and exploration, while total production was affected negatively only by meandering (Table 6). The production of new queens was not affected by any of the behavioral traits (Table 6).
DISCUSSION
Our study shows, for the first time in social insects, the effects of en- vironmental and colony characteristics on the mean- and residual variance of ant behavior measured at the individual and colony levels. All the studied behavioral traits showed substantial among- individual and colony variation, indicating repeatable differences in these levels in M. rubra ants. Workers and colonies also exhib- ited within-individual/colony variation linked to external variables and so showed phenotypic plasticity. Moreover, workers and colo- nies differed also in their residual variation. Although habitat type did not have a direct effect on the means or residual variation of studied behavioral traits, the different, habitat-dependent environ- mental and colony characteristics affected both the between and within individual/colony behavioral variation.
One of the most important factors influencing ant behavior seems to be colony size. We found that in larger colonies the mean forager aggression is higher compared to smaller colonies and also the mean nest displacement efficiency increased with colony size.
Moreover, exploration was more predictable within individuals of larger colonies. Nest density is also affecting mean and variation of Myrmica ant behavior to a high degree. The nest displacement effi- ciency increased and the individual activity was more predictable when more allospecific nests were around focal colonies, however, the higher number of Myrmica nests resulted in less predictable in- dividual activity. More predictable individuals were also less mean- dering and more explorative. Our results clearly demonstrated the existence of behavioral variation among Myrmica workers (foragers) in activity, meanderness, exploration, and aggression as well as var- iation among Myrmica colonies for the nest displacement ability.
However, the individual and colony personality did not differ be- tween the two studied habitats, suggesting low plasticity in the be- havior. The behavioral traits show a habitat type-dependent role in determining colony productivity.
Invasive plants can induce negative changes in ground-dwelling arthropod assemblages (Schirmel et al. 2011; Gallé et al. 2015), usually by altering habitat structure (Hejda et al. 2009), but also by changing the nesting site (Somogyi et al. 2017) or food availability (Lenda et al. 2013; Trigos-Peral et al. 2018). The results of our pre- vious studies performed on M. rubra ants living in meadows invaded by Solidago plants (Lenda et al. 2013; Grześ et al. 2018; Trigos-Peral et al. 2018) suggest that there can be different selective pressures on ant colonies living in these two habitat types thus we expected to find the differences in individual and/or colony personalities.
Table 4
Repeatability estimates for the studied behavioral traits altogether for the two habitat types on colony- and on individual-level of M. rubra ants. Repeatability values (R) and 95% CI are shown. Significance (P) estimates are based on randomization tests
Behavioral traits Colony-level
N = 68; R (95% CrI) Individual-level N = 681; R (95% CrI)
Activity 0.2 (0.087–0.315) 0.33 (0.242–0.419)
Aggression 0.13 (0.044–0.223) 0.27 (0.181–0.352) Exploration 0.18 (0.074–0.288) 0.22 (0.142–0.303) Meandering 0.25 (0.117–0.378) 0.28 (0.203–0.371) Nest displacement 0.41 (0.125–0.636)
Effects strongly supported by the model (95% CI not overlapping) are in bold font.
Table 3
Correlations among behavioral traits: r (95% CrI) Behavioral
traits Level r (95% CrI)
Activity – Exploration Between colonies 0.89 (0.77–0.97) Between individuals 0.91
(0.72–0.97)
Residual 0.02
(−0.08–0.08) Activity – Aggression Between colonies 0.15
(−0.17–0.56) Between individuals 0.35
(0.19–0.51)
Residual −0.04
(−0.18–0.02) Activity –
Meanderness Between colonies −0.83
(−0.95 to
−0.65) Between individuals −0.89
(−0.92 to
−0.82)
Residual −0.6 (−0.68
to −0.56) Activity – Nest displacement Between colonies −0.09
(−0.46–0.32) Exploration – Aggression Between colonies 0.28
(−0.23–0.54) Between individuals 0.35
(0.17–0.49)
Residual 0.027
(−0.04–0.13) Exploration – Meanderness Between colonies −0.76 (−0.9
to −0.58) Between individuals −0.86
(−0.91 to
−0.68)
Residual −0.003
(−0.07–0.96) Exploration – Nest
displacement Between colonies −0.1
(−0.41–0.42) Aggression – Meanderness Between colonies −0.23
(−0.59–0.3) Between individuals −0.27
(−0.49 to
−0.19)
Residual −0.029
(−0.12–0.06) Aggression – Nest
displacement Between colonies −0.01
(−0.33–0.32) Meanderness – Nest
displacement Between colonies 0.24
(−0.39–0.47) Effects strongly supported by the model (95% CI not overlapping) are in bold font.
Downloaded from https://academic.oup.com/beheco/advance-article/doi/10.1093/beheco/araa112/5970335 by 81728827 user on 08 January 2021
Our results did not demonstrate such differences but found that the behavior of Myrmica workers and colonies can differ at three levels of variation (among- and intraindividual variation, and also in residual variation). This suggests that individual ants and colo- nies follow various behavioral strategies, which can be influenced by several environmental and colony characteristics. Heterogeneous residual variance of the activity and exploration shows heteroge- neity in stochasticity (predictability) caused by colony size and nest density. Higher Myrmica nest density results in lower predictability of individual activity but allospecific nest density had an oppo- site effect (foragers had higher predictability in their activity). This can highlight the importance of competition for food and nesting sites which has an enhanced effect on seminatural meadows (see also Lenda et al. 2013; Grześ et al. 2018). Competition is usually considered to have a significant effect in shaping ant communi- ties (Savolainen and Vepsäläinen 1988; Braschler and Baur 2003;
Trigos-Peral et al. 2016), and unavoidably occurs when the eco- logical requirements of species overlap (Pianka 1974; Glen and Dickman 2008). The negative effects of competitive interactions can be reduced if the morphological, behavioral, and ecological plasticity of the competing partners allows shifts in their require- ments, thus minimizing niche overlap, as observed also in ants (see Cerdá et al. 2013 for a review). The overlap of the requirements is stronger in colonies of the same species (Cerdá et al. 2013) that can
lead to a higher variability in the activity of foragers. Higher indi- vidual variation in the activity can be beneficial for foraging success in the places with higher intraspecific competition and may be re- lated to the collective regulation of the foraging response driven by environmental feedback (Gordon et al. 2011).
On the other hand, the neighboring ant colonies belonging to alien species have the opposite effect, and the activity of foragers becomes less variable as they can follow more similar strategies.
This can be because Myrmica species are morphologically and be- haviorally different from the Formicinae species and can have also different foraging strategy and activity period (Savolainen and Vepsäläinen 1988; Czechowski et al. 2012). The higher number of allospecific nests led also to an increased mean colony nest displace- ment efficiency. This behavior was also influenced by the colony size, as nest displacement efficiency was higher in larger colonies (considering the transport of the same amount of larvae). This result confirms our previous findings on Myrmica scabrinodis ants (Maák et al. 2019) that larger colonies can be more efficient due to the speed of discovering new nest sites, which can be linked to the higher number of scouts (Dornhaus and Franks 2006; Maák et al. 2019). Usually, more explorative foragers can acquire impor- tant information about the state of the colony and its environment, for example, the location of food sources (Herbers and Choiniere 1996), also enhancing in this way nest movement efficiency. In our Table 4
Repeatability estimates for the studied behavioral traits altogether for the two habitat types on colony- and on individual-level of M. rubra ants. Repeatability values (R) and 95% CI are shown. Significance (P) estimates are based on randomization tests
Behavioral traits Colony-level
N = 68; R (95% CrI) Individual-level N = 681; R (95% CrI)
Activity 0.2 (0.087–0.315) 0.33 (0.242–0.419)
Aggression 0.13 (0.044–0.223) 0.27 (0.181–0.352) Exploration 0.18 (0.074–0.288) 0.22 (0.142–0.303) Meandering 0.25 (0.117–0.378) 0.28 (0.203–0.371) Nest displacement 0.41 (0.125–0.636)
Effects strongly supported by the model (95% CI not overlapping) are in bold font.
(a) 1500 (b)
1000
Total production Production of new gynes
500
0
400
300
200
100
0
1000 2000 0.8 1.2 1.6 2.0
Mean time of nest displacement (sec) Mean aggression 3000 4000
Figure 2
The effect of the mean nest displacement (A) and aggression (B) on the colony-level production parameters (total production: A, new gynes: B). The black lines are plotted using the formula of linear regression (y ~ x).
Table 5
Mean (colony level) behavioral traits of M. rubra workers affecting the total production and the production of new workers
Fixed effects Total production effect (95% CrI) Worker pupae effect (95% CrI)
Intercept 6.39 (6.16–6.62) 6.31 (6.08–6.53)
Habitat type −0.28 (−0.64–0.07) −0.38 (−0.73 to −0.03)
Mean activity −0.23 (−0.61–0.14) −0.3 (−0.67–0.07)
SD activity 0.24 (−0.03–0.52) 0.29 (0.02–0.56)
Mean meanderness 0.88 (0.07–1.68) 0.93 (0.13–1.72)
SD meanderness −0.95 (−1.68 to −0.22) −1.01 (−1.73 to −0.3)
Mean exploration 0.73 (0.27–1.18) 0.82 (0.37–1.27)
SD exploration −0.2 (−0.42–0.02) −0.18 (−0.4–0.03)
Mean aggression −0.13 (−0.42–0.16) −0.23 (−0.52–0.06)
SD aggression 0.25 (0.06–0.44) 0.24 (0.05–0.42)
Mean nest displacement −0.29 (−0.56 to −0.02) −0.29 (−0.56 to −0.03)
SD nest displacement −0.44 (−0.76 to −0.11) −0.48 (−0.8 to −0.16)
Effects strongly supported by the model (95% CI not overlapping) are in bold font.
Downloaded from https://academic.oup.com/beheco/advance-article/doi/10.1093/beheco/araa112/5970335 by 81728827 user on 08 January 2021
study, colony size affected individual variation on exploration and nest displacement efficiency.
Body size may be the most important factor explaining varia- tion in behavior, life history, and ecology of an organism; therefore, colony size can be an important determinant of collective behavior, colony development, and other traits (see Dornhaus et al. 2012 for a review, Juhász et al. 2020). Larger colony size can cause the evolu- tion of distinct behavior, morphology, or other traits of individuals as a result of differing constraints and selection pressures (Dornhaus et al. 2012). Underpinning this, contrary to the size of the workers that did not have any significant effect on the behavioral trait varia- tion, the colony size had a positive influence on the mean individual aggression and resulted in a lower variability (higher predictability) of exploration. Contrary to our results, no significant effect of the colony size on any studied behavioral traits was found in different Temnothorax species (Modlmeier et al. 2012; Bengston and Dornhaus 2014; Segev et al. 2017), except for the exploration of the environ- ment (Modlmeier et al. 2012). In M. scabrinodis, we also did not find any effect of the colony size on the aggression of workers, although subcolonies with higher young-worker ratio showed higher aggres- sion (Maák et al. 2019). This finding suggests that the defense of the colony can be regarded as a decision-making process based on a quorum, where all the participants perceive the ratio of experi- enced nestmates and adjust their own aggression accordingly (e.g., Hölldobler and Wilson 1990; Gordon 2010). It seems that a similar situation can occur also in larger colonies, where old foragers re- spond to the decrease of their ratio with higher aggression.
Larger colonies also showed a lower residual variability in explo- ration. Besides being more explorative, more predictable individuals were also less meandering, suggesting a straighter path for individ- uals with lower variance in exploration. Exploration is the strongest predictor of colony foraging success and can show consistent between-colony differences (Pasquier and Grüter 2016). Having in mind that larger colonies can have a higher food demand (e.g., Hölldobler and Wilson 1990; Dornhaus et al. 2012), this can lead to higher individual efficiency and sturdiness of workers (Dornhaus et al. 2012). This is underpinned by some findings in red-winged blackbirds (Agelaius phoeniceus), where it was found that the residual variability in the amount of food delivered decreased with food de- mand (older nestlings) and with trips out of the territory (on novel sites situated further) (Westneat et al. 2013). Our results underline
the importance of taking into account not only the dissimilarities of biology and the habitat requirements of different species, but also of different populations (Gordon 2014, 2016), that can result in dif- ferent levels of phenotypic variance (Westneat et al. 2015).
Behavioral syndrome and consistency
All the studied behavioral traits had an individual and/or a colony- specific expression and showed a substantial among-individual/- colony variation in rIIV. This is strengthened further by our findings related to the personality. The personality of individuals involved all the behavioral traits (activity, exploration, aggression, and meanderness), whereas the colony personality involved activity, explo- ration, and meanderness. Such a complex behavioral syndrome was also found for Myrmica ruginodis ants at different levels of organization (Chapman et al. 2011), showing that patrolling individuals were sig- nificantly more active, bolder, and more aggressive than brood carers and foragers. At caste level, a boldness–aggression syndrome was de- scribed in patrollers, whereas a sociability–boldness syndrome was found at colony-level (Chapman et al. 2011). Moreover, colonies also showed strong internal concordance in the mean behavior (Chapman et al. 2011). For M. rubra, it seems that more mobile foragers are also more explorative and aggressive, but their pathway is less meandering.
Chapman et al. (2011) found differences in the behavioral syndrome of Myrmica ants at individual-level in terms of the patroller caste, however, as with our results, they did not find personality levels in for- agers. Our results suggest that these workers fit better with the more general syndrome situated on the “proactive–reactive axis” that has been found in a number of species (Sih, Bell, Johnson 2004; Blight et al. 2016), and is also present at different levels of the colony organi- zation of social insects. Some individuals might be very aggressive and exploratory (proactive), while others could be more shy and cautious (reactive). Similar to solitary animals, proactive colonies are expected to be very active and flourish in stable environments, while reactive ones are better in adapting to changes in the environment (Sih, Bell, Johnson, et al. 2004; Blight et al. 2016). However, we did not find any difference in behavioral syndrome between ants from the two studied habitats that might be related to the characteristics of the behavioral traits that we chose for our study. This behavioral syndrome is showing lower plasticity probably because of its higher importance for individ- uals of the forager caste in every habitat, as their role is to explore the Table 6
Individual behavioral traits of M. rubra workers affecting the production parameters
Behavioral traits Total production effect (95% CrI) New queens effect (95% CrI) New workers effect (95% CrI) Seminatural meadows
Intercept 6.45 (6.37–6.53) 2.5 (1.77–3.23) 6.34 (6.26–6.42)
Activity −0.003 (−0.1–0.09) 0.37 (−0.16–0.89) −0.02 (−0.21–0.03)
Meanderness −0.12 (−0.21 to −0.03) −4.67 (−8.04 to −1.3) −0.12 (−0.21–0.03)
Exploration 0.13 (0.04–0.22) 0.32 (−0.13–0.77) 0.13 (0.04–0.22)
Aggression 0.17 (0.08–0.26) 0.38 (0.008–0.75) 0.15 (0.07–0.23)
Invaded meadows
Intercept 6.37 (6.29–6.45) 4.25 (2.22–6.28) 6.52 (6.44–6.6)
Activity 0.18 (0.08–0.28) 0.2 (−2.5–2.9) 0.25 (0.15–0.34)
Meanderness −0.07 (−0.16–0.022) −0.29 (−1.91–1.34) −0.08 (−0.18–0.02)
Exploration 0.14 (0.05–0.23) 0.07 (−2.32–2.46) 0.17 (0.06–0.26)
Aggression 0.009 (−0.08–0.095) 0.2 (−2.07–2.47) −0.04 (−0.13–0.05)
Effects strongly supported by the model (95% CI not overlapping) are in bold font.
Downloaded from https://academic.oup.com/beheco/advance-article/doi/10.1093/beheco/araa112/5970335 by 81728827 user on 08 January 2021