*For correspondence:
cpal@brc.hu
†These authors contributed equally to this work Present address:‡Faculty of Biology, Technion – Israel Institute of Technology, Haifa, Israel;§Department of Biology, Stanford University, Stanford, United States
Competing interests:The authors declare that no competing interests exist.
Funding:See page 17 Received:22 March 2019 Accepted:05 August 2019 Published:16 August 2019 Reviewing editor: Christian R Landry, Universite´ Laval, Canada
Copyright Dunai et al. This article is distributed under the terms of theCreative Commons Attribution License,which permits unrestricted use and redistribution provided that the original author and source are credited.
Rapid decline of bacterial drug-resistance in an antibiotic-free environment through phenotypic reversion
Anett Dunai1,2†, Re´ka Spohn1†, Zolta´n Farkas1†, Vikto´ria La´za´r1‡, A´da´m Gyo¨rkei1, Ga´bor Apjok1,2, Ga´bor Boross1§, Bala´zs Szappanos1, Ga´bor Gre´zal1,
Aniko´ Farago´2,3, La´szlo´ Bodai3, Bala´zs Papp1, Csaba Pa´l1*
1Synthetic and Systems Biology Unit, Institute of Biochemistry, Biological Research Centre, Hungarian Academy of Sciences, Szeged, Hungary;2Doctoral School in Biology, Faculty of Science and Informatics, University of Szeged, Szeged, Hungary;
3Department of Biochemistry and Molecular Biology, University of Szeged, Szeged, Hungary
Abstract
Antibiotic resistance typically induces a fitness cost that shapes the fate of antibiotic- resistant bacterial populations. However, the cost of resistance can be mitigated by compensatory mutations elsewhere in the genome, and therefore the loss of resistance may proceed too slowly to be of practical importance. We present our study on the efficacy and phenotypic impact ofcompensatory evolution inEscherichia colistrains carrying multiple resistance mutations. We have demonstrated that drug-resistance frequently declines within 480 generations during exposure to an antibiotic-free environment. The extent of resistance loss was found to be generally antibiotic- specific, driven by mutations that reduce both resistance level and fitness costs of antibiotic- resistance mutations. We conclude that phenotypic reversion to the antibiotic-sensitive state can be mediated by the acquisition of additional mutations, while maintaining the original resistance mutations. Our study indicates that restricting antimicrobial usage could be a useful policy, but for certain antibiotics only.
DOI: https://doi.org/10.7554/eLife.47088.001
Introduction
Steady antibiotic overuse has led to the rise and spread of multidrug-resistant bacteria, and can potentially reduce the number of therapeutic options against several dangerous human pathogens.
Resistance seriously impacts the effectiveness of treatment, and increases the risk of complications and fatal outcome (Mensah Abrampah et al., 2018). Strict policies that aim to restrict antimicrobial usage in clinical settings may offer a solution to this problem (Guay, 2008). Such strategies implicitly presume that resistance leads to reduced bacterial fitness in an antibiotic-free environment, and therefore these resistant populations should be rapidly outcompeted by antibiotic-sensitive variants.
In theory, the extent of fitness costs determines the long-term stability of resistance, and conse- quently, the rate by which the frequency of resistant bacteria decreases in an antibiotic-free environ- ment. Resistance mutations frequently incur fitness costs in the laboratory (Andersson and Levin, 1999;Levin et al., 1997), as such mutations impair essential cellular processes, such as transcription, translation, or cell-wall biogenesis. There is a negative correlation between measured fitness costs and prevalence in clinical settings (Basra et al., 2018;Praski Alzrigat et al., 2017;Trindade et al., 2009). This would suggest that fitness costs shape the propagation of antibiotic resistant bacteria in the clinics. However, in other cases, such deleterious side effects of resistance mutations are
undetectable, and resistance can even confer benefits in specific, antibiotic-free environmental set- tings (Maharjan and Ferenci, 2017).
It is frequently assumed that such compensatory mutations mitigate the fitness costs of resistance mutations without affecting the level of resistance. As the range of targets for compensation is much broader, compensatory mutations are more likely than the reversion of resistance mutations. If com- pensatory mutations are indeed widespread, pathogens can reach both high level of resistance and high fitness. For these reasons, reversion to the original antibiotic-sensitive state under prudent anti- biotic use may proceed so slowly that it will have no practical importance in the clinic (Ander- sson, 2006;Andersson and Hughes, 2010;Nicoloff et al., 2019;Schrag et al., 1997).
Several prior laboratory studies support the argument above. It has been reported that antibiotic resistance is stably maintained as a result of compensatory mutations (Bjo¨rkman et al., 1999;
Johanson et al., 1996; Marcusson et al., 2009), however, instances of compensatory mutations have not been generalized to clinical settings. Several published clinical studies indicate that limited antibiotic use can cause rapid changes in the frequency of resistance. In certain cases, resistance tends to decline both in individual patients and at the community level following restricted antibiotic use (Butler et al., 2007;Dagan et al., 2008;Gottesman et al., 2009;Kristinsson, 1997). For exam- ple, the frequency of erythromycin-resistantStreptococcus pyogenessteadily declined as a result of reduced use of macrolides in Finnish hospitals (Seppa¨la¨ et al., 1997). By contrast, months of reduc- tion of sulfamethoxazole clinical treatment in the United Kingdom failed to reach reduced resistance levels (Enne et al., 2001).
This disagreement between clinical observations and laboratory studies could have multiple rea- sons. First, antibiotic treatments frequently fail to completely eradicate antibiotic-sensitive bacteria from the population. Following treatment, antibiotic sensitive bacteria with high fitness could rapidly spread in the population, leading to rapid loss of resistance. Second, compensatory evolution may be limited in nature and in clinical settings (Brandis et al., 2012; Hall and MacLean, 2011;
Vogwill and MacLean, 2015). Indeed, most laboratory studies focused on resistance to a single drug (Brandis et al., 2012;Maisnier-Patin et al., 2002;Qi et al., 2016), thus compensatory evolu- tion in multidrug-resistant bacteria has remained largely unexplored (Vogwill and MacLean, 2015;
but seeMoura de Sousa et al., 2017). This latter shortcoming is especially noteworthy, because sev- eral multidrug-resistant bacteria are difficult to treat with current antibiotic treatment, and therefore the issue of compensatory evolution is especially relevant. Indeed, there is an urgent need to under- stand the mechanisms that mitigate the costs of multiple – potentially epistatically interacting – mutations in multidrug-resistant pathogens (Trindade et al., 2009;Wong, 2017), which clearly can- not be achieved in studies focusing on single mutants only.
In this work, we have studied 23 drug-resistant E. coli strains that carry 2 to 13 mutations (La´za´r et al., 2014). We have found that 60 days of laboratory evolution under antibiotic-free condi- tions has led to a rapid decline of resistance to certain, but not all antibiotics. This decline in resis- tance has not resulted from strict reversion mutations that recapitulate wild-type bacteria at the molecular level. Rather, the mutated genes are functionally related, but not identical to those confer- ring antibiotic resistance. Notably, these mutations perturb membrane-permeability and the activity of regulons involved in defense against drugs and related stresses. They partially restore wild-type fitness in the antibiotic-free medium, and also reduce the level of antibiotic-resistance, at least against certain antibiotics. These considerations could help to identify antibiotics where restricting antimicrobial usage could be a useful policy.
Results
Evolution of resistance and fitness cost
In a previous work we had performed adaptive laboratory evolution under gradually increasing anti- biotic dosages (La´za´r et al., 2014). Parallel evolving populations of E. coli K-12 BW25113 were exposed to 1 of 12 antibiotics (Table 1). Adapting populations were found to display an up to 328- fold increment in their minimum inhibitory concentrations (MICs) relative to the wild-type strain. To elucidate the underlying molecular mechanisms of resistance, 60 antibiotic-resistant strains (one clone per each population) were previously isolated and subjected to whole genome sequencing
analysis. The resistance mutations identified generally affected the drug targets, efflux pumps, por- ins and proteins involved in cell envelope biogenesis.
In the current study, we estimated fitness by measuring individual fitness of each of the 60 antibi- otic-resistant strains and the corresponding wild-type strain in an antibiotic-free medium (Figure 1—
figure supplement 1). In total, 38% of the antibiotic-resistant strains (N = 23) showed significantly reduced growth compared to the ancestral wild-type strain (Figure 1—source data 1. Fitness cost varied substantially across antibiotics (Figure 1). Most notably, laboratory-adapted aminoglycoside- resistant strains displayed especially low fitness in the antibiotic-free medium, but the reasons are unclear. However, we note that akin to clinically observed small-colony variants, the major targets of selection under aminoglycoside stress were the translational machinery and a broad class of genes that shape the electrochemical potential of the outer membrane (La´za´r et al., 2013;
Vestergaard et al., 2016).
In agreement with prior studies (Marcusson et al., 2009; Melnyk et al., 2015; Merker et al., 2018), strains with especially low fitness values in the antibiotic-free medium were found to carry more resistance mutations (Spearman’s correlation, r = –0.7488; p<0.0001; N = 23) and display especially high levels of resistance (Spearman’s correlation,r= –0.658; p=0.0006; N = 23).
Laboratory evolution of antibiotic-resistant strains in an antibiotic-free medium
To investigate potential changes in resistance phenotypes upon evolution in an antibiotic-free envi- ronment, we initiated parallel laboratory evolutionary experiments with 23 out of the 60 antibiotic- resistant strains (1 to 4 strains per antibiotic, see Materials and methods). All these strains exhibited significant fitness costs in antibiotic-free environment. Six parallel populations per antibiotic-resistant strain were cultivated in a standard, antibiotic free-medium, resulting in 138 independently evolving populations. The populations were propagated for 60 transfers (approximately 480 generations) by diluting 1% of the saturated cultures into fresh medium every 24 hr. From each evolved population, we selected a single, representative clone for further analysis (see Materials and methods). Through- out the paper, T0 and T60 refer to the 23 antibiotic-resistant strains and the corresponding 138 evolved lines from the final day of the antibiotic-free evolutionary experiment, respectively.
Table 1.Antibiotics employed and their modes of actions.
Functional classification (molecular target) is based on previous studies (Girgis et al., 2009; Yeh et al., 2006). These antibiotics are widely used in clinical practice, are well-characterized and cover a wide range of modes of actions. For three-letter codes (abbrevia- tions), the AAC’s standard (https://aac.asm.org/content/abbreviations-and-conventions) was used.
Antibiotic name Abbreviation Antibiotic class Molecular target Effect
Number of T0 lines displaying significant fitness cost
Ampicillin AMP Penicillin Cell wall Bactericidal 1
Cefoxitin FOX Cephalosporins Cell wall Bactericidal 1
Ciprofloxacin CIP Quinolones Gyrase Bactericidal 2
Nalidixic acid NAL Quinolones Gyrase Bactericidal 0
Nitrofurantoin NIT Nitrofurantoin Multiple mechanisms Bactericidal 2
Kanamycin KAN Aminoglycosides Protein synthesis, 30S Bactericidal 4
Tobramycin TOB Aminoglycosides Protein synthesis, 30S Bactericidal 4
Tetracycline TET Tetra-cyclines Protein synthesis, 30S Bacteriostatic 2
Doxycycline DOX Tetra-cyclines Protein synthesis, 30S Bacteriostatic 1
Chloramphenicol CHL Chloramphenicol Protein synthesis, 50S Bacteriostatic 2
Erythromycin ERY Macrolides Protein synthesis, 50S Bacteriostatic 0
Trimethoprim TMP Trimethropim Folic acid biosynthesis Bacteriostatic 4
DOI: https://doi.org/10.7554/eLife.47088.002
As in our previous work, the fitness of each of the 23 T0 strains and the 138 T60 lines was mea- sured by estimating the area under the growth curve recorded in the same liquid antibiotic-free medium. 51% of the T60 lines were found to exhibit significantly improved fitness, and some of these lines even approximated wild-type fitness (Figure 2—source data 1). The analysis has revealed
0%
10%
20%
30%
40%
50%
CHL DOX ERY FOX NAL NIT TET AMP CIP TMP KAN TOB
$QWLELRWLFíUHVLVWDQW7VWUDLQV
)LWQHVVFRVW
Figure 1.Fitness cost of antibiotic-resistant T0 strains. The fitness of each strain was measured as the area under the bacterial growth curve recorded in an antibiotic-free medium. Fitness cost was calculated from the absolute fitness of T0 and wild-type strains using the following equation: 1-WT0/Wwild- type, where WT0and Wwild-typeindicate fitness of the T0 and wild-type strains, respectively. Strains adapted to two aminoglycosides – kanamycin (KAN) and tobramycin (TOB) – generally exhibit an especially high fitness cost, while adaptation to erythromycin (ERY) and nalidixic acid (NAL) evoked no measurable fitness cost. For all further analyses only the T0 strains exhibiting a significant fitness cost were used. For antibiotic abbreviations, see Table 1. Boxplots show the median, first and third quartiles, with whiskers showing the 5th and 95th percentiles of the fitness cost per antibiotic.
Individual data points represent the median of three biological replicates (five technical measurements) for each of the 60 antibiotic-resistant strains (4–
6 strain per antibiotic). Source file is available asFigure 1—source data 1.
DOI: https://doi.org/10.7554/eLife.47088.003
The following source data and figure supplement are available for figure 1:
Source data 1.Initial fitness cost of the T0 antibiotic-resistant strains.
DOI: https://doi.org/10.7554/eLife.47088.005
Figure supplement 1.Schematic outline of the evolutionary experiments.
DOI: https://doi.org/10.7554/eLife.47088.004
major differences in relative fitness across strains adapted to different antibiotics (Figure 2), indicat- ing that adaptation is mainly driven by the set of resistance mutations present in the T0 strains.
Rapid loss of drug resistance in an antibiotic-free medium
Next, we investigated how laboratory evolution in an antibiotic-free medium shapes antibiotic resis- tance. For this purpose, we first measured the minimum inhibitory concentrations (MIC) in 71 T60 lines showing significant fitness improvement, as well as in the corresponding 20 T0 strains, against a set of 11 antibiotics (seeTable 1 and Materials and methods). Using the CLSI resistance break-
0.8 0.9 1.0 1.1 1.2 1.3 1.4 1.5 1.6 1.7 1.8
CHL AMP NIT TMP TOB KAN FOX DOX CIP TET
T60 evolved lines
Relati v e fitness
Figure 2.Relative fitness of the T60 evolved lines. The figure shows the relative fitness of 6 parallel lines of 23 antibiotic-adapted strains (T0) after laboratory evolution in an antibiotic-free medium. Relative fitness was calculated by normalizing the T60 fitness to the fitness of the corresponding T0 antibiotic-resistant strain. Fitness was measured as the area under the growth curve in an antibiotic-free medium. Relative fitness varied significantly across populations initially resistant to different antibiotics (N = 138, p<0.0001, Kruskal–Wallis test). For antibiotic abbreviations, seeTable 1. Boxplots show the median, first and third quartiles, with whiskers showing the 5th and 95th percentiles of the relative fitness of all T60 evolved lines originally adapted to different antibiotics. Individual data points represent the median relative fitness of each of the 138 T60 evolved lines (3 biological and five technical replicates per each). Source file is available asFigure 2—source data 1.
DOI: https://doi.org/10.7554/eLife.47088.006 The following source data is available for figure 2:
Source data 1.Fitness improvement reached following 60 day evolution in an antibiotic free environment.
DOI: https://doi.org/10.7554/eLife.47088.007
point cut-offs (CLSI Approved Standard M100, 29th Edition), we categorized each strain as being resistant (R), intermediate (IM) or susceptible (S) to each investigated antibiotic. As expected, the T0 strains generally displayed reduced susceptibility to multiple antibiotics (MIC > R or MIC > IM, see Figure 3—source data 1). Based on this categorization, we next examined whether resistance to these antibiotics was maintained or reduced during the laboratory evolution in the antibiotic-free medium. For this purpose, we compared the resistance levels of the 71 T60 lines that displayed sig- nificant fitness improvement in the antibiotic-free environment to that of the corresponding T0 strains. We focused on antibiotics to which the corresponding T0 strain exhibited resistance, leading to a total of 195 antibiotic-T60 line combinations.
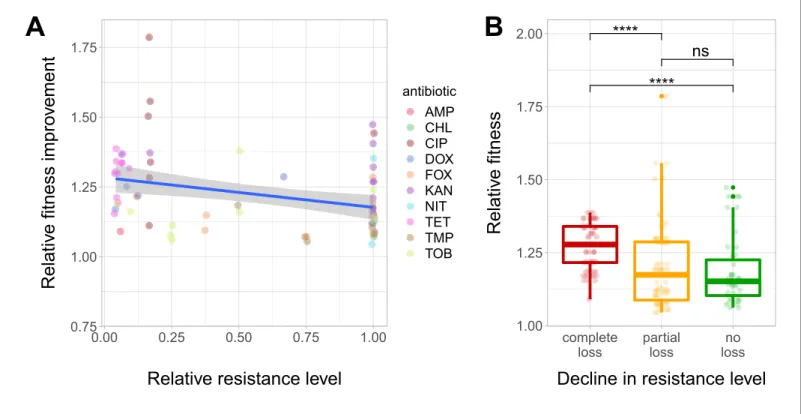
We have found that resistance declined in as high as 54.8% of the antibiotic-T60 line combina- tions following evolution under antibiotic stress-free conditions (Figure 3A and B,Figure 3—source data 1). However, the extent of resistance decline depended on the antibiotic considered. For example, doxycycline and tetracycline resistance was frequently lost, while aminoglycoside resis- tance was generally maintained in the T60 lines (Figure 3C and D). Overall, 64.7% of the T60 lines displayed significant decline in resistance to at least one antibiotic, and many displayed loss of resis- tance to multiple drugs (Figure 3C and D,Figure 3—source data 1). We found a significant nega- tive correlation between relative fitness and resistance level of T60 lines (Spearman’s correlation test, r = 0.35, p=0.0031). This indicates that fitness compensation was partly associated with a decline in the original antibiotic resistance level (Figure 4A and B, see alsoFigure 4—figure supple- ment 1,Figure 4—source data 1). In summary, approximately 480 generations of evolution in an antibiotic-free medium had a considerable impact on the levels of resistance to multiple antibiotics.
Phenotypic reversion via compensatory mutations dominates
To gain insights into the underlying molecular mechanisms of resistance loss, 15 independently evolved T60 strains displaying increased fitness were subjected to whole-genome sequencing (see Materials and methods for selection criteria). Using the Illumina platform and established bioinfor- matics protocols (see Materials and methods), we aimed to identify mutations relative to the genome of the corresponding T0 strains. Altogether, 43 independent mutational events were identi- fied, including 16 single nucleotide polymorphisms (SNPs), 16 deletions and 13 insertions (Supplementary file 1). We screened the full bacterial genome to identify resistance-conferring SNPs in the T0 population that revert back to the wild-type sequence in the corresponding T60 strains, but found no such cases. Therefore, the fitness gain in the T60 strains is not due to the molecular reversion of the antibiotic-resistance mutations (Dura˜o et al., 2018). Rather, compensa- tory mutations elsewhere in the genome contribute to the rapid fitness improvement in the evolved strains. A rigorous statistical analysis to test functional relationship between the mutations detected in T0 and T60 was not feasible due to the low number of mutations that have accumulated during the course of laboratory evolution. Nevertheless, we noted several examples on functional related- ness between resistance genes mutated in T0 and genes mutated during lab evolution (i.e. found in T60 strains only,Figure 5—figure supplement 1,Figure 5—source data 1).
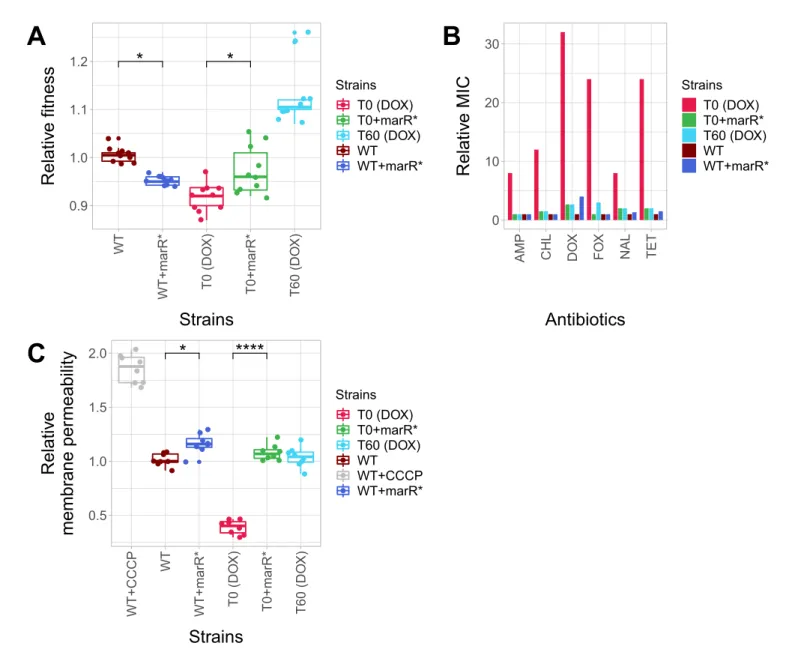
Pleiotropic side effects of a compensatory mutation in marR
Do compensatory mutations simultaneously shape fitness in antibiotic free medium and antibiotic resistance level? To investigate this issue, we have conducted a genetic analysis to explore the potential fitness costs of compensatory mutations. In particular, we studied the impact of selected mutations on growth rate and antibiotic resistance in multiple genetic backgrounds. Several putative compensatory mutations were found to be accumulated in functionally-related transcriptional regula- tory proteins involved in anti-drug defense (Supplementary file 1). In particular, some of, these pro- teins control efflux pumps (marR,Alekshun and Levy, 1999;Duval et al., 2013;Ferenci and Phan, 2015;Seoane and Levy, 1995), lipopolysaccharide biosynthesis (Seo et al., 2015), and outer mem- brane diffusion pores in response to changes in medium osmolarity (envZ/ompR, (Knopp and Andersson, 2015;Phan and Ferenci, 2013).
Here we first focused on a promoter mutation of themarRbelonging to the mar regulon (marR*), not least because this specific gene has clinical relevance: mutations inmarRhave been reported to cause multidrug resistance in clinicalE. coliisolates in several prior studies (Komp Lindgren et al., 2003; Mazzariol et al., 2000). This mutation was found in a T60 strain, indicating that it had
accumulated during adaptation to the antibiotic-free environment. This specific mutation (marR*) was inserted individually into wild-typeE. coli and the corresponding antibiotic-resistant T0 strain.
First we measured the growth rates of the wild-type and the antibiotic-resistant T0 strain with and without marR*. In the absence of antibiotic, the phenotypic effects of this mutation depended on
1 10 100 1000
1 10 100 1000
Resistance level at T0 (µg/ml)
Resistance level at T60 (µg/ml)
antibiotic AMP CHL CIP
DOX FOX KAN
NAL NIT TET
TMP
A
TOBB
0 10 20 30 40
NIT KAN TOB TMP FOX AMP NAL CIP CHL TET DOX
Antibiotics
Number of cases
resistance lost maintained
C
100.0%
90.5%
9.5%
82.4%
17.6%
55.6%
44.4%
46.2%
53.8%
41.2%
58.8%
39.1%
60.9%
33.3%
66.7%
27.8%
72.2%
15.8%
84.2%
5.3%
94.7%
0.00 0.25 0.50 0.75 1.00
NIT KAN TOB TMP FOX AMP NAL CIP CHL TET DOX
Antibiotics
Ratio of resistance change
resistance lost maintained
D
R
IM S
75
19
13
62 26
Figure 3.
Figure 3.Impact of compensatory evolution on antibiotic resistance level. (A) The figure depicts minimum inhibitory concentrations (log10-scale) of T0 and the corresponding T60 strains. Each of the 195 points represents an antibiotic-strain combination; the colors denote different antibiotics. Points below the black line (x = y) indicates cases with a decrease in antibiotic resistance level after compensatory evolution. For antibiotic abbreviations, see Table 1. Source file is available asFigure 3—source data 1. (B) The figure depicts qualitative changes in resistance level across 195 tested antibiotic- T60 line combinations. Using the CLSI resistance break-point cut-offs, we categorized each T60 and the corresponding T0 strains as being resistant (R), intermediate (IM) or susceptible (S) to each investigated antibiotic. Arrows indicate whether the resistance level was maintained (e.g. R->R) or reduced (e.g. R->S) during the course of laboratory evolution in the antibiotic-free medium. The numbers of antibiotic-T60 line combinations in each category are indicated on the arrows. Source file is available asFigure 3—source data 1. (C and D) The figures show the number of T60 lines with resistance maintained/lost to the range of antibiotics tested, as absolute number (3C) versus ratio (3D), respectively. Doxycycline (DOX) and tetracycline (TET) resistance was frequently lost (Fisher’s Exact test: odds ratio = 0.05, p<0.001 for DOX and odds ratio = 0.20, p<0.01 for TET), while aminoglycoside (kanamycin - KAN, tetracycline - TET) resistance was generally maintained in the T60 lines (Fisher’s Exact test: odds ratio = 14.29, p<0.001 for KAN, odds ratio = 6.5, p<0.01 for TOB). For antibiotic abbreviations, seeTable 1. Source file is available asFigure 3—source data 1.
DOI: https://doi.org/10.7554/eLife.47088.008 The following source data is available for figure 3:
Source data 1.Changes of cross-resistance interactions following 60 day evolution in an antibiotic free environment.
DOI: https://doi.org/10.7554/eLife.47088.009
the genetic background: it increased growth rate by 4.4% in the corresponding T0 strain, but reduced wild-type fitness (Figure 5A,Figure 5—source data 1). This epistatic effect suggests that marR*reduces the deleterious side effects of antibiotic-resistance mutations, while it has a fitness cost in the wild-type strain (Knopp and Andersson, 2015;Praski Alzrigat et al., 2017). Next, we studied the impact of themarR*compensatory mutation on resistance level using standard E-test assays. The corresponding T0 strain was found to display detectable resistance to multiple antibiot- ics, including doxycycline, ampicillin, chloramphenicol, nalidixic acid and tetracycline, while the corre- sponding T60 strain lost resistance to all studied antibiotics. This can mainly result from the presence ofmarR*in the T60 genome, as the introduction ofmarR*to the T0 strain recapitulated the same 0.75
1.00 1.25 1.50 1.75
0.00 0.25 0.50 0.75 1.00
Relative resistance level
Relati v e fitness impro v ement
antibioticAMP CHL CIP DOX FOX KAN NIT TET TMP TOB
A ****
****
ns
1.00 1.25 1.50 1.75 2.00
complete loss
partial loss
no loss
Decline in resistance level
Relati v e fitness
B
Figure 4.Fitness recovery and resistance loss after compensatory evolution. (A) The scatterplot shows the relative resistance level and relative fitness improvement of individual T60 strains compared to the corresponding T0 strains (each data point is one strain, the colors indicate the antibiotic used in the analysis). Relative resistance was estimated by the minimum inhibitory concentration of the T60 line relative to that of the T0 line. There is a significant negative correlation between relative fitness improvement and relative resistance level (Spearman’s correlation test,r= 0.35, p=0.0031).
Blue line with gray shaded area represents linear regression line with 95% confidence interval. For antibiotic abbreviations, seeTable 1. Source file is available asFigure 4—source data 1. (B) Resistance loss as a function of relative fitness in antibiotic-free environment. The T60 strains were classified into three main categories based on their resistance-profiles: the resistance level declined against all tested antibiotics (complete), declined towards at least one antibiotic (partial), or the resistance level was maintained (no). Using the CLSI resistance break-point cut-offs (CLSI Approved Standard M100, 29th Edition), we categorized each T60 and the corresponding T0 strains as being resistant (R), intermediate (IM) or susceptible (S) to each investigated antibiotic. A decline in resistance was defined by transitions R->IM, R->S or IM->S. We observed a significant association between the relative fitness in the antibiotic-free medium and the decline in resistance level (Mann-WhitneyU-test: **** indicates p<0.0001, ns indicates that thepvalue is non- significant). Boxplots show the median, first and third quartiles, with whiskers showing the 5th and 95th percentiles. Source file is available as Figure 4—source data 1.
DOI: https://doi.org/10.7554/eLife.47088.010
The following source data and figure supplement are available for figure 4:
Source data 1.Fitness recovery and resistance loss after compensatory evolution.
DOI: https://doi.org/10.7554/eLife.47088.012
Figure supplement 1.Fitness and resistance changes during laboratory evolution.
DOI: https://doi.org/10.7554/eLife.47088.011
* *
0.9 1.0 1.1 1.2
WT WT+marR* T0 (DOX) T0+marR* T60 (DOX)
Strains
Relati v e fitness
Strains T0 (DOX) T0+marR*
T60 (DOX) WT WT+marR*
A
0 10 20 30
AMP CHL DOX FOX NAL TET
Antibiotics
Relati v e MIC
Strains T0 (DOX) T0+marR*
T60 (DOX) WT WT+marR*
B
* ****
0.5 1.0 1.5 2.0
WT+CCCP WT WT+marR* T0 (DOX) T0+marR* T60 (DOX)
Strains Relati v e memb rane pe rmeability
Strains T0 (DOX) T0+marR*
T60 (DOX) WT WT+CCCP WT+marR*
C
Figure 5.Phenotypic effects of a compensatory mutation in themarRpromoter region. The figure shows the (A) relative fitness, (B) relative resistance level and (C) Relative Hoechst probe accumulation (a proxy of membrane permeability) in the doxycycline-resistant T0 and the corresponding T60 strain harboring a compensatory mutation in themarRpromoter region (marR*). Additionally,marR*was introduced into the wild-type and T0 genetic backgrounds as well, yielding WT + marR* and T0 + marR* strains, respectively. (A) Fitness was measured as the area under the growth curve in an antibiotic-free medium, and was normalized to wild-type fitness. Boxplots show the median, first and third quartiles, with whiskers showing the 5th and 95th percentiles (2 biological and five technical replicates per each genotype). We observed a significant variation in relative fitness across the strains (Tukey’s post-hoc multiple comparison tests, * indicates p<0.05). Source file is available asFigure 5—source data 1. (B) Resistance level of all five strains against six antibiotics. Minimum inhibitory concentration (MIC) was measured by the standard E-test assay, and was normalized to that of the wild-type strain. Only the T0 strain can be considered resistant to each antibiotic tested according to the CLSI resistance break-point cut-off. Source file is available asFigure 5—source data 1. (C) Membrane permeability across five strains. Membrane permeability was estimated by measuring the intracellular accumulation of a fluorescent probe (Hoechst 33342) in eight biological replicates per each strain or condition. Intracellular accumulation of the probe in the corresponding strains was normalized to that of the wild-type strain. Wild-type cells treated with a protonophore chemical agent (carbonyl cyanide m-chlorophenyl hydrazone, CCCP) served as a positive control, displaying an 88% larger membrane permeability value compared to that of the non-treated wild-type strain. T0 showed an exceptionally low level of Hoechst-dye accumulation compared to all other strains studied, while T0 + marR* displayed a 166% larger membrane permeability value compared to that of the T0 strain (Tukey’s post-hoc multiple comparison tests: ****
indicates p<0.0001). Boxplots show the median, first and third quartiles, with whiskers showing the 5th and 95th percentiles. Source file is available as Figure 5—source data 1.
DOI: https://doi.org/10.7554/eLife.47088.013 Figure 5 continued on next page
pattern: the engineered strain lost resistance (Figure 5B). Finally, we hypothesized that marR*
shapes resistance and cellular fitness through antagonistic effects on drug uptake. This hypothesis was tested by measuring the intracellular accumulation of a fluorescent probe (Hoechst 33342) as a proxy for membrane permeability in the resistant T0 strain, in the T60 line and in the wild-type strain with and without themarR*compensatory mutation. Decreased intracellular level of the probe indi- cates either decreased porin activity or enhanced efflux-pump activity (Coldham et al., 2010). This is exactly what we found in the resistant T0 strains compared to the wild-type. Importantly, marR*
restored membrane permeability of T0 to the wild-type level (Figure 5C).
In summary, a compensatory mutation in the promoter region ofmarR*increased bacterial fitness in a specific, antibiotic-resistant genotype only. As a side effect, the same mutation increased bacte- rial susceptibility to multiple antibiotics, probably through elevating membrane permeability. Similar patterns held for a compensatory mutation inenvZ, a central regulatory protein involved in osmoreg- ulation (Figure 5—figure supplement 2A and B,Figure 5—source data 1).
Discussion
It is an open issue whether restricting antimicrobial usage would contribute to the elimination of mul- tidrug-resistant bacteria. Although resistance mutations frequently have associated fitness costs, such costs may decline subsequently through the accumulation of compensatory mutations. It has been argued that such compensatory mutations mitigate the fitness costs of resistance mutations without affecting the level of resistance (Andersson and Hughes, 2010), suggesting that limiting antibiotic usage may not have much practical utility in clinical settings. However, most prior labora- tory studies focused on bacteria carrying a single resistance mutation, whereas antibiotic-resistant clinical isolates usually carry multiple resistance mutations (Vogwill and MacLean, 2015). This issue is all the more relevant, as epistasis is prevalent between antibiotic-resistance mutations (Wong, 2017).
A specific case of compensation ismolecular reversion. In this case, the mutation responsible for molecular reversion restores the wild-type, antibiotic-susceptible genetic sequence, and thereby eliminates the fitness costs associated with the resistance mutation. However, molecular reversion is assumed to be generally rare, as it requires very specific and mutational events (Andersson and Hughes, 2010;Dura˜o et al., 2018). On the other hand, case studies indicate thatphenotypic rever- sioncan also occur, when the original resistance mutation is maintained, but acquisition of additional mutations simultaneously reduces fitness costs and increases antibiotic-susceptibility. For example, streptomycin-resistance is frequently mediated by resistance mutations in the ribosomal protein gene rpsL, but compensatory mutations in other genes involved in translation yield reversion to streptomycin-sensitivity (Moura de Sousa et al., 2017). As the molecular targets for phenotypic reversion are relatively broad, reversion to the antibiotic-susceptible state may be far more likely than previously appreciated.
To test the theory of phenotypic reversion, we studied laboratory evolved drug-resistantE. coli strains carrying 2 to 13 mutations and initially displaying reduced fitness compared to the wild-type strain. We found that 60 days of laboratory evolution in an antibiotic-free environment led to a rapid fitness improvement in 51% of the antibiotic-resistant lineages (some of which approximated wild- type fitness).
Figure 5 continued
The following source data and figure supplements are available for figure 5:
Source data 1.Relative fitness, relative MIC and relative Hoechst-dye accumulation of reconstructed mutant strains.
DOI: https://doi.org/10.7554/eLife.47088.016
Figure supplement 1.Functional relationship of resistance-conferring and compensatory mutations in representative evolved lines.
DOI: https://doi.org/10.7554/eLife.47088.014
Figure supplement 2.Effect of a compensatory mutation inenvZ.
DOI: https://doi.org/10.7554/eLife.47088.015
Fitness may increase during the course of laboratory evolution as a result of general adaptation to the environment and/or accumulation of compensatory mutations that mitigate the deleterious side effects of resistance. The second option is more realistic, as several mutations that had accumu- lated during laboratory evolution affected genes involved in bacterial defense mechanisms against antibiotics or in general stress-responses (eg. rpoS promoter region/nlpD gene (Stoebel et al., 2009),potD(Shah et al., 2011),soxSR(Jain and Saini, 2016) (Supplementary file 1). An in-depth genetic analysis has also demonstrated epistatic interactions between resistance- and putative com- pensatory mutations inmarRandenvZ.These mutations had accumulated during laboratory evolu- tion and increased fitness in the respective antibiotic-resistant strain, but reduced fitness in the wild- type (Figure 5AandFigure 5—figure supplement 2A,Figure 5—source data 1). This latter finding also suggests that compensatory mutations themselves have associated fitness costs, preventing antibiotic-resistant bacteria to reach the full fitness of sensitive variants.
Crucially, we have demonstrated that drug-resistance declines in an antibiotic-free laboratory environment. In as few as 480 generations, 64.7% of drug-resistantE. colistrains showed elevated susceptibilities to at least one antibiotic investigated (Figure 3—source data 1). We did not observe bona fidereversion mutations in laboratory evolved bacteria (Dura˜o et al., 2018). This is not unex- pected, as compensation via the accumulation of additional mutations elsewhere in the genome is far more likely to occur.
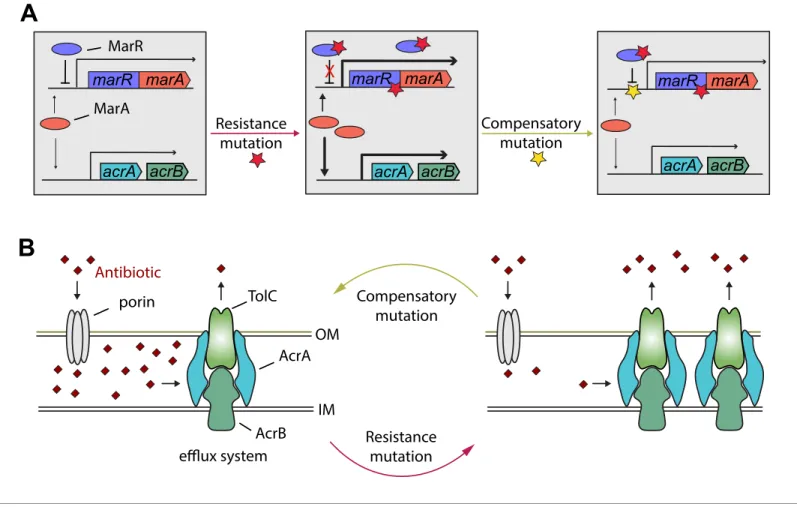
Detailed genetic analysis of themarregulon also supports the phenotypic reversion hypothesis.
MarR is a transcriptional regulatory protein that controls the activity of the mar regulon inE. coli through the repression ofmarA. Themarregulon participates in controlling several genes involved in antibiotic-resistance, including the AcrA/AcrB/TolC multidrug-efflux system (Figure 6). In response to antibiotic stresses (e.g. doxycycline or ciprofloxacin), marR is regularly mutated both in clinical and in laboratory settings, leading to increased expression ofmarAand other members of themar regulon (Praski Alzrigat et al., 2017). Here we have focused on a multidrug-resistant laboratory evolvedE. colistrain that carries a mutation in the protein coding sequence ofmarR. This resistance mutation has an associated fitness cost (Figure 5—source data 1), promoting the accumulation of further mutations. Our study indicates that this can be achieved by a compensatory mutation in the promoter region of themaroperon. This compensatory mutation increases bacterial fitness, suscep- tibility to multiple antibiotics alike, and restores wild-type-like membrane permeability, probably through changing the activity of themarregulon. In a follow-up work we are planning to study this phenomenon in detail.
It is important to emphasize that loss of antibiotic resistance is not equally likely across antibiotic- resistant strains. For example, in our study, resistance to doxycycline and tetracycline was frequently lost, while aminoglycoside-resistance was generally maintained during the course of laboratory evo- lution (Figure 3C and D).
Our findings appear to be consistent with clinical data. For instance, a Finnish retrospective study assessed the proportion of quinolone-susceptibleE. coliurine isolates before and after a nationwide restriction of ciprofloxacin use was implemented in Finland. The research revealed that a reduced consumption of quinolone antibiotics resulted in a significant decrease in quinolone-resistance ofE.
coli (Gottesman et al., 2009). Our laboratory study also shows that ciprofloxacin-resistance has declined in 66% of initially resistant populations, following a long-term exposure to antibiotic-free medium (Figure 3D). Another study examined the impact of a 24 month voluntary restriction on the use of trimethoprim-containing drugs in Sweden on the prevalence of trimethoprim-resistantE. coli isolated from urinary-tract infections. All clinical isolates were found to retain their resistance levels and carried mutation infolA, the target gene of trimethoprim, even after 24 months of trimethoprim restriction (Brolund et al., 2010). In agreement with this clinical study, we have found that all five tri- methoprim resistantE. colistrains with a folAresistance mutation have maintained their resistance following laboratory evolution in antibiotic-free medium (Figure 3-source data, Figure 4—source data 1). These considerations must be taken with some caution, as comparison of clinical and labora- tory data is not straightforward. For instance, restricted usage of certain antibiotics in hospitals can- not completely eliminate antibiotic selection in a given region due to lack of isolation and cross- resistance between antibiotics.
In summary, three main patterns indicate that phenotypic reversion to an antibiotic-susceptible state could be common during compensatory evolution. In our study, we have observed i) rapid
fitness increase in antibiotic free-medium, ii) associated loss of antibiotic resistance, and we iii) iden- tified specific mutations that simultaneously change both characteristics.
Our findings suggest that restricting antimicrobial usage could be a useful policy to control the increasing rise and spread of multidrug-resistant bacteria, but it may work for certain antibiotics only. We should also emphasize, however, that all our evolutionary experiments were performed in devoid ofanyantibiotics. The next logical step is to study the occurrence of phenotypic reversion during exposure to temporarily changing antibiotic treatments or sublethal antibiotic dosages as it may occur in real-life situations (Andersson and Hughes, 2014). Our study leaves open the question about the extent by which initial fitness costs of resistance mutations and/or intensity of antibiotic selection shapes subsequent compensatory evolution and associated loss of resistance. Finally, our study has focused on chromosomal resistance mutations. It is still unclear whether resistance-confer- ring plasmids are generally lost or the associated fitness costs are mitigated by genomic mutations (Dahlberg and Chao, 2003).
marR marA marR marA
marR marA
Compensatory mutation Resistance
mutation
OM
IM acrA acrB
Antibiotic
AcrA
AcrB porin
A
B
TolC
efflux system
Resistance mutation Compensatory
mutation X
MarA MarR
acrA acrB acrA acrB
Figure 6.Hypothetical mechanism of compensation by amarRcompensatory mutation. Themarregulon participates in controlling several genes involved in resistance to antibiotics including the AcrA/AcrB/TolC multidrug efflux system (panel A). MarR is a transcriptional regulatory protein that controls the activity of themarsystem in wild-typeE. colithrough the repression ofmarA. In response to antibiotic stresses (e.g. doxycycline or ciprofloxacin),marRis mutated (indicated by a red star), leading to increased expression ofmarAand, subsequently, other members of themarregulon (Praski Alzrigat et al., 2017). However, the elevated activity of themarregulon is harmful in antibiotic-free conditions, promoting the accumulation of further mutations. Our study indicates that this can be achieved by a compensatory mutation in the promoter region of themaroperon (indicated by a yellow star). The compensatory mutation putatively restores the activity of themarregulon to the wild-type level (panel B). Source file is available as Supplementary file 1.
DOI: https://doi.org/10.7554/eLife.47088.017
Materials and methods
Key resources table Reagent type
(species) or resource Designation Source or reference Identifiers
Additional information Strain, strain
background (Escherichia coli)
K12 BW25113 (wild type) PMID:25000950 SRA project:
SRX551437
(E. coliAB cross-resistance) Strain, strain
background (Escherichia coli)
SRR1297006 to SRR1297184
(resistant strains)
PMID:25000950 SRA project:
SRX551437
(E. coliAB cross-resistance) Chemical
compound, drug
ETEST
AMPICILLIN AM 256
bioMe´rieux S30-412253
Chemical compound, drug
ETEST
CEFOXITIN FX 256
bioMe´rieux S30-412285
Chemical compound, drug
ETEST
CIPROFLOXACIN CI 32
bioMe´rieux S30-412311
Chemical compound, drug
ETEST
CHLORAMPHENICOL CL 256
bioMe´rieux S30-412309
Chemical compound, drug
ETEST
DOXYCYCLINE DC 256
bioMe´rieux S30-412328
Chemical compound, drug
ETEST
KANAMYCIN KM 256
bioMe´rieux S30-412382
Chemical compound, drug
ETEST
NALIDIXIC-ACID NA 256
bioMe´rieux B30-516500
Chemical compound, drug
ETEST
NITROFURANTOIN NI 512
bioMe´rieux B30-530400
Chemical compound, drug
ETEST
TETRACYCLINE TC 256
bioMe´rieux S30-412471
Chemical compound, drug
ETEST
TOBRAMYCIN TM 256
bioMe´rieux S30-412479
Chemical compound, drug
ETEST
TRIMETHOPRIM TR 32
bioMe´rieux S30-412483
Chemical compound, drug
bisBenzimide H 33342 trihydrochloride
Sigma-Aldrich B2261-25MG PMID:20513705
Chemical compound, drug
carbonyl cyanide-m-
chlorophenyl hydrazone (CCCP)
Life Technologies AC228131000 PMID:20513705
Recombinant DNA reagent
pORTMAGE-3 PMID:26884157 Addgene: Plasmid #72678
Software, algorithm
RStudio (Version 1.1.463) R Core Team (2018).
R: A language and environment
for statistical computing.
R Foundation for Statistical Computing, Vienna, Austria
http://www.r-project.org/
Software, algorithm
ggplot2 package (version 3.0.0) H. Wickham. ggplot2:
Elegant Graphics for Data Analysis.
Springer-Verlag New York, 2016.
https://cran.r-project.org/
web/packages/ggplot2/ggplot2.pdf
Strains
Wild-type strain
Escherichia coliK12 BW25113 was used as a wild-type control in all experiments.
Antibiotic-resistant strains
The 60 multidrug-resistant strains used in this study were derived from our previous work (La´za´r et al., 2014), where parallel evolving populations of E. coliK12 BW25113 were adapted to
increasing dosages of one of 12 antibiotics (Figure 1—figure supplement 1). These antibiotics employed were the following: ampicillin (AMP), cefoxitin (FOX), chloramphenicol (CHL), ciprofloxacin (CIP), doxycycline (DOX), erythromycin (ERY), kanamycin (KAN), nalidixic acid (NAL), nitrofurantoin (NIT), tetracycline (TET), trimethoprim (TMP) and tobramycin (TOB). The evolutionary experiment was continued for~240–384 generations, at which point the evolving populations reached an up to 328-fold increase in resistance compared to the wild-type ancestor. In all cases (except for the CPR9 strain which was found to be characterized by an intermediate level of resistance), the resistance lev- els were above the current clinical breakpoints for resistance according to the Clinical and Labora- tory Standards Institute (CLSI Approved Standard M100, 29th Edition) guidelines. In spite of single antibiotic pressure, the evolution of multidrug-resistance was a frequent phenomenon. The 60 antibi- otic-resistant strains (4–6 strains per antibiotic) were previously subjected to whole-genome sequencing. The identified resistance mutations affected drug targets, cell permeability or efflux pumps.
Medium
Unless otherwise stated, we used minimal salts (MS) medium (1 g/L (NH4)2SO4, 3 g/L KH2PO4and 7 g/L K2HPO4) supplemented with 1.2 mM NA3C6H5O72H2O, 0.4 mM MgSO4, 0.54mg/mL FeCl3, 1 mg/mL thiamine hydrochloride, 0.2% Casamino-acids and 0.2% glucose. As an exception, Lysogeny Broth (LB containing 10 g tryptone, 5 g yeast extract, 5 g sodium chloride per 1 L of water) and Ter- rific Broth (TB containing 24 g yeast extract, 12 g tryptone, 9.4 g K2HPO4, 2 g KH2PO4per 1 L of water) were applied during the pORTMAGE protocol. All components were obtained from Sigma- Aldrich.
Antibiotics
In order to measure the resistance profile of the T60 and corresponding T0 evolved lines we used 11 of the above-mentioned 12 antibiotics (Table 1). Erythromycin (ERY) was excluded from the analysis, as none of the studied strains displayed cross-resistance to it. Standard E-test strips for all remaining antibiotics were purchased from bioMe´rieux. Powder stocks of antibiotics were purchased from Sigma-Aldrich, except for DOX (AppliChem). Antibiotic solutions were freshly prepared on a weekly basis from powder stocks, kept at –20˚C and were filter-sterilized before use.
Laboratory evolutionary experiment
The laboratory evolution experiment followed an established protocol (La´za´r et al., 2014). Briefly, we started with 23 antibiotic-resistant E. coli strains that displayed a significant fitness cost. We excluded erythromycin- (ERY) and nalidixic acid- (NAL) resistant strains from the evolutionary experi- ment, as these strains did not show a significant fitness cost. six parallel lines were initiated from each antibiotic-resistant strain, and were propagated in 96-well microtiter plates in antibiotic-free MS medium for 60 days. All parallel lines were inoculated into randomly selected positions of these 96-well plates. The plates also contained control wells in several positions that were not inoculated by cells to help plate identification and orientation as well as to avoid cross-contamination of parallel evolving lines. Using a manual-held 96-pin replicator (VP407, V and P Scientific), roughly 1.2ml of each stationary phase culture was transferred every day to 100ml of fresh medium. At every 120 transfers, a fraction of the overnight culture was kept at –80˚C as a glycerol stock. Cross-contamina- tion events were regularly checked by visual inspection of empty wells.
High-throughput fitness measurements and determination of growth rate
Fitness measurements
Established protocols were used to measure fitness in bacterial lines (Warringer and Blomberg, 2003). Starter cultures were inoculated from frozen samples into 96-well plates. The starter plates were grown for 24 hr under conditions identical to the evolutionary experiment. 384-well plates filled with 60ml MS minimal medium per well were inoculated for growth curve recording compared to the starter plates, using a pintool with 1.58 mm floating pins. The pintool was moved by a Microlab Starlet liquid handling workstation (Hamilton Bonaduz AG) to provide uniform inoculum across all samples. The 384-well plates were incubated at 30˚C in an STX44 (LiCONiC AG) automated
incubator with alternating shaking speed every minute between 1,000 rpm and 1,200 rpm. Plates were transferred by a Microlab Swap 420 robotic arm (Hamilton Bonaduz AG) to Powerwave XS2/HT plate readers (BioTek Instruments Inc) every 20 min and cell growth was followed by recording the optical density at 600 nm. Five technical replicates of three biological replicate measurements were executed on all strains sampled from each time-point of the evolutionary experiment.
Growth curve analysis
Fitness was approximated by calculating the area under the growth curve (AUGC). AUGC has been previously used as a proxy for fitness (Hasenbrink et al., 2005) and it has the advantage to integrate multiple fitness parameters, such as the slope of exponential phase (growth rate) and the final opti- cal density (yield). AUGC was calculated from the obtained growth curves of a 1000 min time interval following the end of lag phase. The end of the lag phase was identified according to an established protocol (Warringer and Blomberg, 2003;Warringer et al., 2003). To eliminate potential within- plate effects that might cause measurement bias, relative fitness was normalized by the fitness of the neighboring reference wells that contained wild-type controls. For each line and each evolution- ary time point, relative fitness was calculated as the median of the normalized AUGC of the technical replicates divided by the median fitness of the wild-type controls. At day 0, the technical replicate measurements of the isogenic, independently evolving lines were combined to calculate median fit- ness for the ancestral antibiotic-resistant strain, since at that time these populations had no indepen- dent evolutionary history. Stringent criteria were used to define the set of antibiotic-resistant strains with a substantial fitness defect: significance was determined by the Mann-WhitneyU-test. Signifi- cance of fitness increase for the evolving lines derived from antibiotic-resistant strains having initial fitness defect was also calculated by the Mann-Whitney U-test. All tests were corrected for false dis- covery rate (FDR-correctedpvalue < 0.05).
As expected, fitness estimated by AUGC showed a significant positive correlation with fitness estimated by growth rate (Pearson’s correlation, r = 0.41, p<2.2e-16) or yield (Pearson’s correlation, r = 0.78, p<2.2e-16). Additionally, we found that AUGC is more robust than yield, that is it shows less variation across biological replicates (median CVs values for AUGC and yield are 8.3% and 14.1%, respectively).
Determination of the minimal inhibitory concentration (MIC)
Minimal inhibitory concentrations (MICs) were determined using standard E-test strips (bioMe´rieux) according to the manufacturer’s instructions. Briefly, overnight cultures of bacteria were diluted to an optical density (OD600) of 0.6. 100ml of the diluted inoculum was spread on each MS agar plate and the plates were incubated at 30˚C for 24–48 hr. MICs were read directly from the E-test strips according to the instructions of the manufacturer. Based on the MIC results, we categorized each strain as being resistant (R), intermediate (IM) or susceptible (S) to each investigated antibiotic according to the Clinical and Laboratory Standards Institute (CLSI Approved Standard M100, 29th Edition) guidelines.
Hoechst 33342 (Bisbenzimide H 33342) accumulation assay
To estimate changes in membrane permeability and efflux pump activity, we implemented a scalable fluorescence assay (Coldham et al., 2010). This method is based on the intracellular accumulation of the fluorescent probe Hoechst 33342 (Bisbenzimide H 33342, Sigma-Aldrich). Strains were cultured in eight biological replicates overnight at 30˚C and stationary phase cultures were regrown in fresh medium to an optical density (OD600) of 0.6 at 30˚C. Bacterial cells were collected by centrifugation at 4000 g and resuspended in 1 mL phosphate-buffered saline (PBS). The optical density (OD600) of all suspensions was adjusted to 0.1, and 0.18 mL of each suspension was transferred to 96-well plates (CellCarrier-96 Black Optically Clear Bottom, supplied by Sigma-Aldrich). Plates were incu- bated in a Synergy two microplate reader at 30˚C, and 25mM Hoechst 33342 was added to each well. The wild-typeE. coliK12 BW25113 treated with an efflux inhibitor agent (carbonyl cyanide-m- chlorophenyl hydrazone, CCCP, Life Technologies) served as a positive control. The OD600and fluo- rescence curves were recorded for 1 hr with 75 s delays between readings. Fluorescence was read from the top of the wells using excitation and emission filters of 355 and 460 nm, respectively. The first 15 min were excluded from further analysis due to the high standard deviation between
replicates. Blank normalized OD600values were calibrated by applying the following transformation:
ODcalibrated = OD600+0.49312 * OD6003
. Data curves were smoothed and fluorescence per OD600
ratio curves was calculated. Finally, areas under these ratio curves were determined.
Allelic replacements
Utilizing multiplex automated genome engineering (MAGE) (Nyerges et al., 2016) we reconstructed two candidate T60 compensatory mutations and the corresponding T0 resistance mutations in the wild-type genetic background (separately and in combination as well), as well as the compensatory mutations in the corresponding initial antibiotic-resistant strains.
Each MAGE cycle consisted of the following steps: Upon reaching OD600 = 0.4–0.6, cells were transferred to a 42˚C shaking water bath to inducel-Red protein expression for 15 min at 250 rpm.
Cells were then immediately chilled on ice for at least 10 min. Electrocompetent cells were made by washing and pelleting the cells twice in 10 mL of ice-cold dH2O. 40mL cell suspension was mixed with 1mL of 100mM oligonucleotide. Electroporation was done on a BTX (Harvard Apparatus) CM- 630 Exponential Decay Wave Electroporation System in 1 mm gap VWR Signature Electroporation cuvettes (1.8 kV, 200W, 25mF). Immediately after electroporation, 1 mL TB + 2 ml LB medium was added onto the cells to allow recovery. The 100,000 diluted cells were spread onto solid medium and incubated at 30˚C for 24 hr. Allelic replacement frequencies for all strains were measured at each locus by allele-specific PCR. Selected clones carrying the desired modifications were verified by capillary sequencing.
Whole-genome sequencing
To identify potential compensatory mechanisms, 15 T60 adapted lines derived from a total of 10 antibiotic-resistant T0 strains were chosen for whole-genome sequencing. These T60 lines were cho- sen to represent diverse patterns of resistance loss, as well as to cover T0 strains adapted to a vari- ety of antibiotics. E. coligenomic DNA was prepared with GenElute Bacterial Genomic DNA Kit (Sigma-Aldrich) and quantified using Qubit dsDNA BR assay in a Qubit 2.0 fluorometer (Invitrogen).
200 ng of genomic DNA was fragmented in a Covaris M220 focused-ultrasonicator (peak power:
55W, duty factor: 20%, 200 cycles/burst, uration: 45 s) using Covaris AFA screw cap fiber micro- TUBEs. Fragment size distribution was analyzed by capillary gel electrophoresis using Agilent High Sensitivity DNA kit in a Bioanalyzer 2100 instrument (Agilent) and then indexed sequencing libraries were prepared using TruSeq Nano DNA LT kit (Illumina) following the manufacturer’s instructions.
This, in short, includes end repair of DNA fragments, fragment size selection, ligation of indexed adapters and library enrichment with limited-cycle PCR. Sequencing libraries were validated (library- sizes determined) using Agilent High Sensitivity DNA kit in a Bioanalyzer 2100 instrument, then quantified using qPCR based NEBNext Library Quant Kit for Illumina (New England Biolabs) with a Piko-Real Real-Time PCR System (Thermo Fisher Scientific) and diluted to 4 nM concentration.
Groups of 12 indexed libraries were pooled, denatured with 0.1 N NaOH, and after dilution loaded in a MiSeq Reagent kit V2-500 (Illumina) at 8 pM concentration. 2 250 bp pair-end sequencing was done with an Illumina MiSeq sequencer, primary sequence analysis was done on BaseSpace cloud computing environment with GenerateFASTQ 2.20.2 workflow.
Paired-end sequencing data were exported in FASTQ file format. The reads were trimmed using Trim Galore (Babraham Bioinformatics) and cutadapt (Martin, 2011) to remove adapters and bases where the PHRED quality value was less than 20. Trimmed sequences were removed if they became shorter than 150 bases. FASTQC program (https://www.bioinformatics.babraham.ac.uk/projects/
fastqc/) was used to evaluate the quality of the original and trimmed reads.
The Breseq program was used with default parameters for all samples. The gdtools was used for annotating the effects of mutations and compare multiple samples. The genbank formatted refer- ence genome BW25113.gb was used as a reference genome in the analysis. Sequencing data have been deposited in the NCBI Sequence Read Archive (SRA) under the accession number of PRJNA529335: (URL:https://www.ncbi.nlm.nih.gov/sra/PRJNA529335).
Additional information
Funding
Funder Grant reference number Author
H2020 European Research Council
H2020-ERC-2014-CoG 648364 – Resistance Evolution
Csaba Pa´l
Gazdasa´gfejleszte´si e´s Innova´- cio´s Operatı´v Programm
GINOP-2.3.2-15-2016-00014 Csaba Pa´l
Gazdasa´gfejleszte´si e´s Innova´- cio´s Operatı´v Programm
GINOP-2.3.2-15-2016-00020 Csaba Pa´l
Hungarian Academy of Sciences
Momentum Programme LP- 2017-10/2017
Csaba Pa´l
National Research, Develop- ment and Innovation Office
E´lvonal Programme KKP 126506
Csaba Pa´l
Wellcome Trust WT 098016/Z/11/Z Bala´zs Papp
Gazdasa´gfejleszte´si e´s Innova´- cio´s Operatı´v Programm
GINOP-2.3.2-15-2016-00026 Bala´zs Papp
Wellcome Trust WT 084314/Z/07/Z Csaba Pa´l
National Research, Develop- ment and Innovation Office
FK 128775 Zolta´n Farkas
Magyar Tudoma´nyos Akade´-
mia Lendu¨let Programme LP
2012-32/2018
Csaba Pa´l
Magyar Tudoma´nyos Akade´- mia
Postdoctoral Programme PD-007/2016
Vikto´ria La´za´r
Magyar Tudoma´nyos Akade´- mia
Postdoctoral Programme PD-038/2015
Zolta´n Farkas
National Research, Develop- ment and Innovation Office
NKFI-112294 La´szlo´ Bodai
Magyar Tudoma´nyos Akade´- mia
Lendu¨let Programme LP2009-013/2012
Bala´zs Papp
The funders had no role in study design, data collection and interpretation, or the decision to submit the work for publication.
Author contributions
Anett Dunai, Zolta´n Farkas, Conceptualization, Formal analysis, Investigation, Visualization, Methodology, Writing—original draft, Writing—review and editing, Interpretation of data; Re´ka Spohn, Conceptualization, Formal analysis, Supervision, Investigation, Methodology, Writing—
original draft; Vikto´ria La´za´r, Conceptualization, Formal analysis, Supervision, Investigation, Methodology; A´da´m Gyo¨rkei, Bala´zs Szappanos, Formal analysis, Interpretation of data; Ga´bor Apjok, Methodology; Ga´bor Boross, Formal analysis, Methodology, Interpretation of data; Ga´bor Gre´zal, Formal analysis, Visualization, Interpretation of data; Aniko´ Farago´, La´szlo´ Bodai, Resources, Bioinformatic analysis of whole genome sequencing data; Bala´zs Papp, Resources, Funding acquisition, Writing—review and editing; Csaba Pa´l, Conceptualization, Supervision, Funding acquisition, Writing—original draft, Writing—review and editing
Author ORCIDs
Anett Dunai https://orcid.org/0000-0001-6270-9603 Zolta´n Farkas https://orcid.org/0000-0002-5085-3306 Ga´bor Boross https://orcid.org/0000-0002-7208-5678 La´szlo´ Bodai https://orcid.org/0000-0001-8411-626X Csaba Pa´l https://orcid.org/0000-0002-5187-9903