21
Szabolcs Mátyás Ph.D. police major, assistant professor University of Public Service
matyas.szabolcs@uni-nke.hu (ORCID: 0000-0001-9529-7596)
Zsolt Lippai police lieutenant-colonel, master instructor University of Public Service
lippai.zsolt@uni-nke.hu (ORCID: 0000-0003-4211-2249)
Ágota Németh police lieutenant-colonel, master instructor University of Public Service
nemeth.agota@uni-nke.hu (ORCID: 0000-0002-1956-2033)
Erika Gál police major, master instructor University of Public Service
gal.erika@uni-nke.hu (ORCID: 0000-0003-1676-0381)
Ivett Nagy Ivett police lieutenant, Ph.D. student
University of Public Service Doctoral School of Police Sciences and Law Enforcement Nagy.Ivett@uni-nke.hu (ORCID: 0000-0001-7195-7000 )
Péter Felföldi traffic engineer MSc, teacher University of Public Service
felfoldi.peter@uni-nke.hu (ORCID: 0000-0002-7768-2164)
CRIMINAL GEOGRAPHICAL ANALYSIS OF CYCLING ACCIDENTS IN BUDAPEST
Keywords: criminal geography, traffic, accident, bike, traffic accident
Abstract
Several studies have already mentioned that geographic crime methods are also suitable for analyzing traffic accidents and crime. However, the theory was not followed by practical work, so like many research topics, it was only stuck at the level of theory. The study is part of a series of studies listing possible areas of research in criminal geography. The present study examines
the spatial location of bicycle traffic accidents in the Hungarian capital. It tries to shed light on regularities that can help to find out the cause of bicycle traffic accidents in the Budapest Police Headquarters and to reduce the number of accidents. In this paper the focus is on the Grand Boulevard in Budapest, highlighted the accidents on its Pest section.
1. Introduction
According to Nobel Prize-winning English scientist Bertrand Russel, "Sin is geographical.”
This finding is also valid in the investigation of traffic accidents. Geographical regularities can also be observed in the investigation of traffic accidents. Evident: an accident is not a "sin."
However if we have a sufficiently large number of accident statistics it is possible to state spatial correlations between each accident that can be successfully used in subsequent accident prevention work. As we mentioned many authors have dealt with the possibility of the applicability of criminal geography in the field of traffic policing (Mátyás-Sallai 2014, Tóth 2007); however such research has not been carried out in Hungary so far.
Criminal geography research mostly covered the area of the capital; although this research usually analyzed the crime geography of only a few districts and examined only the spatial distribution of the events. The study covering the whole capital was carried out by the authors János Sallai - István Kobolka (2008) and Gábor Michalkó; the latter researcher analyzed the criminal geography of the capital from the aspect of tourism security (2002). Based on these, we can state that present research can be considered unique and novel in criminal geography and law enforcement in Hungary.
We are pleased to state that the depiction of crimes and accidents on digital maps is becoming more and more widespread in Hungary as well. There are still several websites where certain types of accidents and crimes can be displayed (eg. www.police.hu, https://prestat.lechnerkozpont.hu). However these allow only limited access to the public and in many cases to the investigation's interests. The available data is also delayed. However the PRESTAT system is also available from the RobotZsaru system (the main data processing system of the Hungarian Police) which contains up-to-date data and allows street-level analyses (with strict restrictions of usage and data security). However a standalone map cannot says much information in its own. It is necessary to have a competent specialist who can draw conclusions, establish regularities, shed light on the causes of accidents and possibly forecast for the future.
23
In the present study the authors want to study the primary spatial distribution of bicycle traffic accidents in the area of competence of the Budapest Police Headquarters and on the Grand Boulevad.3
2. Milestones in the history of cycling
According to a saying attributed to Lech Walesa, “I am a lazy person. But the lazy man also invented the wheel and the bike because he hated walking and sneaking.”
(https://www.brainyquote.com) Did a really lazy person invent the bike? If I were Italian I would protest and argue with reference to the raw bicycle-like sketch of Leonardo da Vinci’s Codex Atlanticus4 while in German I would mention Baron Karl Freiherr von Drais’s (1785- 1851) treadmill. The treadmill dubbed “Draisine” was greeted with mixed emotions. The single- track pedal-less vehicle with two iron wheels and a steerable rod mounted on the front wheels could roll at speeds of up to 15 kilometers per hour; four times faster than the horse-drawn carriages used at the time (https://ng.24.hu).
To remedy the problem of the lack of pedal-less Scottish blacksmith Kirkpatrick Macmillan built the world’s first pedal-equipped treadmill in his village workshop in Dumfriesshire (Németh 2012). (Also to his name is the first bicycle fine in world history imposed by Glasgow police in five schillings for injury to a passing child /http://www.bbc.co.uk/.) In the early 1860s Piere Michaux (1813-1883) further developed the dandy horse.5 This resulted in the birth of the velocipede, which is considered the predecessor of today's bicycle.6 A company called Michaux et Cie embarked on the mass production of bicycles initially mounted on a simple wooden frame then on more sophisticated two-piece cast-iron frames and later on a diagonal wrought iron frame. International and cross-continental bicycle sales as well as growing interest in bicycle
3 Among the causes, many factors play a role that the study authors did not examine in the present research. When investigating the causes of accidents it is necessary to use transport geography, settlement geography, natural geography factors as well as examine the catchment area of a given settlement (see Bujdosó 2004 for more details).
Unfortunately drug use is increasingly included as a causal factor among the causes of accidents. In the present research neither alcohol nor drugs were investigated among the causes of accidents which can only be investigated within a national framework. The regulation of intoxication and drug addiction is different in each country; there is no uniform European regulation (Mészáros 2016). Numerous studies have already shown that. Traffic accidents, various drugs are unfortunately occurring in increasing proportions in many areas of life (Major 2013, Sivadó 2016, Sivadó 2017).
4 It has been proven that Leonardo’s bicycle does not belong to Leonardo not even to an talented disciple but to the drawing of a monk who restored manuscripts in the 1960s. The material of the paper and ink was analyzed and although the paper was originally from the XV. century but the ink is from the XX. century.
5 The dandy horse is a derogatory term for a human-powered two-wheeled vehicle that is considered the forerunner of the bicycle.
6 The bicycle is the forerunner of today’s bike. The difference between today’s bikes and velocipedes is in the drive. In the case of velocipedes, the front wheel was driven directly.
demand have resulted in the production of several additional products (e.g., more comfortable seat, tire, chain drive, mudguard, ball bearing) and further continuous development of the bicycle. (More than a hundred patents have been filed for the technical improvement of bicycles in Britain.) The late 19th-century bicycle was a sporting asset for wealthy citizens but it still struggled with significant technical shortcomings at the time. At this time we can talk about the widespread use of the bicycle mainly due to the lack of free time available for cycling and the low purchasing power of the lower classes. As part of an unstoppable development to this day John Kemp Starley (1854-1901) created a bicycle that can be slowed down with a brake and can be said safe in today's sense. Using the innovations of John Boyd Dunlop (1840-1921) Edouard Michelin (1859-1940) created the bicycle tire that could be pumped through a valve.
In 1878, the first bicycle that could be rolled by foot appeared in Hungary. Later bicycle shops were opened and large bicycle companies seeing the growing demand set up warehouses.
Cycling schools have opened and published books on cycling maintenance throughout the country as well as newspapers on cycling. Cycling associations have played (and still play) a major role in creating a culture of cycling as they have taught people how to use the bike properly. These organizations nowadays carry out a wide range of activities to promote the bicycle as a means of transport (Frisnyák 1988).
3. Traffic in Budapest
Today, cycling is a form of urban transport as well. At the beginning of the 2010s cycling was also rising on Budapest's modal split (Felföldi 2020). This was mainly due to the flexibility of this mode of transport and the increase in congestion in the downtown areas which could also be explained by the increase in the level of motorization (Holló 1998). As a youthful and seemingly independent mode of mobility cycling emerged as a fashionable alternative by the early 2010s. However this growth reached an upper limit by the middle of the decade and it can be said that those who felt comfortable in cycling in Budapest changed their transport habits by then. This group did not expand significantly until 2019 based on traffic data.
The COVID-19 pandemic also appeared in Hungary in 2020. It has created an entirely new urban transport situation. The transport of big cities has changed with incredible dynamism thanks to the people's closures and their caution. This has resulted in a drastic passenger loss of public transport (Ekés et al. 2020) in favour of private transport. The total volume of turnover also decreased (Nagy 2020). The remaining turnover was significantly restructured therefore the decrease in turnover did not occur to the same extent. Thanks to this restructuring there has
25
been a 'now or never' attitude in transport management worldwide. Individual cities being given the opportunity to manage their long-standing transport management problems without the situation created by COVID-19. In this changed situation the possibility of diverting transport processes to a new channel was also included. One of the most visible examples of this in Budapest was the cycling infrastructure which was gradually being built on Nagykörút (Big Boulevard) and was considered temporary for the first time but was finalized in the autumn of 2020 after several technical changes.
3.1. Bicycle accidents on the Budapest Grand Boulevard
The present research's primary goal was to determine whether the distribution of accidents shows any geographical features in downtown Budapest. In the present paper, the whole city center means the area within the Grand Boulevard, which is south of the Margaret Bridge, north of the Petőfi Bridge. In Pest it bordered by the Ferenc, József, Erzsébet, Teréz and Szent István boulevards (classically it is the Grand Boulevard in the public discourse) and in Buda by Irinyi József street, Karinthy Frigyes road, Villányi street, Alkotás road, Széll Kálmán square and Margit boulevard. This area with its roughly 12 km2 exceeds the size limits of the present research. Therefore we limited the focus of the study only to the Pest section of the Grand Boulevard.
One of the frequently asked questions is whether it is worthwhile or necessary to create a cycling infrastructure in an urban environment. The biker can travel on the road by following the rules even without the need of bicycle surfaces. As we can see from the traffic counts (Felföldi 2020) this ratio has stagnated in the last 4-5 years. In comparison as a result of the developmnt of the infrastructure the proportion of cyclists rised in 2020 even in the less weather-attractive months. This fact clearly cannot be attributed to a random effect (Halász 2021).
However the question arises that how the modified infrastructure and the changed composition of road users affect road safety. The answer to this can be found out by a more detailed analysis of the accidents registered by the Budapest Police Headquarters (BRFK). Data are available for the research from 2011 to 2020 with the same method. From 2013 to the end of 2020 the location of accidents involving cyclists and investigated by the BRFK is also known if the cyclist causes the accident. Such an in-depth analysis was performed for the 2011 and 2012 data (Felföldi 2013) which can be used to determine the proportion of causes and participants for those two years. From the data collected from 2013 it is possible to determine the proportion
of causes and participants in relation to all accidents in Budapest. It is also possible to filter out the number and severity of accidents that apply only to the examined section of the Pest boulevard.
First of all, look at the accident numbers for 2011 and 2012 as location data for cyclists and participants is available. In later years, only the location data of the causes are known. In Chart 1, we can see their evolution from 2011 to 2020.
Chart 1: Bicycle accidents in Budapest (2011-2020) (blue: accident cause; red: injured) Source: Own editing based on BRFK accident data
For the first time the chart shows the high proportion of bicycle accident victims in 2015. There is no logical explanation for this as there was no change in BRFK's accident recording methodology this year. However, the cycling traffic counters data do not show any discrepancy that would justify this leap.
However, from the point of view of the present study the period from 2017 to 2020 is much more interesting. The bikers’ role played in the accident seems to be reversed. Cyclists cause a trend-like increase in the last 3 years.
It can also be said that while the usage of cycling has jumped, the emerging number of cyclists may also have a smaller traffic routine. However, the declining casualty rate also suggests that other road users pay more attention to cyclists. However in 2020 all other modes of transport generated a lower presence due to closures.
221
252
271 236
234 237 226
281 282
350
219 290
224 220
670
269 239
240 192 196
2 0 1 1 2 0 1 2 2 0 1 3 2 0 1 4 2 0 1 5 2 0 1 6 2 0 1 7 2 0 1 8 2 0 1 9 2 0 2 0 Kerékpáros okozó Kerékpáros részes
27
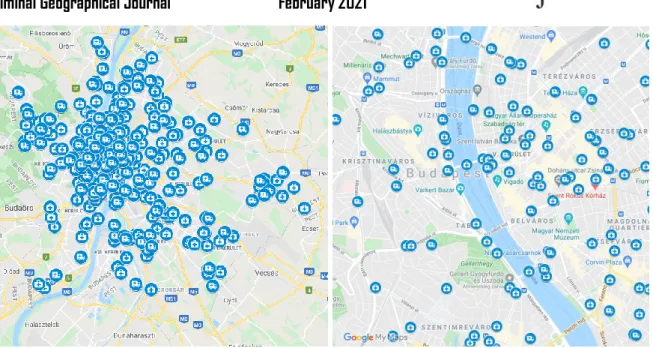
Figure 1: Locations of minor, serious and fatal accidents with cyclists in Budapest. Only the city center on the right (2020). (first aid kit: minor injury accident; ambulance:
serious injury accident; skull and crossbones: fatal accident) Source: BRFK accident data and Google Maps, own editing
As the rate of causes was the highest in 2020 we also plotted this year separately on a map for the whole city and approached the studied area in more detail. It can be seen that in the city center where we assume density based on the overview map we cannot find a more serious focal point of accidents on closer inspection. This is only a one year data and only the causes have been plotted.
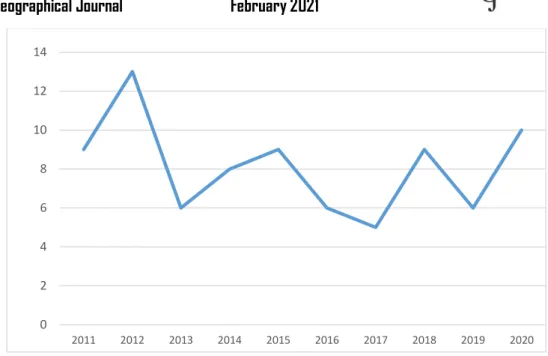
Diagram 2: Grand Boulevard, cycling causes, 2011-2020 Source: Own editing based on BRFK accident data
In connection with the Grand Boulevard in Pest, we can see in Figure 2 how the cyclists'-caused accidents developed. The number of cases is not high therefore the curve has a stochastic effect.
It can be said that in the first half of 2010 the average value was higher than towards the end of the decade.
0 2 4 6 8 10 12 14
2011 2012 2013 2014 2015 2016 2017 2018 2019 2020
29
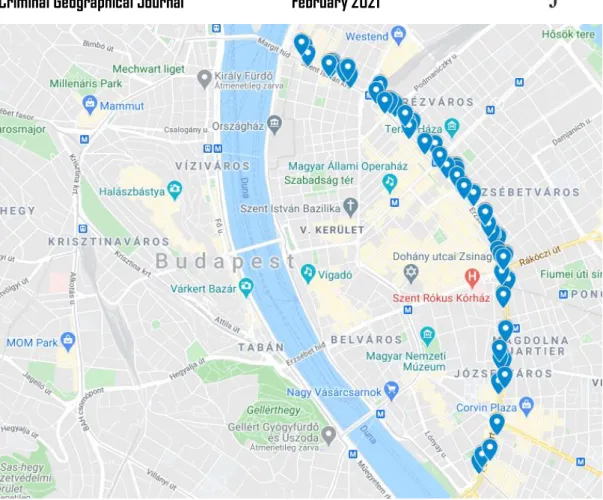
Figure 2: Bicycle accidents on the Pest section of the Grand Boulevard (2013-2020) Source: BRFK accident data and Google Maps, own editing
Figure 2 shows the accidents on the examined Pest Grand Boulevard section between 2013 and 2020. Regarding to Budapest as a whole it can be said that instead of accident focal points it is possible to name more dangerous routes with a higher accident density in Budapest. From a distance the whole Grand Boulevard one of this dangerous routes. Although in detail accident densities can be discovered even within this section. In two cases, even accident hotspots can be found.
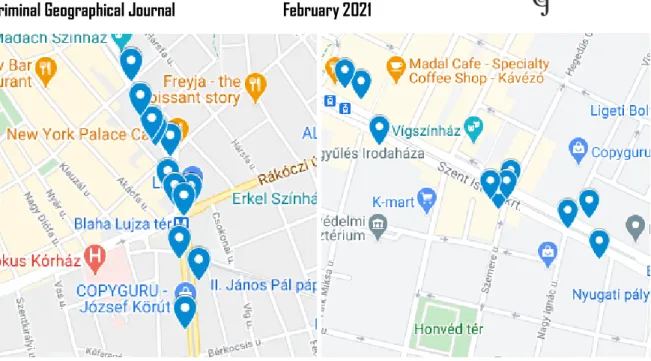
Figure 3: Accident densities in the Pest section of the Grand Boulevard.
Left: Blaha Lujza Square, right: Szent István boulevard Hegedűs Gyula street junction (2013-2020)
Source: BRFK accident data and Google Maps, own editing
It can be misleading that Figure 2 and Figure 3 do not show accidents differentiated by time. It should be remembered that these markers show eight years of aggregate data. In such a time frame 3-4 accidents registered at the same address or adjacent addresses do not count as extraordinary. No long-term conclusions should be drawn from 2020 on either transport safety or urban development. There is an organic pace of traffic development that can be catalyzed by certain effects (for example the closures caused by COVID-19).
Closing thoughts
It is impossible to draw far-reaching conclusions from the number and location of accidents, not only in the Grand Boulevard case but even from the entire Budapest data set. As mentioned earlier in the Grand Boulevard case four significant changes were made only in 2020 in relation to cycling infrastructure development. COVID-19 created a situation that no one had encountered before. It is understandable that the legislators, traffic developers and managers of certain public areas had to solve a new and unknown challenge with no ready-made scenario.
Traffic had to adapt to often changing conditions within six months. This turbulent situation in terms of traffic is still going on. In order to get to know the long-term impact of the cycling
31
infrastructures created as a result of COVID-19 further data collection and analysis will be necessary, among others a more thorough study of municipal law enforcement plans (see more:
Christian-Bacsárdi 2017) and repetitive traffic counts on the examined aeras.
References
BUJDOSÓ, ZOLTÁN (2004): A megyehatár hatása a városok vonzáskörzetére Hajdú-Bihar megye példáján, PhD dissertation, Debreceni Egyetem, 221 p.
CHRISTIÁN, LÁSZLÓ - BACSÁRDI, JÓZSEF (2017): Hol tart jelenleg az önkormányzati rendészet? In: Christián, László (szerk.): Rendészettudományi kutatások: Az NKE Rendészetelméleti Kutatóműhely tanulmánykötete, Budapest, Dialóg Campus Kiadó, pp. 27- 38.
EKÉS, ANDRÁS – SURÁNYI, RÁHEL (2020): A koronavírus hatása a városi közösségi közlekedésre – zuhanás és visszakapaszkodás. Közlekedéstudományi Egyesület: Városi közlekedés 2020. különszám 9-16.p.
NÉMETH, BALÁZS (2012): Kerékpártörténeti áttekintés
(https://bikemag.hu/tudastar/kerekpartorteneti-attekintes/ - 22 10. 2020.)
A kerékpározás sportágtörténete (https://sportszertar.wordpress.com/kerekpar_tortenet/ - 23.
10. 2020.)
FELFÖLDI, PÉTER (2013): A budapesti kerékpáros balesetek vizsgálata 2011-2012-ben, javaslatok a megelőzésre. Budapesti Műszaki és Gazdaságtudományi Egyetem (diplome work) 96 p.
FELFÖLDI, PÉTER (2020): Mikromobilitás és balesetek a budapesti közutakon. In: Marton Zsuzsanna – Németh K. – Pelesz, P. – Péter E. (szerk.) IV. Turizmus és Biztonság Nemzetközi Tudományos Konferencia Tanulmánykötet. Nagykanizsa, Pannon Egyetem Nagykanizsai Kampusz, 120. p.
FRISNYÁK, ZSUZSA (1988): A kerékpározás kultúrájának kialakulása Magyarországon. In:
A Közlekedési Múzeum Évkönyve 8. 1985-1987. pp. 321-336.
(http://real.mtak.hu/23774/1/kerekparozas.pdf – 23. 10. 2020.)
HALÁSZ, ÁRON: 15%-kal több kerékpározót mértek Budapesten 2020-ban, decemberben
61%-kal többet, mint egy éve – Magyar Kerékpárosklub
(https://kerekparosklub.hu/ibikebudapest/15_szazalekkal_nott_a_budapesti_kerekparforgalom _2020-ban – 15. 01. 2021.)
HOLLÓ, PÉTER (1998): A motorizációs szint szerepe a közúti közlekedésbiztonság nemzetközi összehasonlításában. In: Belügyi Szemle (1995-2006), 46(2), 17.
KOBOLKA, ISTVÁN – SALLAI, JÁNOS (2008): Budapest kriminálgeográfiája 1960-1985.
között. In: KBH Szakmai Szemle 3. pp. 86-102.
MÁTYÁS, SZABOLCS – SALLAI, JÁNOS (2014): Kriminálgeográfia. In: Ruzsonyi P.
(szerk.) Tendenciák és alapvetések a bűnügyi tudományok köréből. Budapest, pp. 335-353.
MAJOR, RÓBERT (2013): Az ittas gépjárművezetés új büntetőjogi szabályozása, avagy áttörés várható a deliktum elleni küzdelemben. In: Belügyi Szemle 7-8 szám
MÉSZÁROS, GÁBOR (2016): A közlekedési balesetmegelőzés rendszerének információs folyamatai. In: Pécsi Határőr Tudományos Közlemények XVII, A határrendészettől a rendészettudományig, Pécs, 246. p.
MICHALKÓ, GÁBOR (2002): Magyarország turizmusának kriminálgeográfiája. In: Belügyi Szemle 10. pp. 68-85.
NAGY, SÁNDOR (2020): A koronavírus hatása a városi életre és közlekedésre.
Közlekedéstudományi Egyesület: Városi közlekedés 2020. különszám, pp. 5-8.
SIVADÓ, MÁTÉ (2016): Migráció és drogok kapcsolata Magyarországon – némi európai kitekintéssel. In: Hautzinger Zoltán (szerk.): A migráció bűnügyi hatásai. Budapest: Magyar Rendészettudományi Társaság Migrációs Tagozat, pp 131-140 (2016)
SIVADÓ, MÁTÉ (2017): Jelenkori drogpolitika Magyarországon és Európában, tengerentúli kitekintéssel. In: Szabó Csaba (szerk.): Studia Doctorandorum Alumnae: Válogatás a DOSz Alumni Osztály tagjainak doktori munkáiból. Budapest: Pytheas Kiadó, pp 11-265.
TÓTH, ANTAL (2007): A bűnözés térbeli aspektusainak szociálgeográfiai vizsgálata Hajdú- Bihar megyében. Ph.D. értekezés, Debreceni Egyetem, 250 p.
http://www.bbc.co.uk/history/historic_figures/macmillan_kirkpatrick.shtml 22. 10. 2020.) https://www.brainyquote.com/quotes/lech_walesa_391596 (21. 10. 2020.)
https://www.codex-atlanticus.it/#/ (22. 10. 2020.)
187 éves az ősbicikli (https://ng.24.hu/kultura/2004/06/11/187_eves_az_osbicikli/ - 22. 10.
2020.)


