JOURNAL OF CENTRAL EUROPEAN GREEN INNOVATION HU ISSN 2064-3004
DOI: 10.33038/JCEGI.2018.6.3.13
Available online at http://greeneconomy.uni-eszterhazy.hu/
TIPIFYING THE FINANCIAL POSITION OF THE HUNGARIAN CORPORATE SECTOR IN THE PERIOD BETWEEN 2006 AND 2015
ARANKA BARANYI
baranyi.aranka@uni-eszterhazy.hu
Abstract
When examining the number of businesses in our country, we conclude that it is under- going continuous transformation. Over the last decade, the corporate sector has not only rejuvenated, but also its financial situation is changing. Improving the performance of the domestic corporate sector is an indispensable driving force for domestic economic growth. In my research, I was examining the financial situation of a couple of businesses operating for ten years, whether it is possible to typify these businesses based on their fi- nancial performance and classify them by statistically supported methods and, if so, how well these groups can be distinguished. 3658 members of the examined SME sector were analysed by factor and cluster analysis. The study was carried out with the processing and analysis of secondary data, the aggregate part of which is from the publicly avail- able source of KSH’s electronic form, while Opten Kft. has provided me another - most important part in June 2017.
Keywords: small businesses, statistical methods, lending, liquidity, profitability JEL code:G21, G31; M21, M4
Introduction
The focus of my research is the analysis and typifying the financial situation of the Hungarian SME sector. I was trying to find out how statistical methods can be used to typify these businesses on the basis of which we can group them. Nearly 4,000 companies were selected for this study, who had annual reports between 2006 and 2015 and an analysis of financial indicators was made possible by their data.
Regarding the timeliness of the topic, it is relevant that in 2013 more than 21 million SMEs offered 88.8 million jobs in the European Union, nine out of 10 SMEs and two SMEs in three jobs. (Bán – Csernák, 2018) By examining the age of companies, experts conclude that they are getting younger, the smaller the number of employees employed by a company, the less likely it is to reach its 10th birthday.
Knowing the financial position of the domestic corporate sector can be useful to corporate sector members, creditors, and, of course, to the state itself, as well. It is not negligible that, apart from their role in employment, enterprises provide a significant income for the central budget and become more and more involved in the social financing of various community tasks.
After the material and methodology section, some of the typical data of the do- mestic corporate sector are presented, and then, based on literature, I describe the financing possibilities of the sector, including loans. Based on the factor and cluster analysis, liquidity and capital strength came to the centre, so the presentation of financing has been justified.
Material and methods
The objective of the analysis is to characterize the situation of the Hungarian SME sector by means of financial indicators, on the basis of which how it is possible to classify the enterprises into different groups and then characterize these enterprise groups.
Material
During the examination, the data of nearly 80,000 enterprises provided by OPTEN Ltd. was sorted by different criteria. The primary consideration was that the companies were in the final database, which had an annual report between 2006 and 2015, and the calculation of the indicators I defined was made possible by their data. A secondary analysis was prepared using the data publicly available by the CSO, followed by a special database analysis involving 3658 companies.
Methods
Analysing the financial position of businesses is important for both internal and external stakeholders, such as owners, employees, buyers and suppliers, creditors and prospective investors alike. (Marion Steven, 2008)
Opten Ltd has provided data from corporate enterprises in 2017, which pro- duced annual reports between 2006 and 2015 and had a 10-year database with predictable criteria. In defining the scope of the specified data, the objective was to apply an objective rating system of a given financial institution. The current
“Regulation No 575/2013 / EU of the European Parliament and of the Council on prudential requirements for credit institutions and investment firms” and applica- tion of Regulation (EU) No 648/2012 makes it compulsory to comply with pru- dential requirements. Accordingly, there is a credit institution that does not at all apply the previously used subjective qualification criteria, and exclusively objective risk criteria exist. Regarding data for 2006-2015, the data of more than 180,000 businesses were used for the analysis by Microsoft Excel and SPSS. Preliminary analysis has narrowed the scope of businesses, which is why it was not always pos- sible to test the indicators together, and in many cases too high data significantly distorted the test values. The factor analysis was carried out with 2015 data, and then the cluster analysis was completed. Factor analysis allows you to combine two or more variables at one time by reducing the number of variables in a single factor.
(Sajtos-Mitev, 2006) In my research, factor analysis was used to group the indica- tors used in the debtor rating primarily based on the ones that may be related to liquidity, profitability and capital position.
The cluster analysis algorithm can be hierarchical or non-hierarchical. The hier- archical algorithm searches for new clusters based on the previously created clus- ters, while the non-hierarchical algorithm determines all clusters at once. (Saj- tos-Mitev, 2006) Hierarchical clustering can be agglomerative and divisive. The aggregation-based algorithm first looks at each element as a separate cluster and connects them to larger clusters, while at the end we get a single cluster containing all the elements. The division algorithm, on the other hand, first considers the entire data block as a single cluster and divides it into smaller clusters, while at the end all elements form a separate cluster. (Sajtos-Mitev, 2006) The clustering I made was based on the divisive method. Similarly, the methodology of hierarchic cluster analysis was applied by Bene and his colleagues in the analysis of the food sector SME sector in the north of Hungary. (Bene et al., 2013)
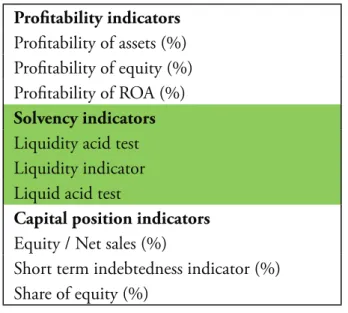
Profitability indicators Profitability of assets (%) Profitability of equity (%) Profitability of ROA (%) Solvency indicators Liquidity acid test Liquidity indicator Liquid acid test
Capital position indicators Equity / Net sales (%)
Short term indebtedness indicator (%) Share of equity (%)
Table 1 The range of indicators examined in the factor analysis Source: author’s own editing based on the credit institutions’ debtor rating policy
Results
In the first part of the survey, I analysed the data on the secondary data of the HCSO in order to provide an introductory picture of the whole sector. In 2016, more than 45% more companies registered than in 2006, an increase of more than half a million registered businesses. Compared to 2016, a substantial increase can be observed until 2013, and only a few percent change later indicates an increase in the number of registered businesses. „About 0.7 percent of today’s businesses, some 4,000 companies were established before the change of regime, that is, only that number of companies exceeded the age of 24. But over the age of 15, it was only a quarter of today’s businesses, so Hungary is characterized by a relatively young company structure. „ (http://hvg.hu/kkv/20131125_A_magyar_cegek_
meg_nem_ertek_el_a_tinedzs)
Figure 2 shows how many of the registered businesses is the number of op- erating registered businesses. It is clear from the data that half of the num- ber of registered enterprises is hardly the number of working enterprises per year, and even the ratio is rather unfavourable for the period under review. In the years prior to the crisis, 52-55% of registered businesses were viable, but with the onset of the crisis, this ratio was rapidly decreasing until 2013-2014, when it reaches a low of 35% and finally, based on the available data, in 2015 a 1% improvement can be observed for the benefit of working enterprises.
Data show that just over one third of registered businesses are viable, ongoing, i.e.
paying taxes, employing people and contributing to GDP.
Figure 1 The number of registered and operating enterprises in Hungary Source: author’s own editing based on CSO data http://statinfo.ksh.hu/Statinfo/haViewer.jsp
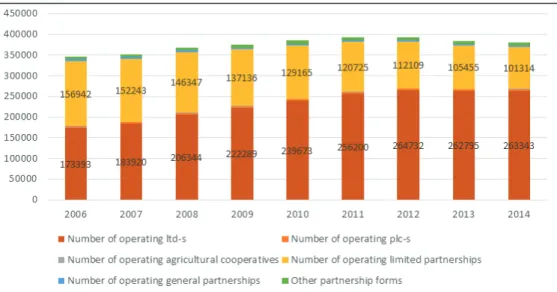
In the following figure I summarize how the number of individual proprietor- ships and corporate businesses in the country between 2006 and 2014 will change in the operating companies.
Figure 2 The number of operating individual proprietorships and corporate businesses in Hungary
Source: author’s own editing based on CSO data http://statinfo.ksh.hu/Statinfo/haViewer.jsp As the data show, the number of individual proprietorships is decreasing, and the role of social enterprises has increased, in 2006 more individual enterprises have been active than social enterprises, during and after the economic and finan- cial crisis, they were decisive. In the case of corporate enterprises, associations and ltd-s were dominant in this period, but this latter form of company did not lose its popularity during the period under review, but with respect to the associations, they decreased by more than 50,000 compared to the beginning of the period.
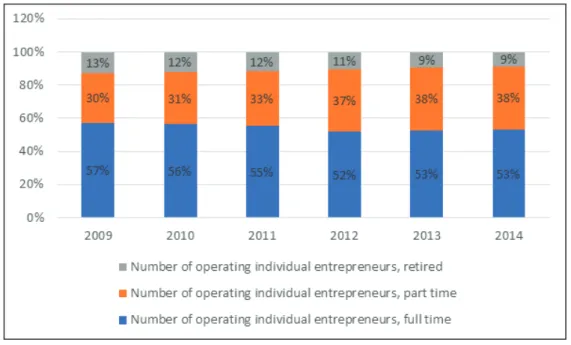
Regarding individual enterprises, the number of retired and part-time employees is dominant over the period, and in 2014 there were 272,170 individual enterprises registered. The following figure shows how the composition of individual business- es is structured, showing the percentage of the distribution data.
Figure 3 The structure of individual businesses (proprietorships) in Hungary Source: author’s own editing based on CSO data http://statinfo.ksh.hu/Statinfo/haViewer.jsp
The smallest number of individual businesses operated in 2012, after which some growth could be discovered. In 2014, 252,187 private enterprises were reg- istered, more than 50% of them were full-time, but in 2009 the highest rate was 57%. The proportion of enterprises with part-time employment is increasing, while retirees are less willing to maintain their business, with a share of only 9%
in 2014, compared to the previous 13%. Regarding the employment role of the domestic business sector, the results are shown below.
Figure 4 Employment in the corporate sector
Source: author’s own editing based on CSO data http://statinfo.ksh.hu/Statinfo/haViewer.jsp In terms of the employment structure, most of the micro-enterprises, including one-person enterprises, are decisive, their numbers increased by 17% compared to 2013, while the number of micro-enterprises employing 2 to 9 people did not change significantly, with only 2% in 2015 compared to 2013.
Employment categories 2013 2014 2015
1-man micro-enterprises 392 914 424 110 461 151
2-9-man micro-enterprises 173 174 170 329 170 322
small enterprises 29 197 30 372 32 013
medium sized enterprises 4 961 5 041 5 144
Non-SME organisations 5 368 5 514 5 750
Table 2 The structure of the corporate sector by the number of employees Source: author’s own editing based on CSO data http://statinfo.ksh.hu/Statinfo/haViewer.jsp
The relationship between corporate growth and funding
The availability of financial resources is a prerequisite for corporate growth. If an enterprise has a stable capital position, it is managed profitably, and it operates by consistently being solvent, then it can count on bank assistance. However, if there are problems in any area, the bank is less able to offer flexible funding. Below I will briefly summarize the financing options that may be the basis for the finan- cial profitability situation of the given business. Financing is the key to providing
financial resources for short and long-term financing needs. The demand for fi- nancial resources affects the private sector as well as the business one. According to László Gyulai (2013): “Enterprise financing is in fact a much more complex concept. It includes the assessment of resource requirements, the well-established decision-making process on financing and implementation of funding decisions, and even the subsequent measurement of their impact. “
Typifying corporate resources can be carried out according to their origin, based on internal and external sources. A special case for internal resources is the reversal of after-tax profits, which is defined by the literature as self-financing. The reinvest- ment of after-tax profits into profit reserves shows well the owners’ future prospects for their company.
The issue of financing may also affect the relationship between buyers and sup- pliers in the business, what payment deadlines arise between the parties, whether buyers know how to finance suppliers or what stock management policy is needed for the company to continue fully meeting consumer needs. The company’s spe- cific income may be either revenue from the sale or the sale of its tangible assets.
The internal resources are not completely free of cost because they pose a risk to the owners similarly to a case when the bank risks own (investor) assets. Cost of ownership is called alternative profit or cost.
Foreign sources have become more and more diverse in recent times, with busi- ness-angels, venture capital companies and institutional investors appearing in addition to traditional bank loans. Banks also have a wealth of opportunities for solvent and capital-intensive businesses. As external financiers, business partners and guarantee institutions may appear. A special source of income is the European Union subsidies, which exerts its beneficial effect on the different project financ- ing, but we can also mention the area-based subsidies that are the basis for agricul- ture. (Gyurcsik P. - Pataki L., 2016)
http://www.tankonyvtar.hu/hu/tartalom/tamop412A/0007_d2_1080_1082_
smeuzletifin/1_1_a_finanszirozas_lenyege_fontosabb_formai_SNzjx9sSaM- oQpDFp.html
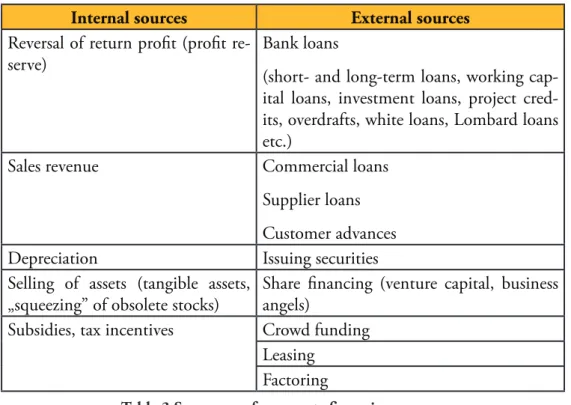
The following table summarizes the alternative options for internal and external resources.
Internal sources External sources Reversal of return profit (profit re-
serve) Bank loans
(short- and long-term loans, working cap- ital loans, investment loans, project cred- its, overdrafts, white loans, Lombard loans etc.)
Sales revenue Commercial loans
Supplier loans Customer advances
Depreciation Issuing securities
Selling of assets (tangible assets,
„squeezing” of obsolete stocks) Share financing (venture capital, business angels)
Subsidies, tax incentives Crowd funding Leasing
Factoring
Table 3 Summary of corporate financing sources
Source: author’s own editing based on Marion Steven (2008) and Andreas Mitschele (2014) Since my analysis is linked to lending based on an objective criterion of a credit institution, relevant secondary data are presented in this study. The figure below shows the share of the SME sector in accordance with the credit target. Investment loans were dominant, the amount of funds used by micro enterprises amounted to HUF 299.5 billion, while small enterprises reached HUF 106.9 billion and me- dium-sized enterprises contracted to HUF 67.9 billion. Of the HUF-based loans, agriculture, manufacturing and trade were the main beneficiaries of the loans, while foreign currency loans were used by transport, real estate and manufacturing industries. Regarding the regional distribution of loans, both the HUF and the foreign currency loans were the most favoured by Pest county enterprises where 24% of all forint loans came in together with 56% of all foreign currency sources.
Figure 5 The share of the SME sector in accordance with the credit target Source: https://www.mnb.hu/sajtoszoba/sajtokozlemenyek/2016-evi-sajto-kozlemenyek /2017-marcius-31-en-zarul-a-novekedesi-hitelprogram, Communique on loans granted
under the third stage of the Growth Loan Programme, 4 April 2017
Figure 6 Changes of credit repayment capability of the corporate sector Source: author’s own editing based on the data of https://www.mnb.hu/felugyelet/idoso-
rok/i-penz-es-hitelpiaci-szervezetek
More than 55% of the outstanding loan portfolio affects micro, small and me- dium-sized enterprises. However, it is clear from the figure that the proportion of non-performing loans is much greater in micro, small and medium enterprises than in the large corporate segment. Without funding there is no growth, no ex- panding employment. Enterprises that see potential breakthroughs in investment and innovation still see a problem in the changes of cost factors. The R & D & I activities of the companies have increased in Hungary in recent years, one of the drivers of which is the European Union’s subsidy policy, while on the other hand, for corporate and local business tax, it can be considered as a tax base reduction item and tax benefits are available. In many cases grants can only be used by larger enterprises, but taxable and tax incentives are also available to smaller companies.
(Széles, 2016)
Typifying businesses based on indicators
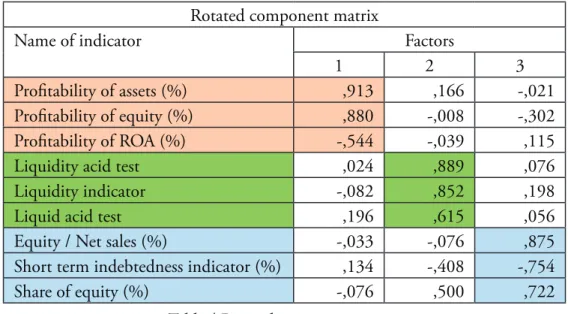
In the following examination, I was looking for answers to the question of whether companies could be sorted into groups and what kind of traits they have based on the indicators. In this test database, all business data are included for which the in- dex could be calculated for 10 years. The relationship between the logically related indicators used is also demonstrated by the SPSS programme, which has enabled three groups (factor) to be created, resulting in the profitable, liquid and capital-in- tensive entrepreneurial group separately. A rotated component matrix was used to justify this statement. According to Varga-Szilágyi (2011): „The interpretation of factors is influenced by the rotation process used in the analysis. Therefore, we are investigating what conclusions can be drawn from the correlations of factors and variables and the data structure. „
Rotated component matrix
Name of indicator Factors
1 2 3
Profitability of assets (%) ,913 ,166 -,021
Profitability of equity (%) ,880 -,008 -,302
Profitability of ROA (%) -,544 -,039 ,115
Liquidity acid test ,024 ,889 ,076
Liquidity indicator -,082 ,852 ,198
Liquid acid test ,196 ,615 ,056
Equity / Net sales (%) -,033 -,076 ,875
Short term indebtedness indicator (%) ,134 -,408 -,754
Share of equity (%) -,076 ,500 ,722
Table 4 Rotated component matrix
Source: author’s own editing based on the data of Opten Kft.
According to Lehota factor analysis is used to »reduce« the number of observed variables. (http://www.tankonyvtar.hu/hu/tartalom/tkt/marketingkutatas/adatok.
html)
During the factor analysis, three well-defined index groups were statistically ver- ifiable, namely the factors of profitability, liquidity and capital intensity, with 3-3 indicators per group.
The process of factor analysis
Definition of the research problem: Characterization of the examined enterpris- es by means of calculated indicators. The number of pre-selected indicators is nine.
The objective of the factor analysis is to reduce the many variables to obtain a more manageable test dimension. Based on the 9 indicators, 3 factors were ultimately generated statistically. Based on a set of indicators, business behaviour can be char- acterized by liquidity and capital intensity.
The Kaiser-Meyer-Olkin (KMO) indicator was used to check the analytical con- ditions.
“The KMO value assesses the ability to factor analysis on a scale from 0 to 1 on a subjective scale. The higher the KMO value, the more accurate the data for the fac- tor analysis. It is not worth calculating with the KMO below 0.5, as the variables are independent, the multicollinearity is weak. “(Varga-Szilágyi, 2011)
Based on the analysis it was found that the examined indicators are not indepen- dent of each other, the strength of the relationship is higher than the intermediate level, so the factor analysis can be performed.
KMO and Bartlett’s Test
Kaiser-Meyer-Olkin Measure of Sampling Adequacy. ,632 Bartlett’s Test of Spheric-
ity
Approx. Chi-Square 117468,103
df 45
Sig. ,000
Deciding on the number of factors: By using the SPSS program, the values of the indicators are placed in decreasing order to separate the factors, bearing in mind that the value of the adjacent correlation coefficient will be higher in abso- lute than the correlation coefficient in the preceding column.
Rotation of factors: The components were rotated using a Varimax method. This method is generally accepted for data purification.
Interpretation of the results: Three factors can be distinguished as a result of the investigation: factor 1 is profitability, 2 is factor of liquidity, 3 is the factor of capital intensity.
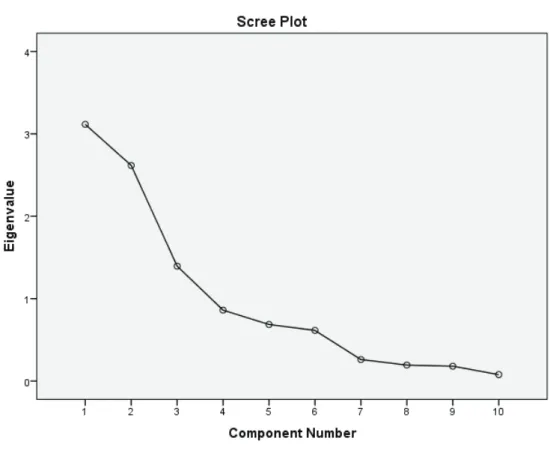
The number of factors was determined on the basis of the “variance ratio meth- od”. “The minimum acceptable variance is 60%, but some disciplines or scientists require 80-90%. But in practice and in economics, there is a rare degree of variance that is so high that we consider 60%. “(Varga-Szilágyi, 2011)
Another method is the Scree test, the result of which is shown in the figure below.
Figure 7 The Scree test Source: author’s own editing
Scree Plot is a two-dimensional diagram showing the eigenvalues on the y axis and the number of factors on the x axis. (Varga-Szilágyi, 2011)
Analysing businesses with cluster analysis
“Cluster analysis is one of the multivariate methods that serve to explore structures and structures between respondents” (Simon J.)
The definition of objects and determining their number is based on the factor 3 separated by the former factor analysis. In the course of cluster analysis, the criteria were analysed with the same weight, which is why these data showed a balanced picture during the factor analysis. Handling the problem of outliers was a serious problem with this significant number of items.
Among clustering methods, hierarchical clustering methods form the second most important class. Similarly to the -middle method, it is still widely used up
to now. There are two basic approaches to creating a hierarchical clustering: merg- ing and splitting methods. The relationship between two clusters in the centroid (centre-based) methods is determined by computing the distance between cluster centres. (Pang-Ning Tan et al., 2011)
Hierarchical clustering is often depicted by a tree-like diagram termed as the dendrogram. (http://www.statisticshowto.com/dendrogram/)
Because of the large number of elements, the dendrogram display was complete- ly incomprehensible, so it does not appear in this form.
Knowing the factors created earlier, typifying enterprises was carried out by 2015. It should be noted, however, that all these companies have shown real per- formance on the basis of the results obtained in the last 9 years.
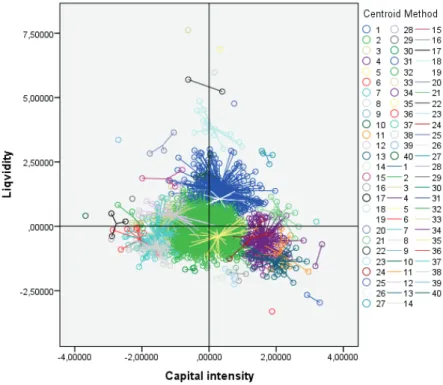
As the graph shows, it is very difficult to create and isolate substantive groups, the structure is extremely fragmented, so instead of the liquidity and capital in- tensity factor, a different combination has to be applied. There were a lot of small groups, some 27, and just three groups that included more than 5% of businesses, as shown in Figure 9.
Figure 8 Groups of liquidity and capital intensity factors Source: author’s own editing based on the data of Opten Kft.
Figure 9 Relevant groups based on profitability, liquidity and capital intensity factor
Source: author’s own editing based on the data of Opten Kft.
With regard to the unity of liquidity, capital intensity and profitability, it is not possible to create substantive groups, therefore, after testing several aspects, the final combination can be established after several tests, which I could best interpret in terms of liquidity and capital intensity.
Figure 10 The relevant groups received are based on liquidity and capital intensity factor
Source: author’s own editing based on the data of Opten Kft.
1. Group 1 characteristics: high liquidity, low capital intensity. Long-term solvency is not ensured by the capital position, assets carry high losses, businesses can temporarily maintain their solvency, but at any given mo- ment, insolvency may arise as there is no adequate capital instability. With overdrafts offered by credit institutions, rescheduling of suppliers’ debts or just paying customers by date, it cannot be excluded that they sell their existing assets to maintain the company’s business, which included some 469 companies.
2. Group 2 features: standard liquidity and standard capital intensity. The most ideal businesses for banks. Not only current, but long-term solvency is also ensured. Businesses are liquid and dispensable at the same time.
Their performance is balanced, and their capital stability provides for the future as well. With these characteristics about 998 businesses can be char- acterized.
3. Group 3 features: low liquidity and weak capital intensity, bankruptcy it- self, fortunately it only affects 152 businesses. The assets and liabilities of enterprises are poorly structured, the assets are not able to finance the cost of resources, ineffective management, capital debt should be reduced, in- debtedness should be increased, equity capital should be increased, external capital investors and community funding can be counted as no bank loans shall be offered.
4. Group 4 features: low liquidity and high capital intensity. Businesses have developed a capital structure that may cause solvency problems, while sales revenue may not always be able to provide cash flow. Businesses strive for excessive stability, no risk, no revenue, and with these features 147 busi- nesses can be characterized.
Conclusion
For Hungary, the operation of the corporate sector and the efficiency of the op- eration are a key issue. Many research, analysis and analyses show that the most accessible CSO database can provide a wide variety of data on the role of the sector.
Over the last decades, the operation and ownership structure of enterprises has un- dergone a major transformation. Prior to the privatization and reprivatisation, the state enterprises and co-operatives were followed by thousands of privately owned enterprises. In the turn of the millennium, an entrepreneurial circle was found in employment, export and taxation, most of which belonged to SMEs in addi- tion to large corporations. Companies with domestic capital investment are often associated with multinational multinational companies that provide permanent orders to smaller and larger businesses, while requiring high-quality production and cost-effective operation. The European Union continues to support not only Hungarian enterprises, but also enterprises of other nations, pointing to the vital importance of the future operation and development of the sector. The operation of domestic enterprises is shown by the fact that 52-55% of registered enterprises were operational in the pre-crisis years, but this rate is rapidly decreasing with the onset of the crisis, until reaching a low of 35% for the 2013-2014 period, and finally, on the basis of available data, an improvement of 1% for the benefit of
working enterprises could be observed in 2015. In the coming years, encouraging entrepreneurship can be a promising expectation, showing a more realistic picture of the sector’s perception and the range of measures needed for other economic operators. The company is slowly becoming more transparent due to the changes in legislation in the meantime due to forced companies or companies that have had negative results for many years now. Data show that just under one third of registered businesses are operational, i.e. they pay taxes, employ people, and con- tribute to GDP.
The objective of my research is to analyse the financial situation of the domestic corporate sector by means of indicators, whose fields are:
- Perform a factor analysis by selecting 9 indicators, which resulted in the creation of three factors.
- Creating a cluster analysis based on 2015 data, resulting in four well-defined enterprise groups.
For the preliminary analysis, OPTEN Kft. provided the data with the help of the SPSS programme because of the size of the database: 184.170 enterprises with 10 years of data. From this business circle, firstly, the enterprises that had data necessary for the calculation of indicators for the objective index system were se- lected. I have found varied values for 10 years: in 2006, about 13561 enterprises were surveyed based on these indicators, 13680 in 2008, 11147 in 2008, 12022 in 2009, 11492 in 2010, 10943 in 2011, 10518 in 2012, 9925 in 2013, 9846 in 2014 and 9671 in 2015.
Regarding the liquidity of enterprises, based on statistical data duality is typical, values are excellent on the average, but this characteristic is not detectable in half of enterprises. During the factor analysis, groups of well-defined groups of liquid- ity and capital intensity could be formed. Creating and examining these groups is important to find out what measures can be taken to get businesses in at least the standard category, knowing the liquidity and capital positions of businesses.
70% of the non-performing loan portfolio is related to the SME sector, while the non-performing loan portfolio is only 23%. During the factor analysis, the com- panies under consideration are grouped according to liquidity and capital intensity into the following categories: Group 1: high liquidity and low capital intensity;
Group 2: standard liquidity and standard capital intensity; Group 3: low liquid- ity and weak capital intensity; Group 4: low liquidity and high capital intensity.
Companies in these groups showed real activity for 10 years based on the balance sheet and profit and loss account data. The nature of the activity of businesses can also influence what financial features they are having, and this is another way of
looking at how the activity can affect the place occupied in each cluster. It cannot be clearly stated that the items of Factor 3 will soon go bankrupt because they survived the crisis, but the fact that the CRR directives mandated by credit insti- tutions from 2013 do not help this group in lending.
References
Mitschele, A. (2014): DiskozionsbeitrÄge Bankmagement DHBW Stutt- gart-FakultÄt Wirtschaft ISSN 2199-6954 https://www.dhbw-stuttgart.de/fil- eadmin/dateien/.../Diskussionsbeiträge_Band2_
Bán E. – Csernák J. (2018): Controls and their Effects on Management Support in the Hungarian Sector Of Micro, Small and Medium Enterprises; Annals of the Polish Association of Agricultural and Agribusiness Economists 20:(1) pp.
17-23. ISSN: 1508-3535
Bene A. – Óhegyi K. – Csernák J. (2013): Competitiveness Analysis of the Food Processing SME-s in One of the most Disadvantaged EU Regions, INTER- NATIONAL JOURNAL OF BUSINESS AND MANAGEMENT STUDIES 5:(1) pp. 21−30. ISSN: 1309-8047
Gyulai L. (2013): A kis- és középvállalkozások üzleti finanszírozása, http://
www.tankonyvtar.hu/hu/tartalom/tamop412A/0007_d2_1080_1082_smeu- zletifin/1_1_a_finanszirozas_lenyege_fontosabb_formai_SNzjx9sSaMoQpD- Fp.html letöltve
Gyurcsik P.- Pataki L. (2016): A kkv szektor tőkehelyzetének elemzése, In: Árpási Z., Bodnár G., Gurzó I. (szerk.) A magyar gazdaság és társadalom a 21. század globalizálódó világában 1. kötet: „30 éves a békéscsabai felsőoktatás” jubileumi konferencia. 247 p. p. 154−162. ISBN:978-963-269-569-3
Lehota J. (2001): Marketingkutatás az agrárgazdaságban, Mezőgazda Kiadó ISBN9639358258, http://www.tankonyvtar.hu/hu/tartalom/tkt/marketingku- tatas/adatok.html
Steven, M. (2008): BWL für Ingenieure Oldenburg Verlag München 367 p. ISBN 978-3-486-58613-8 https://doi.org/10.1524/9783486595352
Pang-Ning Tan, Steinbach, M., Kumar, V. (2011): Bevezetés az adatbányászat- ba,978963545535PanemKft. http://www.tankonyvtar.hu/hu/tartalom/tam- op425/0046_adatbanyaszat/ch08s03.html
Sajtos L. – Mitev A. (2006): SPSS kutatási és adatelemzési kézikönyv. Alinea Kiadó, Budapest. 245−282. p. ISBN: 978-963-9659-08-7
Simon J. (2006): A klaszterelemzés alkalmazási lehetőségei a marketingkutatásban, Statisztikai Szemle, 84. évfolyam 7. szám 629.p.
Zsuzsanna Sz. (2016): Taxation of Research and Development JOURNAL OF ECONOMICS AND BUSINESS RESEARCH 22:(2) pp. 7−18.
Varga B., Szilágyi R. (2011): Kvantitatív információképzési technikák http://www.
tankonyvtar.hu/hu/tartalom/tamop425/0049_08_kvantitativ_informacio- kepzesi_technikak/1474/index.html 2017. 11. 11.
www.ksh.hu/statszemle_archive/2013/2013_11/2013_11_1072.pdf
http://hvg.hu/kkv/20131125_A_magyar_cegek_meg_nem_ertek_el_a_tinedzs 2017. 11. 10.
gtk.uni-miskolc.hu/files/126 2017. 11. 25.
https://www.mnb.hu/penzugyi-stabilitas/publikaciok-tanulmanyok/hiteleze- si-felmeres/hitelezesi-felmeres-2017-majus
Az Európai parlament és a Tanács 575/2013/EU rendelete (2013. június 26.) a hitelintézetekre és befektetési vállalkozásokra vonatkozó prudenciális követelményekről és a 648/2012/EU rendelet módosításáról
http://www.ksh.hu/gazdasagi_szervezetek_beruhazas http://statinfo.ksh.hu/Statinfo/haViewer.jsp
http://www.tankonyvtar.hu/hu/tartalom/tamop412A/0007_d2_1080_1082_
smeuzletifin/1_1_a_finanszirozas_lenyege_fontosabb_formai_SNzjx9sSaMo- QpDFp.htm
https://www.mnb.hu/sajtoszoba/sajtokozlemenyek/2016-evi-sajto-kozlemenyek /2017-marcius-31-en-zarul-a-novekedesi-hitelprogram,
Közlemény a Növekedési Hitelprogram harmadik szakasza keretében nyújtott hitelekről, 2017. április 4
https://www.mnb.hu/felugyelet/idosorok/i-penz-es-hitelpiaci-szervezetek http://www.statisticshowto.com/dendrogram/
Author
Dr. Aranka Baranyi PhD associate professor Eszterházy Károly University
Károly Róbert Campus Gyöngyös, Mátrai út. 36.
baranyi.aranka@uni-eszterhazy.hu