Methods for Predicting Behavior of Elephant Flows in Data Center Networks
Aymen Hasan Alawadi 1, Maiass Zaher 2, and Sándor Molnár 3
Methods for Predicting Behavior of Elephant Flows in Data Center Networks
Aymen Hasan Alawadi 1, Maiass Zaher 2, and Sándor Molnár 3
Abstract—Several Traffic Engineering (TE) techniques based on SDN (Software-defined networking) proposed to resolve flow competitions for network resources. However, there is no comprehensive study on the probability distribution of their throughput. Moreover, there is no study on predicting the future of elephant flows. To address these issues, we propose a new stochastic performance evaluation model to estimate the loss rate of two state-of-art flow scheduling algorithms including Equal- cost multi-path routing (ECMP), Hedera besides a flow congestion control algorithm which is Data Center TCP (DCTCP). Although these algorithms have theoretical and practical benefits, their effectiveness has not been statistically investigated and analyzed in conserving the elephant flows. Therefore, we conducted extensive experiments on the fat-tree data center network to examine the efficiency of the algorithms under different network circumstances based on Monte Carlo risk analysis. The results show that Hedera is still risky to be used to handle the elephant flows due to its unstable throughput achieved under stochastic network congestion. On the other hand, DCTCP found suffering under high load scenarios. These outcomes might apply to all data center applications, in particular, the applications that demand high stability and productivity.
Index Terms— Elephant flow, SDN, Risk analysis, Value-at- Risk, Flow scheduling, Congestion control.
I. INTRODUCTION
Nowadays, many enterprises leverage data center fabrics to manage highly-demanded bandwidth applications. Applications like Hadoop [1] and MapReduce [2] rely on hundreds or thousands of servers to provide high availability and scalability;
therefore large data is transferred through the data center network to achieve these requirements. However, other types of data center applications such as regular web services are hosted inside the data center as well, due to the guaranteed availability and reliability. Because of these substantial requirements, many data center topologies evolved like hyperx [3], flattened butterfly [4], and fat-tree [5]. On the other hand, many traffic management techniques emerged, like throughput-based forwarding and load balancing [6]. Typically, the applications of data center produce two types of flows which are mice and elephant flows [6]. Mice flows are known as the smallest and shortest-lived TCP flows in the network and more sensitive to the communication delay. Whereas the most massive and long- lived TCP flows, elephant flows, are more affected by the residual link bandwidth [6].
Department of Telecommunications and Media Informatics, Budapest University of Technology and Economics, Hungary, 1117 Budapest, Magyar Tudosok krt. 2.
1 aymen@tmit.bme.hu, 2 zaher@tmit.bme.hu,
3 molnar@tmit.bme.hu
The number of elephant flows in data centers is fewer than that of mice flows, but they carry the most, e.g., 80%, of the transferred data [7]. Some applications, like data mining, machine learning, and data analysis [8] [9] generate such flows since they demand intensive data transmission. These flows must be forwarded through appropriate routes following their requirements. Static forwarding techniques like ECMP [10]
could yield network congestions where bottlenecks would stem from collides on a specific switch port due to static hashing [11]
[12]. Hence, enhancing flow scheduling in data center networks would improve throughput and Flow Completion Time (FCT).
In today’s data centers, SDN plays a vital role in network resource allocation, traffic monitoring, and classification [14].
The paradigm has significantly employed by the research community for flow scheduling, and traffic load balancing [15]
[16] since the implementation of real-time applications is delicate without adequate resource and traffic management [2].
The standard design of a data center network includes multi- rooted trees that have multiple paths between every pair of hosts [12]. As a result, the challenge is to identify the suitable path for flows according to the current load of the paths and to avoid network congestion. However, most of the existing flow scheduling solutions like Hedera [12] forward both flow types on the same paths; hence, flow competitions and bottlenecks are inevitable [17]. Furthermore, rerouting the elephant flows might yield delay, packet reordering, and retransmission.
In this paper, we evaluate and predict the performance of ECMP, Hedera, and DCTCP. Particularly, we empirically investigate the performance and efficiency of the algorithms to answer the following questions:
1. What is the predicted loss rate of elephant flows using different algorithms?
2. What are the risk factors of implementing these algorithms regarding the elephant flow preserving?
3. How could the FCT and throughput of mice and elephant flows be under different algorithms?
Therefore, our main contributions are:
1. Implementing a wide range of workloads to estimate the probability distribution of the algorithms’ performance.
2. Conducting stochastic performance analysis instead of deterministic one to explore the minimum and maximum value of elephant flows loss rate.
3. Predicting the future performance of the different algorithms based on the stochastic evaluation and Abstract—Several Traffic Engineering (TE) techniques based
on SDN (Software-defined networking) proposed to resolve flow competitions for network resources. However, there is no comprehensive study on the probability distribution of their throughput. Moreover, there is no study on predicting the future of elephant flows. To address these issues, we propose a new stochastic performance evaluation model to estimate the loss rate of two state-of-art flow scheduling algorithms including Equal- cost multi-path routing (ECMP), Hedera besides a flow congestion control algorithm which is Data Center TCP (DCTCP).
Although these algorithms have theoretical and practical benefits, their effectiveness has not been statistically investigated and analyzed in conserving the elephant flows. Therefore, we conducted extensive experiments on the fat-tree data center network to examine the efficiency of the algorithms under different network circumstances based on Monte Carlo risk analysis. The results show that Hedera is still risky to be used to handle the elephant flows due to its unstable throughput achieved under stochastic network congestion. On the other hand, DCTCP found suffering under high load scenarios. These outcomes might apply to all data center applications, in particular, the applications that demand high stability and productivity.
Index Terms— Elephant flow, SDN, Risk analysis, Value-at- Risk, Flow scheduling, Congestion control.
Methods for Predicting Behavior of Elephant Flows in Data Center Networks
Aymen Hasan Alawadi 1, Maiass Zaher 2, and Sándor Molnár 3
Abstract—Several Traffic Engineering (TE) techniques based on SDN (Software-defined networking) proposed to resolve flow competitions for network resources. However, there is no comprehensive study on the probability distribution of their throughput. Moreover, there is no study on predicting the future of elephant flows. To address these issues, we propose a new stochastic performance evaluation model to estimate the loss rate of two state-of-art flow scheduling algorithms including Equal- cost multi-path routing (ECMP), Hedera besides a flow congestion control algorithm which is Data Center TCP (DCTCP). Although these algorithms have theoretical and practical benefits, their effectiveness has not been statistically investigated and analyzed in conserving the elephant flows. Therefore, we conducted extensive experiments on the fat-tree data center network to examine the efficiency of the algorithms under different network circumstances based on Monte Carlo risk analysis. The results show that Hedera is still risky to be used to handle the elephant flows due to its unstable throughput achieved under stochastic network congestion. On the other hand, DCTCP found suffering under high load scenarios. These outcomes might apply to all data center applications, in particular, the applications that demand high stability and productivity.
Index Terms— Elephant flow, SDN, Risk analysis, Value-at- Risk, Flow scheduling, Congestion control.
I. INTRODUCTION
Nowadays, many enterprises leverage data center fabrics to manage highly-demanded bandwidth applications. Applications like Hadoop [1] and MapReduce [2] rely on hundreds or thousands of servers to provide high availability and scalability;
therefore large data is transferred through the data center network to achieve these requirements. However, other types of data center applications such as regular web services are hosted inside the data center as well, due to the guaranteed availability and reliability. Because of these substantial requirements, many data center topologies evolved like hyperx [3], flattened butterfly [4], and fat-tree [5]. On the other hand, many traffic management techniques emerged, like throughput-based forwarding and load balancing [6]. Typically, the applications of data center produce two types of flows which are mice and elephant flows [6]. Mice flows are known as the smallest and shortest-lived TCP flows in the network and more sensitive to the communication delay. Whereas the most massive and long- lived TCP flows, elephant flows, are more affected by the residual link bandwidth [6].
Department of Telecommunications and Media Informatics, Budapest University of Technology and Economics, Hungary, 1117 Budapest, Magyar Tudosok krt. 2.
1 aymen@tmit.bme.hu, 2 zaher@tmit.bme.hu,
3 molnar@tmit.bme.hu
The number of elephant flows in data centers is fewer than that of mice flows, but they carry the most, e.g., 80%, of the transferred data [7]. Some applications, like data mining, machine learning, and data analysis [8] [9] generate such flows since they demand intensive data transmission. These flows must be forwarded through appropriate routes following their requirements. Static forwarding techniques like ECMP [10]
could yield network congestions where bottlenecks would stem from collides on a specific switch port due to static hashing [11]
[12]. Hence, enhancing flow scheduling in data center networks would improve throughput and Flow Completion Time (FCT).
In today’s data centers, SDN plays a vital role in network resource allocation, traffic monitoring, and classification [14].
The paradigm has significantly employed by the research community for flow scheduling, and traffic load balancing [15]
[16] since the implementation of real-time applications is delicate without adequate resource and traffic management [2].
The standard design of a data center network includes multi- rooted trees that have multiple paths between every pair of hosts [12]. As a result, the challenge is to identify the suitable path for flows according to the current load of the paths and to avoid network congestion. However, most of the existing flow scheduling solutions like Hedera [12] forward both flow types on the same paths; hence, flow competitions and bottlenecks are inevitable [17]. Furthermore, rerouting the elephant flows might yield delay, packet reordering, and retransmission.
In this paper, we evaluate and predict the performance of ECMP, Hedera, and DCTCP. Particularly, we empirically investigate the performance and efficiency of the algorithms to answer the following questions:
1. What is the predicted loss rate of elephant flows using different algorithms?
2. What are the risk factors of implementing these algorithms regarding the elephant flow preserving?
3. How could the FCT and throughput of mice and elephant flows be under different algorithms?
Therefore, our main contributions are:
1. Implementing a wide range of workloads to estimate the probability distribution of the algorithms’ performance.
2. Conducting stochastic performance analysis instead of deterministic one to explore the minimum and maximum value of elephant flows loss rate.
3. Predicting the future performance of the different algorithms based on the stochastic evaluation and
in Data Center Networks
SEPTEMBER 2019 • VOLUME XI • NUMBER 3 35
demonstrate their impact on data center applications in terms of the expected productivity.
The rest of the paper is organized as follows. In section II, we present related works. We describe the proposed model in section III. In section IV, we describe the simulations, results and, discussions. We finally conclude in Section V.
II. RELATED WORKS
Liu et al. [18] present a framework to enable adaptive multipath routing of elephant flows in data center networks under changing load conditions; however, this solution employs NOX controller which has some negative effects on the performance. Similar to Mahout [15], it detects elephant flows at end-hosts, but it monitors TCP socket buffer at end- host to mark flows exceed a predefined threshold so that elephant flows are forwarded based on a weighted multipath routing algorithm which results in installing better paths in switches. Besides, like Hedera, mice flows are delivered based on ECMP by default. However, it employs link load as the only metric for rerouting decisions. Devoflow [19]
provides a flow control mechanism in data center networks by rerouting elephant flows whose sizes are more significant than 1 MB.
Similarly, authors in [20] employ group feature of OpenFlow to implement a framework for managing the routes in data center networks by checking links load so that the framework distributes flows among different paths to balance the loads. This framework provides no distinguishing between elephant and mice flows, but when the congestion occurs on a link, the framework selects a backup flow with most considerable traffic demand, which means in practice most probably it will be an elephant flow, but it does not provide any measurements about the impact on mice flows. Wang et al. in [21] present TSACO, which detects elephant flows by OpenFlow and sFlow then forwards them according to an adaptive multi-path algorithm and handles mice flows differently. TSACO computes the available bandwidth and delay of paths and splits an elephant flow over multiple paths, which have considerably enough free bandwidth to balance the load whereas it sends mice flows on the remaining computed flows whose delay characteristics are suitable. As a result, TSACO provides better throughput for elephant flows, and shorter delay for mice flows in comparison with ECMP and weighted ECMP.
III. EXPERIMENTALMETHODOLOGY In this section, we describe our experimental methodology, including our system setup, network setup, and applications workloads employed in our empirical study.
A. System setup
K-4 fat-tree data center topology was built by using Mininet 2.2.2 SDN emulator installed on Ubuntu 16.04 machine provided with Intel Core i5-8400 CPU 2.80 GHz with 16 GB of RAM.
B. Flow scheduling algorithms
1. Hedera: estimates the demand for elephant flows then reroute them to a path with sufficient bandwidth by installing new flow entries on the switches.
Particularly, flows will be forwarded through one of the equal-cost paths by applying a static hashing based technique as in ECMP until they grow beyond the predefined threshold which is 10% of the link capacity [12].
2. Equal-Cost Multi-Path (ECMP): switches are statically configured with several forwarding paths for different subnets. The forwarding is based on the hash value of specific fields of packets header modulo the number of paths for spreading the load across many paths [10].
3. DCTCP: employs Explicit Congestion Notification (ECN) to estimate the fraction of bytes that encounter congestion rather than directly detecting that congestion has occurred. Then, DCTCP scales the size of the TCP congestion window accordingly. This method provides low latency and high throughput with shallow-buffered switches where they can be used in large data centers to reduce the capital expenditure. In typical DCTCP deployments, the marking threshold in the switches is set to a deficient value to reduce queueing delay, and a relatively small amount of congestion will cause the marking. During the blockage, DCTCP will use the fraction of marked packets to reduce the size of the congestion window more gradually than that in case of conventional TCP [22].
DCTCP and Hedera algorithms are implemented and tested as SDN applications by using Ryu controller whereas, ECMP is implemented statically in switches.
C. Collecting and normalizing the data
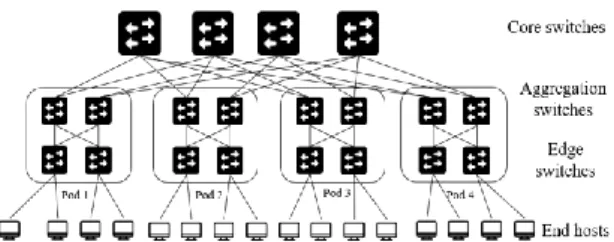
In this section, we present the conducted experiment to evaluate the results of the proposed evaluation model. In this paper, fat-tree topology is used since it is considered one of the essential topologies for building efficient, scalable, and cost- effective data centers. Fat-tree topology constructed from three main layers of connected switches located in core, aggregate, and edge layers. However, K-4 fat-tree data center topology has been built in Mininet with 10 Mbps links for each as shown in Figure 1.
Fig. 1 K-4 fat-tree data center.
demonstrate their impact on data center applications in terms of the expected productivity.
The rest of the paper is organized as follows. In section II, we present related works. We describe the proposed model in section III. In section IV, we describe the simulations, results and, discussions. We finally conclude in Section V.
II. RELATED WORKS
Liu et al. [18] present a framework to enable adaptive multipath routing of elephant flows in data center networks under changing load conditions; however, this solution employs NOX controller which has some negative effects on the performance. Similar to Mahout [15], it detects elephant flows at end-hosts, but it monitors TCP socket buffer at end- host to mark flows exceed a predefined threshold so that elephant flows are forwarded based on a weighted multipath routing algorithm which results in installing better paths in switches. Besides, like Hedera, mice flows are delivered based on ECMP by default. However, it employs link load as the only metric for rerouting decisions. Devoflow [19]
provides a flow control mechanism in data center networks by rerouting elephant flows whose sizes are more significant than 1 MB.
Similarly, authors in [20] employ group feature of OpenFlow to implement a framework for managing the routes in data center networks by checking links load so that the framework distributes flows among different paths to balance the loads. This framework provides no distinguishing between elephant and mice flows, but when the congestion occurs on a link, the framework selects a backup flow with most considerable traffic demand, which means in practice most probably it will be an elephant flow, but it does not provide any measurements about the impact on mice flows. Wang et al. in [21] present TSACO, which detects elephant flows by OpenFlow and sFlow then forwards them according to an adaptive multi-path algorithm and handles mice flows differently. TSACO computes the available bandwidth and delay of paths and splits an elephant flow over multiple paths, which have considerably enough free bandwidth to balance the load whereas it sends mice flows on the remaining computed flows whose delay characteristics are suitable. As a result, TSACO provides better throughput for elephant flows, and shorter delay for mice flows in comparison with ECMP and weighted ECMP.
III. EXPERIMENTALMETHODOLOGY In this section, we describe our experimental methodology, including our system setup, network setup, and applications workloads employed in our empirical study.
A. System setup
K-4 fat-tree data center topology was built by using Mininet 2.2.2 SDN emulator installed on Ubuntu 16.04 machine provided with Intel Core i5-8400 CPU 2.80 GHz with 16 GB of RAM.
B. Flow scheduling algorithms
1. Hedera: estimates the demand for elephant flows then reroute them to a path with sufficient bandwidth by installing new flow entries on the switches.
Particularly, flows will be forwarded through one of the equal-cost paths by applying a static hashing based technique as in ECMP until they grow beyond the predefined threshold which is 10% of the link capacity [12].
2. Equal-Cost Multi-Path (ECMP): switches are statically configured with several forwarding paths for different subnets. The forwarding is based on the hash value of specific fields of packets header modulo the number of paths for spreading the load across many paths [10].
3. DCTCP: employs Explicit Congestion Notification (ECN) to estimate the fraction of bytes that encounter congestion rather than directly detecting that congestion has occurred. Then, DCTCP scales the size of the TCP congestion window accordingly. This method provides low latency and high throughput with shallow-buffered switches where they can be used in large data centers to reduce the capital expenditure. In typical DCTCP deployments, the marking threshold in the switches is set to a deficient value to reduce queueing delay, and a relatively small amount of congestion will cause the marking. During the blockage, DCTCP will use the fraction of marked packets to reduce the size of the congestion window more gradually than that in case of conventional TCP [22].
DCTCP and Hedera algorithms are implemented and tested as SDN applications by using Ryu controller whereas, ECMP is implemented statically in switches.
C. Collecting and normalizing the data
In this section, we present the conducted experiment to evaluate the results of the proposed evaluation model. In this paper, fat-tree topology is used since it is considered one of the essential topologies for building efficient, scalable, and cost- effective data centers. Fat-tree topology constructed from three main layers of connected switches located in core, aggregate, and edge layers. However, K-4 fat-tree data center topology has been built in Mininet with 10 Mbps links for each as shown in Figure 1.
Fig. 1 K-4 fat-tree data center.
The conducted scenarios have two patterns; the first one generates connections that span all topology layers while the second one generates connections span the switches in edge and aggregation layers only as depicted in Figure 2. In these patterns, all of the end hosts in each rack employed to generate the traffic for each of the proposed scenario. To generate the required elephant and mice flows, we employed iperf for generating elephant flows, whereas the traffic of mice flows was generated by requesting specific files whose sizes are 10 Kbyte by applying an Apache server repeatedly in a random fashion as reported in [7].
However, the performance of the proposed model will be evaluated under high load scenarios where the mice flows are synchronized with the elephant flows to introduce congestion in the network. The evaluation process includes three different scenarios with different workloads, a mix of elephant and mice flows, whose time span are varied from 1 to 15 seconds in case of elephant flows to evaluate the investigated algorithms with different sizes of elephant flows. In the first scenario, 1:1 ratio, we generated 120 concurrent connections, so mice and elephant flows have an equal proportion, e.g., 60:60, respectively. In the second scenario, the 1:2 ratio, where we increased the number of the elephant flows to 80, and reduced mice flows to 40.
Finally, in the third scenario, 2:1 ratio, where we have 40 elephant flows to 80 mice flows. However, each scenario has been executed twenty-five times, and during each repetition, the throughput has been measured between hosts 1 and 16 by creating a 20 seconds connection using iperf to reflect the impact of different algorithms on the throughput of a specific elephant flow, and we built our risk analysis based on it. To obtain the risk factor of the error in throughput measurements, we utilized the arithmetic sample standard deviation. The maximum value of the calculated standard deviation is considered since it indicates a more significant value than the sample mean for the worst-case evaluation.
D. Goodness of fit
The goodness of fit test performed to find the proper probability distribution functions of the throughputs and errors.
Therefore, we adopted EasyFit professional [23], which is a specialized statistical tool to test the collected data. Since the collected data is in the discrete domain, we chose to use the Kolmogorov Smirnov statistic test (KS) as a hypothesis test to assess the distribution of the data [24]. KS test is a non- parametric test mainly used to compare the distance between the empirical data samples and a specific class of well-known reference probability distributions as in equation 1 [25].
𝐷𝐷𝑛𝑛 = sup
𝑥𝑥 |𝐹𝐹𝑛𝑛(𝑥𝑥) − 𝐹𝐹(𝑥𝑥)| (1) Where 𝐹𝐹𝑛𝑛 is the cumulative distribution function of the observed samples in comparison with the reference distribution functions 𝐹𝐹 of an ordered data.
A null hypothesis testing has been performed to accomplish this kind of testing, where H0 is identified when the tested data specify the distribution, and H1 is recognized when the data does not follow the distribution. To come up with the desired distribution, KS assumes a significance level α (0.01, 0.05, etc.) and compares the tested statistics (𝐷𝐷𝑛𝑛) with some of the critical values of the well-known distribution. The hypothesis of the measured distribution will be discarded if the value of 𝐷𝐷𝑛𝑛 exceeds the critical value at a significant level.
P-value based on the KS test helps to identify the level when the null hypothesis is rejected. This value indicates a threshold for the significant level (H0) to accept all values less than the P- value. For instance, when the P-value = 0.025, the null hypothesis will take all the significance levels less than the P- value, i.e., 0.01 and 0.02, and reject the higher levels [26].
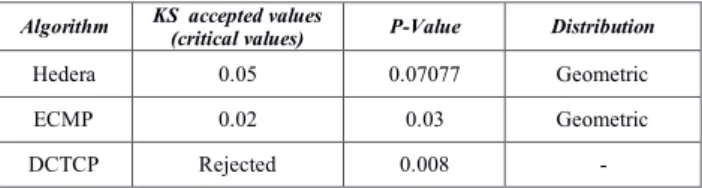
Table 1 shows the results of conducting KS null hypothesis testing on the throughput measurements of the algorithms. The throughput of both Hedera and ECMP followed the Geometric distribution (G-D) based on P-value, and the acceptable critical value was 0.02. However, G-D is recognized as a discrete probability distribution that represents the probability of the success number of independent trials, i.e., Bernoulli trials [27].
TABLEI.KSTESTVALUESFORTHEAVAILABLETHROUGHOUT.
Algorithm KS accepted values
(critical values) P-Value Distribution
Hedera 0.05 0.07077 Geometric
ECMP 0.02 0.03 Geometric
DCTCP Rejected 0.008 -
We got rejection as a result of DCTCP distribution testing for all of the significance levels, as appeared in Table 1.
Therefore, we used another normality test called the Anderson- Darling (AD) test. However, the AD test followed the null hypothesis testing and defined as A2.
A2 = — N — S (2) Where S:
𝑆𝑆 = ∑𝑁𝑁𝑖𝑖=1(2𝑖𝑖—1)𝑁𝑁 [ln𝐹𝐹(𝑌𝑌𝑖𝑖) + ln(1— 𝐹𝐹(𝑌𝑌𝑁𝑁+ 1 − ⅈ))] (3) Where 𝐹𝐹 is the cumulative distribution function of the observed samples and 𝑌𝑌𝑖𝑖 are the ordered data.
The testing shows that the throughput of DCTCP followed G-D with an acceptable critical value equals 0.02. Hence, we utilized probability mass function of G-D to generate samples required for Monte Carlo simulation model by applying equation 4 where Hedera, ECMP, and DCTCP have different probability values.
𝑃𝑃𝑟𝑟(𝐴𝐴) = (1 − 𝑝𝑝)𝑟𝑟−1𝑝𝑝 (4) Fig. 2 The traffic pattern.
The conducted scenarios have two patterns; the first one generates connections that span all topology layers while the second one generates connections span the switches in edge and aggregation layers only as depicted in Figure 2. In these patterns, all of the end hosts in each rack employed to generate the traffic for each of the proposed scenario. To generate the required elephant and mice flows, we employed iperf for generating elephant flows, whereas the traffic of mice flows was generated by requesting specific files whose sizes are 10 Kbyte by applying an Apache server repeatedly in a random fashion as reported in [7].
However, the performance of the proposed model will be evaluated under high load scenarios where the mice flows are synchronized with the elephant flows to introduce congestion in the network. The evaluation process includes three different scenarios with different workloads, a mix of elephant and mice flows, whose time span are varied from 1 to 15 seconds in case of elephant flows to evaluate the investigated algorithms with different sizes of elephant flows. In the first scenario, 1:1 ratio, we generated 120 concurrent connections, so mice and elephant flows have an equal proportion, e.g., 60:60, respectively. In the second scenario, the 1:2 ratio, where we increased the number of the elephant flows to 80, and reduced mice flows to 40.
Finally, in the third scenario, 2:1 ratio, where we have 40 elephant flows to 80 mice flows. However, each scenario has been executed twenty-five times, and during each repetition, the throughput has been measured between hosts 1 and 16 by creating a 20 seconds connection using iperf to reflect the impact of different algorithms on the throughput of a specific elephant flow, and we built our risk analysis based on it. To obtain the risk factor of the error in throughput measurements, we utilized the arithmetic sample standard deviation. The maximum value of the calculated standard deviation is considered since it indicates a more significant value than the sample mean for the worst-case evaluation.
D. Goodness of fit
The goodness of fit test performed to find the proper probability distribution functions of the throughputs and errors.
Therefore, we adopted EasyFit professional [23], which is a specialized statistical tool to test the collected data. Since the collected data is in the discrete domain, we chose to use the Kolmogorov Smirnov statistic test (KS) as a hypothesis test to assess the distribution of the data [24]. KS test is a non- parametric test mainly used to compare the distance between the empirical data samples and a specific class of well-known reference probability distributions as in equation 1 [25].
𝐷𝐷𝑛𝑛 = sup
𝑥𝑥 |𝐹𝐹𝑛𝑛(𝑥𝑥) − 𝐹𝐹(𝑥𝑥)| (1) Where 𝐹𝐹𝑛𝑛 is the cumulative distribution function of the observed samples in comparison with the reference distribution functions 𝐹𝐹 of an ordered data.
A null hypothesis testing has been performed to accomplish this kind of testing, where H0 is identified when the tested data specify the distribution, and H1 is recognized when the data does not follow the distribution. To come up with the desired distribution, KS assumes a significance level α (0.01, 0.05, etc.) and compares the tested statistics (𝐷𝐷𝑛𝑛) with some of the critical values of the well-known distribution. The hypothesis of the measured distribution will be discarded if the value of 𝐷𝐷𝑛𝑛 exceeds the critical value at a significant level.
P-value based on the KS test helps to identify the level when the null hypothesis is rejected. This value indicates a threshold for the significant level (H0) to accept all values less than the P- value. For instance, when the P-value = 0.025, the null hypothesis will take all the significance levels less than the P- value, i.e., 0.01 and 0.02, and reject the higher levels [26].
Table 1 shows the results of conducting KS null hypothesis testing on the throughput measurements of the algorithms. The throughput of both Hedera and ECMP followed the Geometric distribution (G-D) based on P-value, and the acceptable critical value was 0.02. However, G-D is recognized as a discrete probability distribution that represents the probability of the success number of independent trials, i.e., Bernoulli trials [27].
TABLEI.KSTESTVALUESFORTHEAVAILABLETHROUGHOUT.
Algorithm KS accepted values
(critical values) P-Value Distribution
Hedera 0.05 0.07077 Geometric
ECMP 0.02 0.03 Geometric
DCTCP Rejected 0.008 -
We got rejection as a result of DCTCP distribution testing for all of the significance levels, as appeared in Table 1.
Therefore, we used another normality test called the Anderson- Darling (AD) test. However, the AD test followed the null hypothesis testing and defined as A2.
A2 = — N — S (2) Where S:
𝑆𝑆 = ∑𝑁𝑁𝑖𝑖=1(2𝑖𝑖—1)𝑁𝑁 [ln𝐹𝐹(𝑌𝑌𝑖𝑖) + ln(1— 𝐹𝐹(𝑌𝑌𝑁𝑁+ 1 − ⅈ))] (3) Where 𝐹𝐹 is the cumulative distribution function of the observed samples and 𝑌𝑌𝑖𝑖 are the ordered data.
The testing shows that the throughput of DCTCP followed G-D with an acceptable critical value equals 0.02. Hence, we utilized probability mass function of G-D to generate samples required for Monte Carlo simulation model by applying equation 4 where Hedera, ECMP, and DCTCP have different probability values.
𝑃𝑃𝑟𝑟(𝐴𝐴) = (1 − 𝑝𝑝)𝑟𝑟−1𝑝𝑝 (4) Fig. 2 The traffic pattern.
The conducted scenarios have two patterns; the first one generates connections that span all topology layers while the second one generates connections span the switches in edge and aggregation layers only as depicted in Figure 2. In these patterns, all of the end hosts in each rack employed to generate the traffic for each of the proposed scenario. To generate the required elephant and mice flows, we employed iperf for generating elephant flows, whereas the traffic of mice flows was generated by requesting specific files whose sizes are 10 Kbyte by applying an Apache server repeatedly in a random fashion as reported in [7].
However, the performance of the proposed model will be evaluated under high load scenarios where the mice flows are synchronized with the elephant flows to introduce congestion in the network. The evaluation process includes three different scenarios with different workloads, a mix of elephant and mice flows, whose time span are varied from 1 to 15 seconds in case of elephant flows to evaluate the investigated algorithms with different sizes of elephant flows. In the first scenario, 1:1 ratio, we generated 120 concurrent connections, so mice and elephant flows have an equal proportion, e.g., 60:60, respectively. In the second scenario, the 1:2 ratio, where we increased the number of the elephant flows to 80, and reduced mice flows to 40.
Finally, in the third scenario, 2:1 ratio, where we have 40 elephant flows to 80 mice flows. However, each scenario has been executed twenty-five times, and during each repetition, the throughput has been measured between hosts 1 and 16 by creating a 20 seconds connection using iperf to reflect the impact of different algorithms on the throughput of a specific elephant flow, and we built our risk analysis based on it. To obtain the risk factor of the error in throughput measurements, we utilized the arithmetic sample standard deviation. The maximum value of the calculated standard deviation is considered since it indicates a more significant value than the sample mean for the worst-case evaluation.
D. Goodness of fit
The goodness of fit test performed to find the proper probability distribution functions of the throughputs and errors.
Therefore, we adopted EasyFit professional [23], which is a specialized statistical tool to test the collected data. Since the collected data is in the discrete domain, we chose to use the Kolmogorov Smirnov statistic test (KS) as a hypothesis test to assess the distribution of the data [24]. KS test is a non- parametric test mainly used to compare the distance between the empirical data samples and a specific class of well-known reference probability distributions as in equation 1 [25].
𝐷𝐷𝑛𝑛= sup
𝑥𝑥 |𝐹𝐹𝑛𝑛(𝑥𝑥) − 𝐹𝐹(𝑥𝑥)| (1) Where 𝐹𝐹𝑛𝑛 is the cumulative distribution function of the observed samples in comparison with the reference distribution functions 𝐹𝐹 of an ordered data.
A null hypothesis testing has been performed to accomplish this kind of testing, where H0 is identified when the tested data specify the distribution, and H1 is recognized when the data does not follow the distribution. To come up with the desired distribution, KS assumes a significance level α (0.01, 0.05, etc.) and compares the tested statistics (𝐷𝐷𝑛𝑛) with some of the critical values of the well-known distribution. The hypothesis of the measured distribution will be discarded if the value of 𝐷𝐷𝑛𝑛 exceeds the critical value at a significant level.
P-value based on the KS test helps to identify the level when the null hypothesis is rejected. This value indicates a threshold for the significant level (H0) to accept all values less than the P- value. For instance, when the P-value = 0.025, the null hypothesis will take all the significance levels less than the P- value, i.e., 0.01 and 0.02, and reject the higher levels [26].
Table 1 shows the results of conducting KS null hypothesis testing on the throughput measurements of the algorithms. The throughput of both Hedera and ECMP followed the Geometric distribution (G-D) based on P-value, and the acceptable critical value was 0.02. However, G-D is recognized as a discrete probability distribution that represents the probability of the success number of independent trials, i.e., Bernoulli trials [27].
TABLEI.KSTESTVALUESFORTHEAVAILABLETHROUGHOUT.
Algorithm KS accepted values
(critical values) P-Value Distribution
Hedera 0.05 0.07077 Geometric
ECMP 0.02 0.03 Geometric
DCTCP Rejected 0.008 -
We got rejection as a result of DCTCP distribution testing for all of the significance levels, as appeared in Table 1.
Therefore, we used another normality test called the Anderson- Darling (AD) test. However, the AD test followed the null hypothesis testing and defined as A2.
A2 = — N — S (2) Where S:
𝑆𝑆 = ∑𝑁𝑁𝑖𝑖=1(2𝑖𝑖—1)𝑁𝑁 [ln𝐹𝐹(𝑌𝑌𝑖𝑖) + ln(1— 𝐹𝐹(𝑌𝑌𝑁𝑁+ 1 − ⅈ))] (3) Where 𝐹𝐹 is the cumulative distribution function of the observed samples and 𝑌𝑌𝑖𝑖 are the ordered data.
The testing shows that the throughput of DCTCP followed G-D with an acceptable critical value equals 0.02. Hence, we utilized probability mass function of G-D to generate samples required for Monte Carlo simulation model by applying equation 4 where Hedera, ECMP, and DCTCP have different probability values.
𝑃𝑃𝑟𝑟(𝐴𝐴) = (1 − 𝑝𝑝)𝑟𝑟−1𝑝𝑝 (4) Fig. 2 The traffic pattern.
The conducted scenarios have two patterns; the first one generates connections that span all topology layers while the second one generates connections span the switches in edge and aggregation layers only as depicted in Figure 2. In these patterns, all of the end hosts in each rack employed to generate the traffic for each of the proposed scenario. To generate the required elephant and mice flows, we employed iperf for generating elephant flows, whereas the traffic of mice flows was generated by requesting specific files whose sizes are 10 Kbyte by applying an Apache server repeatedly in a random fashion as reported in [7].
However, the performance of the proposed model will be evaluated under high load scenarios where the mice flows are synchronized with the elephant flows to introduce congestion in the network. The evaluation process includes three different scenarios with different workloads, a mix of elephant and mice flows, whose time span are varied from 1 to 15 seconds in case of elephant flows to evaluate the investigated algorithms with different sizes of elephant flows. In the first scenario, 1:1 ratio, we generated 120 concurrent connections, so mice and elephant flows have an equal proportion, e.g., 60:60, respectively. In the second scenario, the 1:2 ratio, where we increased the number of the elephant flows to 80, and reduced mice flows to 40.
Finally, in the third scenario, 2:1 ratio, where we have 40 elephant flows to 80 mice flows. However, each scenario has been executed twenty-five times, and during each repetition, the throughput has been measured between hosts 1 and 16 by creating a 20 seconds connection using iperf to reflect the impact of different algorithms on the throughput of a specific elephant flow, and we built our risk analysis based on it. To obtain the risk factor of the error in throughput measurements, we utilized the arithmetic sample standard deviation. The maximum value of the calculated standard deviation is considered since it indicates a more significant value than the sample mean for the worst-case evaluation.
D. Goodness of fit
The goodness of fit test performed to find the proper probability distribution functions of the throughputs and errors.
Therefore, we adopted EasyFit professional [23], which is a specialized statistical tool to test the collected data. Since the collected data is in the discrete domain, we chose to use the Kolmogorov Smirnov statistic test (KS) as a hypothesis test to assess the distribution of the data [24]. KS test is a non- parametric test mainly used to compare the distance between the empirical data samples and a specific class of well-known reference probability distributions as in equation 1 [25].
𝐷𝐷𝑛𝑛 = sup
𝑥𝑥 |𝐹𝐹𝑛𝑛(𝑥𝑥) − 𝐹𝐹(𝑥𝑥)| (1) Where 𝐹𝐹𝑛𝑛 is the cumulative distribution function of the observed samples in comparison with the reference distribution functions 𝐹𝐹 of an ordered data.
A null hypothesis testing has been performed to accomplish this kind of testing, where H0 is identified when the tested data specify the distribution, and H1 is recognized when the data does not follow the distribution. To come up with the desired distribution, KS assumes a significance level α (0.01, 0.05, etc.) and compares the tested statistics (𝐷𝐷𝑛𝑛) with some of the critical values of the well-known distribution. The hypothesis of the measured distribution will be discarded if the value of 𝐷𝐷𝑛𝑛 exceeds the critical value at a significant level.
P-value based on the KS test helps to identify the level when the null hypothesis is rejected. This value indicates a threshold for the significant level (H0) to accept all values less than the P- value. For instance, when the P-value = 0.025, the null hypothesis will take all the significance levels less than the P- value, i.e., 0.01 and 0.02, and reject the higher levels [26].
Table 1 shows the results of conducting KS null hypothesis testing on the throughput measurements of the algorithms. The throughput of both Hedera and ECMP followed the Geometric distribution (G-D) based on P-value, and the acceptable critical value was 0.02. However, G-D is recognized as a discrete probability distribution that represents the probability of the success number of independent trials, i.e., Bernoulli trials [27].
TABLEI.KSTESTVALUESFORTHEAVAILABLETHROUGHOUT.
Algorithm KS accepted values
(critical values) P-Value Distribution
Hedera 0.05 0.07077 Geometric
ECMP 0.02 0.03 Geometric
DCTCP Rejected 0.008 -
We got rejection as a result of DCTCP distribution testing for all of the significance levels, as appeared in Table 1.
Therefore, we used another normality test called the Anderson- Darling (AD) test. However, the AD test followed the null hypothesis testing and defined as A2.
A2 = — N — S (2) Where S:
𝑆𝑆 = ∑𝑁𝑁𝑖𝑖=1(2𝑖𝑖—1)𝑁𝑁 [ln𝐹𝐹(𝑌𝑌𝑖𝑖) + ln(1— 𝐹𝐹(𝑌𝑌𝑁𝑁+ 1 − ⅈ))] (3) Where 𝐹𝐹 is the cumulative distribution function of the observed samples and 𝑌𝑌𝑖𝑖 are the ordered data.
The testing shows that the throughput of DCTCP followed G-D with an acceptable critical value equals 0.02. Hence, we utilized probability mass function of G-D to generate samples required for Monte Carlo simulation model by applying equation 4 where Hedera, ECMP, and DCTCP have different probability values.
𝑃𝑃𝑟𝑟(𝐴𝐴) = (1 − 𝑝𝑝)𝑟𝑟−1𝑝𝑝 (4) Fig. 2 The traffic pattern.