Reducing operational costs of ultra-reliable low latency services in 5G
J. Varga is with NOKIA, Budapest, Hungary. E-mail: jozsef.varga@nokia.com.
A. Hilt is with NOKIA, Budapest, Hungary. E-mail: attila.hilt@nokia.com.
J. Bíró is with NOKIA, Budapest, Hungary. E-mail: jozsef.biro@nokia.com.
Cs. Rotter is with NOKIA, Budapest, Hungary. E-mail: csaba.rotter@nokia.com.
G. Járó is with NOKIA, Budapest, Hungary. E-mail: gabor.jaro@nokia.com.
INFOCOMMUNICATIONS JOURNAL
INFOCOMMUNICATIONS JOURNAL, MANUSCRIPT ID 1
Reducing operational costs of ultra-reliable low latency services in 5G
József Varga, Attila Hilt, József Bíró, Csaba Rotter, and Gábor Járó
Abstract— Ultra-reliable low latency (uRLL) communication in 5G dictates the deployment of distributed infrastructure with numerous datacenters for low latency, while hosting ultra-reliable services mandates attended datacenters. This would boost the operational costs of 5G network operators planning country-wide coverage for uRLL services. This paper examines how these operational expenses dominated by administrative costs can be reduced without impacting the quality of the provided uRLL service. Our results indicate that hosting uRLL services in unattended datacenters with increased hardware redundancy schemes can produce significant cost savings.
Index Terms— 5G, availability, low latency, redundancy, total cost of ownership, cloud, datacenter
—————————— ——————————
1 I
NTRODUCTIONLTRA-reliable low latency (uRLL) communication in- troduces stringent requirements for 5G systems [1], [2], [3]. A recent cost study [4] shows that provisioning uRLL services can represent significant part of complete 5G deployments. This is triggered by the demanding ser- vice requirements: (i) for ultra-reliability the standard so- lution is to deploy Tier-4 attended datacenters [5], [6]; (ii) for low latency these datacenters must be placed either at the edge or close to the edge of the core network.
3GPP has an ongoing study on enhancements for the support of uRLL communication [7]. This study only sets recommendations for the future normative specification work and assumes that the 5G system defined in [8] will be used as a baseline architecture for uRLL communication.
Even though the detailed architecture specification for uRLL communication is still ongoing, for the deployments the general 5G system deployment assumptions are valid:
it will utilize technologies like software defined network- ing and network function virtualization. Furthermore, due to the stringent latency requirements we can assume that application functions supporting uRLL services are not only hosted by the same infrastructure as the 5G core sys- tem but are co-located or even combined with 5G network functions.
In this paper, we examine how the costs of uRLL service deployments can be reduced. The paper is structured as follows: section 2 discusses how the latency requirements of uRLL services enforce the introduction of costly distrib- uted deployment using coverage for Hungary as an exam- ple, and lists potential cost reduction options; section 3 deals with the possible unattended operation of datacen- ters hosting only low traffic volume of uRLL services [9];
section 4 presents the potential cost saving results com- pared to the costs of standard operation described in [4];
finally, section 5 concludes the paper.
2 C
OSTS OFD
EPLOYMENT FOR URLL S
ERVICESThe best-known example for uRLL services is the vehicle- to-everything (V2X) communication, including use cases like cooperative driving maneuvers (e.g. platooning), basic safety message, and see-through-system [10]. In densely populated countries the density of road system mandates nation-wide coverage. We use Hungary as an example to demonstrate how the uRLL service requirements are con- sidered in planning the serving infrastructure.
2.1 Infrastructure for uRLL Services
The end-to-end (E2E) latency requirements for V2X use cases available in the related literature and publications range from 3.3 millisecond (ms) [10], sub 10 ms [11], to 10- 15 ms [2]. Independently of the actual value selected for E2E latency budget, it is further divided to elements like:
service request processing at end user application, trans- mitting and receiving data at air interface, forwarding data in wired core network (fiber-optic), switching in packet data network, and optionally request handling in a server, see Fig.1. The use of these elements depends on what enti- ties the uRLL service requires the network to connect: (i) a
xxxx-xxxx/0x/$xx.00 © 200x IEEE Published by the IEEE Computer Society
————————————————
J. Varga is with NOKIA, Budapest, Hungary. E-mail:
jozsef.varga@nokia.com.
A. Hilt is with NOKIA, Budapest, Hungary. E-mail: attila.hilt@nokia.com.
J. Bíró is with NOKIA, Budapest, Hungary. E-mail: jozsef.biro@nokia.com.
Cs. Rotter is with NOKIA, Budapest, Hungary. E-mail: csaba.rot- ter@nokia.com.
G. Járó is with NOKIA, Budapest, Hungary. E-mail: gabor.jaro@nokia.com.
U
Fig. 1. Latency elements in 5G network.
Reducing operational costs of ultra-reliable low latency services in 5G
József Varga, Attila Hilt, József Bíró, Csaba Rotter, and Gábor Járó Abstract— Ultra-reliable low latency (uRLL) communication
in 5G dictates the deployment of distributed infrastructure with numerous datacenters for low latency, while hosting ultra-reli- able services mandates attended datacenters. This would boost the operational costs of 5G network operators planning coun- try-wide coverage for uRLL services. This paper examines how these operational expenses dominated by administrative costs can be reduced without impacting the quality of the provided uRLL service. Our results indicate that hosting uRLL services in unattended datacenters with increased hardware redundancy schemes can produce significant cost savings.
Index Terms—G, availability, low latency, redundancy, total cost of ownership, cloud, datacenter
I. INTRODUCTION
U
LTRA-reliable low latency (uRLL) communication in- troduces stringent requirements for 5G systems [1], [2], [3]. A recent cost study [4] shows that provisioning uRLL services can represent significant part of complete 5G de- ployments. This is triggered by the demanding service re- quirements: (i) for ultra-reliability the standard solution is to deploy Tier-4 attended datacenters [5], [6]; (ii) for low la- tency these datacenters must be placed either at the edge or close to the edge of the core network.3GPP has an ongoing study on enhancements for the sup- port of uRLL communication [7]. This study only sets rec- ommendations for the future normative specification work and assumes that the 5G system defined in [8] will be used as a baseline architecture for uRLL communication. Even though the detailed architecture specification for uRLL com- munication is still ongoing, for the deployments the general 5G system deployment assumptions are valid: it will utilize technologies like software defined networking and network function virtualization. Furthermore, due to the stringent la- tency requirements we can assume that application functions supporting uRLL services are not only hosted by the same infrastructure as the 5G core system but are co-located or even combined with 5G network functions.
In this paper, we examine how the costs of uRLL service deployments can be reduced. The paper is structured as fol- lows: section 2 discusses how the latency requirements of
uRLL services enforce the introduction of costly distributed deployment using coverage for Hungary as an example, and lists potential cost reduction options; section 3 deals with the possible unattended operation of datacenters hosting only low traffic volume of uRLL services [9]; section 4 presents the potential cost saving results compared to the costs of standard operation described in [4]; finally, section 5 con- cludes the paper.
II. COSTS OF DEPLOYMENT FOR URLL SERVICES The best-known example for uRLL services is the vehicle- to-everything (V2X) communication, including use cases like cooperative driving maneuvers (e.g. platooning), basic safety message, and see-through-system [10]. In densely populated countries the density of road system mandates nation-wide coverage. We use Hungary as an example to demonstrate how the uRLL service requirements are considered in plan- ning the serving infrastructure.
II. 1 Infrastructure for uRLL Services
The end-to-end (E2E) latency requirements for V2X use cases available in the related literature and publications range from 3.3 millisecond (ms) [10], sub 10 ms [11], to 10-15 ms [2]. Independently of the actual value selected for E2E la- tency budget, it is further divided to elements like: service request processing at end user application, transmitting and receiving data at air interface, forwarding data in wired core network (fiber-optic), switching in packet data network, and optionally request handling in a server, see Fig.1. The use of these elements depends on what entities the uRLL service requires the network to connect: (i) a user to a server, (ii) two users using the network infrastructure, or (iii) users through a server.
Fig. 1. Latency elements in 5G network.
DOI: 10.36244/ICJ.2018.4.6
Reducing operational costs of ultra-reliable low latency services in 5G
INFOCOMMUNICATIONS JOURNAL
2 INFOCOMMUNICATIONS JOURNAL, MANUSCRIPT ID
user to a server, (ii) two users using the network infrastruc- ture, or (iii) users through a server.
The infrastructure serving the uRLL service is deter- mined by the latency budget assigned for data forwarding in fiber-optic: as an example, if no time is assigned, then the uRLL service must be provided by mobile edge com- puting; while if 1 ms is assigned, then it allows data for- warding as far as 200 km in fiber-optic cable length. This
"cable length budget" determines how the datacenters serving uRLL communications (for simplicity we use the term "low latency datacenter", LL DC in short) must be lo- cated to provide nation-wide coverage. For the user- server-user scenario the E2E communication includes two
"data forwarding in fiber-optic" elements and to avoid fur- ther splitting of the "cable length budget", we assume that for a specific uRLL communication session at a specific time all network functions are hosted in one LL DC, and as the server processing time is also strongly limited, we can also assume that all network functions are combined for uRLL communication. Note that the evaluation part of [7]
suggests that servers needs to be kept geographically and topologically close to the user equipment, "within a trans- mission latency of 0.1 ms to 1 ms from the radio base sta- tion site".
Also, if the LL DCs are placed to serve the user-server- user scenario, then the resulting setup can appropriately serve the less demanding user-server scenario as well.
The "cable length budget" determines the area covered by a LL DC, although for exact calculations the actual to- pology of the aggregation network is needed. For general calculations we estimate these areas as circles drawn around the potential locations of LL DCs. For this, we as- sume that the fiber-optic cable length connecting two points is usually 2-3 times longer than the geographical distance of those points.
As an example, Fig. 2 shows three options for LL DC placement in Hungary with different latency and cable length multiplier (mL) assumptions (copyright note: the population density map of Hungary is based on [12]).
Note that this circle-based coverage is only an estimate.
In real-life deployments for uRLL services the locations of LL DCs must be designed based on the real cable lengths in the aggregation network.
In our model we did not aim to find coverage with min- imal number of LL DCs, or full coverage, we just tried to place data centers to bigger cities wherever it was possible.
Table 1 lists the estimated number of LL DCs needed to provide a country-wide coverage with three combinations of the latency and the cable length multiplier parameter values.
Option 2a assigns 2 ms latency from the E2E latency budget for data forwarding in fiber-optic (allowing 400 km cable length E2E) and mL = 2 as a multiplier for geograph- ical distance to fiber-optic cable length. Keeping the user- server-user V2X use cases in mind, this translates to a 100 km coverage radius for LL DCs. Note that the 2 ms latency budget for forwarding data in fiber-optic is most probably too generous.
Option 2b takes 1.5 ms latency and mL = 2.5 length mul- tiplier as parameters, resulting in a 60 km coverage radius.
For comparison, cost calculations in [4] use a 72 km cover- age radius.
Option 2c takes 1 ms latency for data forwarding in fi- ber-optic and mL = 3 as a geographical distance to optical cable length multiplier, resulting in a 33 km coverage ra- dius for LL DCs.
Fig. 2 and Table 1 illustrate well that the number of LL DCs required to provide nation-wide coverage increases quickly as the latency requirements become harsher. The relation in our model coverage with circles around LL DCs is quite clear: the covered area is a quadratic function of the coverage radius. Even though with smaller coverage ra- dius the nation-wide coverage is achievable with less over- lap among the coverage areas of LL DCs, and the coverage areas can follow better the country boundaries, still any de- crease in the "cable length budget" will result a quadratic increase in the number of LL DCs for a country-wide cov- erage.
Fig. 2. LL DCs for Hungary with 100 / 60 / 33 km coverage radii.
TABLE1
ESTIMATES FOR NATION-WIDE COVERAGE WITH LLDCS
VARGA ET AL.: REDUCING OPERATIONAL COSTS OF ULTRA-RELIABLE LOW LATENCY SERVICES IN 5G 3
This statement is obviously valid for real deployments as well when the actual topology of the operator's aggre- gation network with real-life fiber-optic cable length is considered.
2.2 Cost Considerations
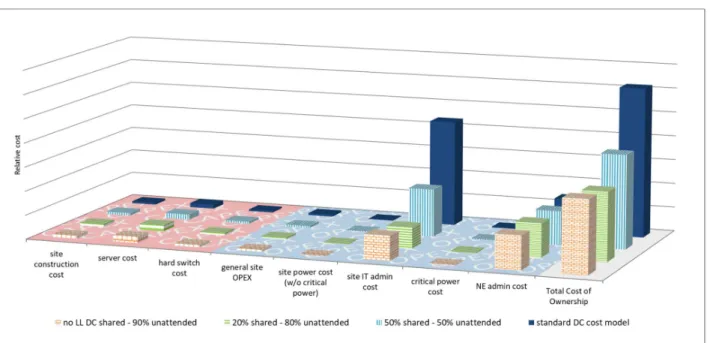
Results in [4] indicate that IT admin costs could be the most significant cost contributor of the planned 5G infrastruc- ture. IT admin costs are dominated by the 24/7 on-site sup- port required for all LL DCs, see Fig. 3 that compares the monthly infrastructure costs of the main 5G use case groups: in addition to the uRLL services, the massive ma- chine type communication – mMTC, evolved mobile broadband – eMBB, and ultra-dense high broadband ser- vice – uHBS. Note that those calculations use the standard cost calculations for datacenters [13], the IT admin costs are boosted by the fact that even for LL DCs covering rural ar- eas with low traffic volumes (and thus hosting only tens of servers) the employment of 5 IT administrators is required:
40 working hours (minus vacations and sick leaves) per week to cover 168 hours a week.
In this work we focus on the IT admin cost reduction possibilities and leave other assumptions of [4] unchanged.
For the 5G architecture it is assumed that (i) virtualization technologies [14] are used in all datacenters (including LL DCs), (ii) hard switches provide connectivity in the DC and may implement some services, e.g. user plane gateways, if they are SDN enabled [15], (iii) no other specialized hard- ware are deployed.
The obvious IT admin cost reduction possibility for LL DCs is to host additional services and share the IT admin costs with those services. Note that the intra-operator dat- acenter sharing possibilities are already considered in [4].
For example, datacenters hosting services like massive ma- chine type communication and evolved mobile broadband on a national level, are also used as LL DC. In our example we can assume that the LL DC for the capital area is co- located with the datacenter hosting national level services, and thus the IT admin costs for uRLL services are already shared in that datacenter.
However, IT admin cost sharing may not be viable
option for most LL DCs. As shown in our example, for op- tion 2a it is possible to place most of LL DCs into bigger cities (population of 100,000+ in case of Hungary, obvi- ously this depends on the population density and the level of urbanization of the country considered), but switching to the more realistic datacenter coverage options, for op- tion 2b it is still possible to place all LL DCs into cities (again this statement is country dependent), but for the majority of the LL DCs these are already smaller cities and it is not expected to have significant demand for database capacities (i.e. no sharing). Finally, for option 2c approxi- mately 80% of the LL DCs are placed at rural areas. Note that the ratio of LL DCs in rural areas are even worse for big countries, as the country level road length is signifi- cantly higher).
Another IT admin cost reduction option is to host the uRLL services in 3rd party datacenters that meet the ultra- reliability requirements. However, this option has the same limitation as sharing. Furthermore, if the 3rd party datacenter is not close enough to the operator's aggrega- tion network, the extra routing further limits the available time in the E2E latency budget.
The third option is the unattended operation of datacen- ters hosting uRLL services only. To ensure that the reliabil- ity requirements are still met, this must be compensated by deploying additional redundant hardware. In section 3 we examine the feasibility of this option.
3 U
NATTENDEDD
ATACENTERS FOR URLL S
ERVICESWe will examine how the lack of on-site IT support affects the service availability in LL DC and how it can be com- pensated by additional redundant hardware in LL DCs.
Obviously, high service reliability and high service availability are not equivalent terms. However, maintain- ing the same high service availability with high mean up- time values and keeping the same serviceability at the same time guarantee unchanged high reliability. For ser- viceability, the software in LL DCs is maintained remotely as virtualization technologies include centralized
Fig. 3. Monthly total cost of ownership (TCO) of infrastructure for 5G use case groups [4].
The infrastructure serving the uRLL service is deter- mined by the latency budget assigned for data forwarding in fiber-optic: as an example, if no time is assigned, then the uRLL service must be provided by mobile edge computing;
while if 1 ms is assigned, then it allows data forwarding as far as 200 km in fiber-optic cable length. This “cable length budget” determines how the datacenters serving uRLL com- munications (for simplicity we use the term “low latency da- tacenter”, LL DC in short) must be located to provide nation- wide coverage. For the user-server-user scenario the E2E communication includes two “data forwarding in fiber-optic”
elements and to avoid further splitting of the “cable length budget”, we assume that for a specific uRLL communication session at a specific time all network functions are hosted in one LL DC, and as the server processing time is also strongly limited, we can also assume that all network functions are combined for uRLL communication. Note that the evaluation part of [7] suggests that servers needs to be kept geographi- cally and topologically close to the user equipment, “within a transmission latency of 0.1 ms to 1 ms from the radio base station site”.
Also, if the LL DCs are placed to serve the user-server- user scenario, then the resulting setup can appropriately serve the less demanding user-server scenario as well.
The “cable length budget” determines the area covered by a LL DC, although for exact calculations the actual topology of the aggregation network is needed. For general calcula- tions we estimate these areas as circles drawn around the potential locations of LL DCs. For this, we assume that the fiber-optic cable length connecting two points is usually 2-3 times longer than the geographical distance of those points.
As an example, Fig. 2 shows three options for LL DC placement in Hungary with different latency and cable length multiplier (mL) assumptions (copyright note: the population density map of Hungary is based on [12]).
Note that this circle-based coverage is only an estimate. In real-life deployments for uRLL services the locations of LL DCs must be designed based on the real cable lengths in the aggregation network.
In our model we did not aim to find coverage with min- imal number of LL DCs, or full coverage, we just tried to place data centers to bigger cities wherever it was possible.
Table 1 lists the estimated number of LL DCs needed to pro- vide a country-wide coverage with three combinations of the latency and the cable length multiplier parameter values.
Option 2a assigns 2 ms latency from the E2E latency budget for data forwarding in fiber-optic (allowing 400 km cable length E2E) and mL = 2 as a multiplier for geograph- ical distance to fiber-optic cable length. Keeping the user- server-user V2X use cases in mind, this translates to a 100 km coverage radius for LL DCs. Note that the 2 ms latency budget for forwarding data in fiber-optic is most probably too generous.
Option 2b takes 1.5 ms latency and mL = 2.5 length mul- tiplier as parameters, resulting in a 60 km coverage radius.
For comparison, cost calculations in [4] use a 72 km cover- age radius.
Option 2c takes 1 ms latency for data forwarding in fi- ber-optic and mL = 3 as a geographical distance to optical cable length multiplier, resulting in a 33 km coverage radius for LL DCs.
Fig. 2 and Table 1 illustrate well that the number of LL DCs required to provide nation-wide coverage increases quickly as the latency requirements become harsher. The re- lation in our model coverage with circles around LL DCs is quite clear: the covered area is a quadratic function of the coverage radius. Even though with smaller coverage radius the nationwide coverage is achievable with less overlap among the coverage areas of LL DCs, and the coverage areas can follow better the country boundaries, still any decrease in the “cable length budget” will result a quadratic increase in the number of LL DCs for a country-wide coverage.
Fig. 2. LL DCs for Hungary with 100 / 60 / 33 km coverage radii.
TABLE I
esTIMATes fOR nATIOn-WIDe cOVeRAGe WITH LL Dcs
Reducing operational costs of ultra-reliable low latency services in 5G INFOCOMMUNICATIONS JOURNAL
VARGA ET AL.: REDUCING OPERATIONAL COSTS OF ULTRA-RELIABLE LOW LATENCY SERVICES IN 5G 3
This statement is obviously valid for real deployments as well when the actual topology of the operator's aggre- gation network with real-life fiber-optic cable length is considered.
2.2 Cost Considerations
Results in [4] indicate that IT admin costs could be the most significant cost contributor of the planned 5G infrastruc- ture. IT admin costs are dominated by the 24/7 on-site sup- port required for all LL DCs, see Fig. 3 that compares the monthly infrastructure costs of the main 5G use case groups: in addition to the uRLL services, the massive ma- chine type communication – mMTC, evolved mobile broadband – eMBB, and ultra-dense high broadband ser- vice – uHBS. Note that those calculations use the standard cost calculations for datacenters [13], the IT admin costs are boosted by the fact that even for LL DCs covering rural ar- eas with low traffic volumes (and thus hosting only tens of servers) the employment of 5 IT administrators is required:
40 working hours (minus vacations and sick leaves) per week to cover 168 hours a week.
In this work we focus on the IT admin cost reduction possibilities and leave other assumptions of [4] unchanged.
For the 5G architecture it is assumed that (i) virtualization technologies [14] are used in all datacenters (including LL DCs), (ii) hard switches provide connectivity in the DC and may implement some services, e.g. user plane gateways, if they are SDN enabled [15], (iii) no other specialized hard- ware are deployed.
The obvious IT admin cost reduction possibility for LL DCs is to host additional services and share the IT admin costs with those services. Note that the intra-operator dat- acenter sharing possibilities are already considered in [4].
For example, datacenters hosting services like massive ma- chine type communication and evolved mobile broadband on a national level, are also used as LL DC. In our example we can assume that the LL DC for the capital area is co- located with the datacenter hosting national level services, and thus the IT admin costs for uRLL services are already shared in that datacenter.
However, IT admin cost sharing may not be viable
option for most LL DCs. As shown in our example, for op- tion 2a it is possible to place most of LL DCs into bigger cities (population of 100,000+ in case of Hungary, obvi- ously this depends on the population density and the level of urbanization of the country considered), but switching to the more realistic datacenter coverage options, for op- tion 2b it is still possible to place all LL DCs into cities (again this statement is country dependent), but for the majority of the LL DCs these are already smaller cities and it is not expected to have significant demand for database capacities (i.e. no sharing). Finally, for option 2c approxi- mately 80% of the LL DCs are placed at rural areas. Note that the ratio of LL DCs in rural areas are even worse for big countries, as the country level road length is signifi- cantly higher).
Another IT admin cost reduction option is to host the uRLL services in 3rd party datacenters that meet the ultra- reliability requirements. However, this option has the same limitation as sharing. Furthermore, if the 3rd party datacenter is not close enough to the operator's aggrega- tion network, the extra routing further limits the available time in the E2E latency budget.
The third option is the unattended operation of datacen- ters hosting uRLL services only. To ensure that the reliabil- ity requirements are still met, this must be compensated by deploying additional redundant hardware. In section 3 we examine the feasibility of this option.
3 U
NATTENDEDD
ATACENTERS FOR URLL S
ERVICESWe will examine how the lack of on-site IT support affects the service availability in LL DC and how it can be com- pensated by additional redundant hardware in LL DCs.
Obviously, high service reliability and high service availability are not equivalent terms. However, maintain- ing the same high service availability with high mean up- time values and keeping the same serviceability at the same time guarantee unchanged high reliability. For ser- viceability, the software in LL DCs is maintained remotely as virtualization technologies include centralized
Fig. 3. Monthly total cost of ownership (TCO) of infrastructure for 5G use case groups [4]. Fig. 3. Monthly total cost of ownership (TCO) of infrastructure for 5G use case groups [4].
This statement is obviously valid for real deployments as well when the actual topology of the operator’s aggregation network with real-life fiber-optic cable length is considered.
II. 2 Cost Considerations
Results in [4] indicate that IT admin costs could be the most significant cost contributor of the planned 5G infra- structure. IT admin costs are dominated by the 24/7 on-site support required for all LL DCs, see Fig. 3 that compares the monthly infrastructure costs of the main 5G use case groups:
in addition to the uRLL services, the massive machine type communication – mMTC, evolved mobile broadband – eMBB, and ultra-dense high broadband service – uHBS.
Note that those calculations use the standard cost calcula- tions for datacenters [13], the IT admin costs are boosted by the fact that even for LL DCs covering rural areas with low traffic volumes (and thus hosting only tens of servers) the employment of 5 IT administrators is required: 40 working hours (minus vacations and sick leaves) per week to cover 168 hours a week.
In this work we focus on the IT admin cost reduction pos- sibilities and leave other assumptions of [4] unchanged. For the 5G architecture it is assumed that (i) virtualization tech- nologies [14] are used in all datacenters (including LL DCs), (ii) hard switches provide connectivity in the DC and may implement some services, e.g. user plane gateways, if they are SDN enabled [15], (iii) no other specialized hardware are deployed.
The obvious IT admin cost reduction possibility for LL DCs is to host additional services and share the IT admin costs with those services. Note that the intra-operator dat- acenter sharing possibilities are already considered in [4].
For example, datacenters hosting services like massive ma- chine type communication and evolved mobile broadband on a national level, are also used as LL DC. In our example we can assume that the LL DC for the capital area is colocated with the datacenter hosting national level services, and thus the IT admin costs for uRLL services are already shared in that datacenter.
However, IT admin cost sharing may not be viable option for most LL DCs. As shown in our example, for option 2a it is possible to place most of LL DCs into bigger cities (population of 100,000+ in case of Hungary, obviously this depends on the population density and the level of urbanization of the country considered), but switching to the more realistic datacenter cov- erage options, for option 2b it is still possible to place all LL DCs into cities (again this statement is country dependent), but for the majority of the LL DCs these are already smaller cities and it is not expected to have significant demand for database capacities (i.e. no sharing). Finally, for option 2c approximately 80% of the LL DCs are placed at rural areas. Note that the ratio of LL DCs in rural areas are even worse for big countries, as the country level road length is significantly higher).
Another IT admin cost reduction option is to host the uRLL services in 3rd party datacenters that meet the ultrareliability requirements. However, this option has the same limitation as sharing. Furthermore, if the 3rd party datacenter is not close enough to the operator’s aggregation network, the extra rout- ing further limits the available time in the E2E latency budget.
The third option is the unattended operation of datacen- ters hosting uRLL services only. To ensure that the reliabil- ity requirements are still met, this must be compensated by deploying additional redundant hardware. In section 3 we examine the feasibility of this option.
III. UNATTENDED DATACENTERS FOR URLL SERVICES We will examine how the lack of on-site IT support affects the service availability in LL DC and how it can be compen- sated by additional redundant hardware in LL DCs.
Obviously, high service reliability and high service avail- ability are not equivalent terms. However, maintaining the same high service availability with high mean uptime values and keeping the same serviceability at the same time guarantee unchanged high reliability. For serviceability, the software in LL DCs is maintained remotely as virtualization technologies include centralized management and orchestration [14], while regular hardware maintenance can be provided without on-site IT administration as well.
Reducing operational costs of ultra-reliable low latency services in 5G
INFOCOMMUNICATIONS JOURNAL
4 INFOCOMMUNICATIONS JOURNAL, MANUSCRIPT ID
management and orchestration [14], while regular hard- ware maintenance can be provided without on-site IT ad- ministration as well.
3.1 Assumptions
The assumptions used for LL DCs operated without on-site IT admin support are:
those LL DC provide coverage for rural areas with low traffic volumes, thus the services are provided with minimal software configurations;
those LL DC hosts only uRLL services;
virtualization technologies [14] allow the remote management and configuration (automated and/or centralized) of software in those LL DCs;
the virtual network functions (VNFs) are deployed on commodity servers;
for hard switches and critical VNFs the 2N redun- dancy scheme is deployed;
for other network functions utilizing load sharing re- dundancy scheme is the most efficient option [16];
hard switches in LL DCs provide connectivity of the datacenter and may implement some services, e.g.
user plane gateways, if they are SDN enabled [15];
for best utilization of E2E latency budget the uRLL services are implemented in a single VNF (if any) and SDN based hard switches may implement user plane gateway functions.
3.2 Considered Availability Parameters
The components of service availability in a datacenter are:
software availability, hardware availability, datacenter in- frastructure availability, and network availability. The de- pendency of these components with a high-level descrip- tion is given in Fig. 4. The existence of on-site IT admin- istration has impact only on the availability of IT hardware units by minimizing the downtime of hardware units (commodity servers and hard switches for the considered LL DCs). Note that regular maintenance impacting DC availability is still provided.
The hardware availability for network functions imple- menting uRLL services in LL DCs depends on both the availability of single hardware units (commodity server or hard switch, or even network interface cards) hosting the network function and the redundancy scheme applied for these hardware units. To obtain generic results we consider a range of typical values for uptime and downtime of a sin- gle hardware unit.
2N means full redundancy. For one single unit (N=1) 2N means duplication, such avoiding single point of failure. In case of several parallel units (N>1), all units are spared. In the system N units are required to support the traffic, but 2N units are deployed to increase the availability of the system. In 2N redundant systems, the system is capable to run as long as N units are available. 3N redundancy adds, for each unit carrying the load, two spare units in parallel.
Please note, that the redundant units are not added to in- crease the system capacity: this way the system availability is improved. In 3N redundant systems, similarly to 2N re- dundancy, the system is capable to run as long as N units are available. “2 of 3” redundancy means that at least 2 units must operate from the total 3 units. Similarly, “2 of 4”
means that minimum 2 units must operate from the total amount of 4 units. In the general case, N working units are spared by K redundant units, usually referred as N+K. The redundant units are either working or they are in standby mode. In active/active mode all the N+K units are working, and they share the total load (load-sharing). When K units are in standby mode, depending on the speed of launching the standby units into operation, we can talk about hot, warm or cold-standby. For the system performing its de- sired function, from the total number of N+K units at least N must operate, or in other words maximum K units can fail. The different sparing methods are discussed in detail in [17] and it is shown that in distributed systems load sharing efficiently increases the overall system availability.
For the redundancy schemes, we check all variants that match our assumptions (minimal configurations both for full redundancy and for load sharing based solutions). The examined values are:
for the initial hardware redundancy scheme (i.e.
when attended operation of LL DC is assumed) 1+1, 2+2 and 2+1 (also known as 2 of 3) redundancy;
for uptime values, the mean time between failures (MTBF) parameter is used. The considered values are 200,000, 300,000, and 400,000 hours. Note that com- modity server and hard switch vendors do not pub- lish concrete values nowadays. Therefore, we adopted the typical values used by web pages and literature discussing availability, such as [18] and [19];
for downtime values, the mean time to repair (MTTR) parameter is used. The considered values are 10, 20, 30, 40, 60, and 90 minutes. The widely used MTTR estimate for classical DC environment is 60 minutes, but as for 5G we expect high level of auto- mation [20] including software management and configuration [14], our study focuses mostly on lower values.
3.3 Availability Calculation Details
For all combinations of the above parameters we first cal- culate the hardware availabilities with base redundancy schemes, then calculate the hardware availabilities using a more stringent redundancy scheme – obviously, receiving higher hardware availability values. Finally, we start to in- crease the MTTR value until the hardware availability with the more stringent redundancy scheme and increased Fig. 4. Main components for service availability in a datacenter.
VARGA ET AL.: REDUCING OPERATIONAL COSTS OF ULTRA-RELIABLE LOW LATENCY SERVICES IN 5G 5
MTTR drops back to the same value as with the base re- dundancy scheme and the initial MTTR value. The increase in MTTR provides the additional time for IT administra- tors to travel to LL DCs.
As an example, this calculation is illustrated in Fig. 5, with MTBF set to 400,000 hours, MTTR set to 10 minutes, and redundancy scheme for the network function imple- mentation of the uRLL service is assumed to be 2N redun- dancy. The base hardware availability for this case is A2N=99.9999999999826 %. Switching to 3N redundancy the hardware availability increases to an even higher value of A3N=99.9999999999999999927662127444 %.
Note that the above hardware availability numbers rep- resent 12 and 19 9's availability. Obviously, these numbers are just one component in the service availability, which is expected to remain in the typical range of telco services, i.e.
5 or 6 9's availability.
Continuing with the example, the hardware availability for the 3N redundant case drops to the value of the base 2N redundant setup when the MTTR is increased by 1330 minutes to 1340 minutes. That is if a uRLL service is imple- mented on a 2N redundant hardware in an attended LL DC (assuming 400,000 hours MTBF and 10 minutes MTTR), then implementing the same uRLL service on a 3N redun- dant hardware guarantees the same hardware availability even if MTTR is increased to 1340 minutes.
The formulas used for basic availability calculation of a single hardware unit and the hardware availability for im- plementations are listed here for information, the details are available in [4].
The generic availability is defined in (1), MUT and MDT representing the mean uptime and mean downtime of the system, respectively.
Availability = MUT/(MUT+MDT) (1)
The availability of a single hardware with the well- known function based on MTBF and MTTR, as specified in (2). Note that other definitions also exist in the literature [16], [19].
Asingle(MTBF, MTTR) = MTBF/(MTBF+MTTR) (2)
The hardware availability for the 2N redundancy scheme is calculated as in (3), while for the 3N redundancy scheme is calculated according to (4).
A2N(x, y) = 1-(1-Asingle(x, y))2 (3) A3N(x, y) = 1-(1-Asingle(x, y))3 (4)
Hardware availability for the "2 of 3" redundancy scheme is calculated according to (5), while for the "2 of 4" redundancy scheme it is calculated according to (6). A2/3(x, y) = 3Asingle(x, y)2-2Asingle(x, y)3 (5) A2/4(x, y) = 1-(4(1-Asingle(x, y))3-3(1-Asingle(x, y))4) (6) The "2 of 3" and "2 of 4" redundancy schemes are de- picted in Fig. 6. These schemes are regularly referred as
"2+1" and "2+2" as well. 3.4 Results
Previously we have explained our calculations for a spe- cific parameter set, here the results for all parameter com- binations are summarized:
single hardware availability values for all (MTBF, MTTR) combinations are in Table 2;
hardware availability values both for 2N and 2+1 (or
"2 of 3") redundancy schemes are well above the usual service availability values (more than ten 9's), so for better illustration we include the unavailability values for these cases: the unavailability values in Ta- ble 3 are for 2N redundancy scheme, while the Fig. 5. Base and increased hardware availability for MTBF=400,000
hours and MTTR = 10 minutes initial parameters.
Fig. 6. "2 of 3" and "2 of 4" redundant parallel systems.
TABLE2
SINGLE HARDWARE UNIT AVAILABILITIES FOR THE EXAMINED
MTBF,MTTRRANGE
TABLE3
HARDWARE UNAVAILABILITY WITH 2NREDUNDANCY SCHEME 99.999999999960%
99.999999999965% 99.999999999970% 99.999999999975% 99.999999999980% 99.999999999985% 99.999999999990% 99.999999999995% 100.000000000000%
0 80 160 240 320 400 480 560 640 720 800 880 960 1040 1120 1200 1280 1360 1440 1520 1600
Availability [%]
MTTR increase for the 3N redundancy case [minutes] 3N redundant hardware availability
2N redundant hardware availability
Fig. 4. Main components for service availability in a datacenter..
III. 1 Assumptions
The assumptions used for LL DCs operated without on-site IT admin support are:
• those LL DC provide coverage for rural areas with low traffic volumes, thus the services are provided with mini- mal software configurations;
• those LL DC hosts only uRLL services;
• virtualization technologies [14] allow the remote man- agement and configuration (automated and/or central- ized) of software in those LL DCs;
• the virtual network functions (VNFs) are deployed on commodity servers;
• for hard switches and critical VNFs the 2N redundancy scheme is deployed;
• for other network functions utilizing load sharing redun- dancy scheme is the most efficient option [16];
• hard switches in LL DCs provide connectivity of the datacenter and may implement some services, e.g. user plane gateways, if they are SDN enabled [15];
• for best utilization of E2E latency budget the uRLL serv- ices are implemented in a single VNF (if any) and SDN based hard switches may implement user plane gateway functions.
III. 2 Considered Availability Parameters
The components of service availability in a datacenter are:
software availability, hardware availability, datacenter infra- structure availability, and network availability. The dependen- cy of these components with a high-level description is given in Fig. 4. The existence of on-site IT administration has impact only on the availability of IT hardware units by minimizing the downtime of hardware units (commodity servers and hard switches for the considered LL DCs). Note that regular main- tenance impacting DC availability is still provided.
The hardware availability for network functions imple- ment- ing uRLL services in LL DCs depends on both the availability of single hardware units (commodity server or hard switch, or even network interface cards) hosting the network function and the redundancy scheme applied for these hardware units. To obtain generic results we consider a range of typical values for uptime and downtime of a single hardware unit.
2N means full redundancy. For one single unit (N=1) 2N means duplication, such avoiding single point of failure. In case of several parallel units (N>1), all units are spared. In
the system N units are required to support the traffic, but 2N units are deployed to increase the availability of the system.
In 2N redundant systems, the system is capable to run as long as N units are available. 3N redundancy adds, for each unit carrying the load, two spare units in parallel. Please note, that the redundant units are not added to increase the system capacity: this way the system availability is improved. In 3N redundant systems, similarly to 2N redundancy, the system is capable to run as long as N units are available. “2 of 3”
redundancy means that at least 2 units must operate from the total 3 units. Similarly, “2 of 4” means that minimum 2 units must operate from the total amount of 4 units. In the general case, N working units are spared by K redundant units, usu- ally referred as N+K. The redundant units are either working or they are in standby mode. In active/active mode all the N+K units are working, and they share the total load (load- sharing). When K units are in standby mode, depending on the speed of launching the standby units into operation, we can talk about hot, warm or cold-standby. For the system per- forming its desired function, from the total number of N+K units at least N must operate, or in other words maximum K units can fail. The different sparing methods are discussed in detail in [17] and it is shown that in distributed systems load sharing efficiently increases the overall system availability.
For the redundancy schemes, we check all variants that match our assumptions (minimal configurations both for full redundancy and for load sharing based solutions). The exam- ined values are:
• for the initial hardware redundancy scheme (i.e. when attended operation of LL DC is assumed) 1+1, 2+2 and 2+1 (also known as 2 of 3) redundancy;
• for uptime values, the mean time between failures (MTBF) parameter is used. The considered values are 200,000, 300,000, and 400,000 hours. Note that com- modity server and hard switch vendors do not publish concrete values nowadays. Therefore, we adopted the typical values used by web pages and literature discuss- ing availability, such as [18] and [19];
• for downtime values, the mean time to repair (MTTR) parameter is used. The considered values are 10, 20, 30, 40, 60, and 90 minutes. The widely used MTTR estimate for classical DC environment is 60 minutes, but as for 5G we expect high level of automation [20] including software management and configuration [14], our study focuses mostly on lower values.
III. 3 Availability Calculatiuon Details
For all combinations of the above parameters we first cal- culate the hardware availabilities with base redundancy schemes, then calculate the hardware availabilities using a more stringent redundancy scheme – obviously, receiving higher hardware availability values. Finally, we start to in- crease the MTTR value until the hardware availability with the more stringent redundancy scheme and increased Fig. 5.
Base and increased hardware availability for MTBF=400,000 hours and MTTR = 10 minutes initial parameters.
MTTR drops back to the same value as with the base re- dundancy scheme and the initial MTTR value. The increase
•

![Fig. 3. Monthly total cost of ownership (TCO) of infrastructure for 5G use case groups [4]](https://thumb-eu.123doks.com/thumbv2/9dokorg/1431546.121876/3.871.92.747.804.1066/fig-monthly-total-cost-ownership-tco-infrastructure-groups.webp)