Introduction
The crop production sector represents about 60 percent of total agricultural output in Hungary (Eurostat, 2020).
There are more than 234,000 farms and, based on their main activity, two thirds of them are mainly engaged in crop production (KSH, 2020). The major specialisation is arable crop production, and the dominant arable crops are wheat, maize, barley, sunflower and rapeseed. The area of arable land is about 4 million hectares, representing 4 percent of the EU-27 arable land (Eurostat, 2020). Hungarian crop farming is mainly characterised by many small farms and a few very large farms in terms of size in hectares (KSH, 2020).
Hungarian agriculture is heavily exposed to the impact of extreme weather events and climate change due to the pre- ponderance of crop production. Extreme weather events have become much more common in recent years. For example, in the Carpathian Region in the period 1961-2010, heatwaves became not only more frequent, but also longer, more severe and intense, in particular in summer in the Hungarian Great Plain (Spinoni et al., 2015). In certain parts of Hungary, the number of heatwave days has increased by more than two weeks since 1981 (OMSZ, 2015). Similarly, the frequency of heatwaves has increased across much of Europe (IPCC, 2014).
Changes in precipitation patterns are also observable in Hungary. Annual precipitation has decreased by 5.6 percent between 1901 and 2014, and the reduced precipitation falls in a more intensive pattern which decreases its potential utilisation and increases the frequency of extreme rainfall events. The annual number of rainy days has decreased by 15 days since 1901 (OMSZ, 2015). The increasing number of heatwave days and decreasing number of rainy days raise the likelihood of longer drought periods.
Drought and hail are the most frequent types of crop damage in Hungary and can pose even greater risks to agri-
cultural production in the future. Thus, strategies for adapt- ing to increased weather and climatic risk and for mitigating the potential financial implications are becoming increas- ingly important. To help alleviate the financial risk related to increased weather and climatic risk, a damage mitigation system (DMS) has been provided by the Hungarian govern- ment since 2007 (Kemény and Varga, 2010).
Assessment of the possible impacts of extreme weather events is an important part of farmers’ risk management strategies. Farmers can use several methods to deal with increased weather risk. Firstly, crop insurance can play an important role in mitigating the financial impacts of climate change (Falco et al., 2014). Secondly, improving technical efficiency to make more efficient use of natural resources can contribute to adaptation to climate change.
Improving technical efficiency is important because of the limited availability of natural resources, such as water and land. Thirdly, investment in agricultural production can also contribute to dealing with the challenges posed by cli- mate change. According to Collier et al. (2009), farmers’
risk assessments can identify adaptation strategies which can be managed through investments, such as irrigation and modified cropping systems.
Although all three factors can mitigate climate related impacts on crop production, to the author’s knowledge, the interrelationships between crop insurance take-up, techni- cal efficiency and farm investment have not been studied to date. Baráth et al. (2017) investigated the relationship between crop insurance demand and economic performance measured by farm profit margin and total factor productivity.
However, no study to date has, to the author’s knowledge, evaluated the effect of technical efficiency on insurance demand. Furthermore, the effects of insurance usage and technical efficiency on farm investment also have not been examined to date.
Anna ZUBOR-NEMES*,**
The relationship between crop insurance take-up, technical efficiency, and investment in Hungarian farming
Climate change is putting increasing pressure on agriculture, which might be reduced by paying more attention to risk manage- ment, production efficiency and farm investment. This paper describes the interrelationship between crop insurance take-up, technical efficiency and investment in Hungarian farming using a system of simultaneous equations. The empirical analysis is based on farm accountancy data for the period 2001-2019. Results suggest that both technical efficiency and investment have positive and significant effects on insurance take-up. Accordingly, higher technical efficiency and a higher investment rate both lead to increased insurance usage. In terms of its relationship with efficiency, insurance has a positive and significant coefficient, but investment does not have a significant influence on technical efficiency. Where investment is concerned, insur- ance usage has a positive and significant effect, but the role of technical efficiency is insignificant. Results suggest that policy interventions that stimulate any of the three factors can potentially have additional positive impacts through spill-over effects on other factors. These effects could be further enhanced if, for instance, interventions focusing primarily on insurance take-up also pay attention to investment by differentiating insurance premium subsidies, depending on whether there is an ongoing (or operating) investment that can be linked to weather-related risk management.
Keywords: risk management, farm performance, system of simultaneous equations, Data Envelopment Analysis.
JEL classifications: G22, L25, Q12
* Institute of Agricultural Economics Nonprofit Kft. (AKI), Zsil utca 3-5., 1093 Budapest, Hungary.
** Department of Agribusiness, Corvinus University of Budapest, Fővám tér 8., 1093 Budapest, Hungary.Corresponding author: nemes.anna@aki.gov.hu Received: 12 October 2021, Revised: 15 November 2021, Accepted: 17 November 2021.
The main objective of this paper is therefore to investigate the interrelationships between crop insurance usage, techni- cal efficiency and investments in Hungary over a period of nearly twenty years (between 2001 and 2019). By studying the determining factors of farmers’ behaviour, policy rec- ommendations on how the crop insurance market can be improved can be made. In addition, such interrelationships may mean that policy interventions also lead to increased technical efficiency and encourage investment.
The paper is structured as follows. The next section pre- sents a literature review, followed by a description of the methodology and data. The results are then presented, fol- lowed by the exploration of the new insights gained from the analysis. Finally, these insights are used to formulate some policy recommendations and draw some general conclusions.
Literature review
In order to examine the interrelationships between the three factors in farmers’ risk management strategies prop- erly, other drivers of farmers’ behaviour towards these fac- tors also need to be considered. Therefore, an overview of the determining factors follows.
Crop insurance take-up
Several studies show that larger farms are more likely to insure their crops (Baráth et al., 2017; Enjolras and Sen- tis, 2011; Sherrick et al., 2004). According to Sherrick et al.
(2004) and Finger and Lehmann (2012), insurance users tend to be older, more experienced and better educated. Crop diver- sification has an impact on insurance demand, although there are mixed arguments concerning the effect of diversification (non-concentration). On the one hand, Falco et al. (2014) and Goodwin (1993) found that crop diversification could be a substitute for crop insurance. On the other hand, Mishra et al.
(2004) suggested that a risk-averse farmer diversifying his/her production also took out insurance to reduce risk.
The intensity of direct input use (seeds, fertilisers, pes- ticides, etc.) is a proxy for production intensity, which also may affect insurance usage. Serra et al. (2003) found that the application of chemical inputs reduced the expected return from crop insurance, consequently the farmer is less likely to take out crop insurance. This is in line with the result of Smith and Goodwin (1996) showing that producers who pur- chase crop insurance use fewer agrochemicals. In contrast, Möhring et al. (2020) found a positive relationship between crop insurance and pesticide use in European agriculture.
Finger and Lehmann (2012) and Goodwin and Smith (2013) found evidence of the effect of subsidies on insurance use. While there are targeted incentives to adopt crop insur- ance, such as insurance premium support, direct payments may also influence insurance usage. Finger and Lehmann (2012) found that direct payments reduce farmers’ insurance take-up.
They pointed out that this relationship between premium sup- port and direct payments highlighted contradictory influences of agricultural policy measures. Therefore, this current study examines the effect of total amount of subsidy (except invest- ment subsidy), taking also account other financial support.
Among other determining factors, intuitively, insurance history can be a good proxy of willingness to pay for insurance and the average of the previous three years of insurance usage can be used as the measure of willingness to adopt crop insur- ance. Lefebvre et al. (2014) found that the farmers intending to invest are more likely to have positive attitudes towards inno- vation and to follow good farm management practices, such as having agricultural insurance. Baráth et al. (2017) provided empirical evidence that economic performance, measured by farm profit margin (PM) and total factor productivity (TFP), had a positive impact on farm insurance demand.
Technical efficiency
Latruffe et al. (2004) and Bojnec and Fertő (2013) showed that larger farms are more technically efficient than smaller ones. Dessale (2019) and Nowak et al. (2016) found that the age of farm managers had a positive effect on techni- cal efficiency, which they said could be explained by older farmers possessing greater farming experience. According to Dessale (2019), technical efficiency is positively correlated with education, because more educated farmers have the ability to use information from various sources more effec- tively and are able to apply new farming technologies that would increase outputs.
In terms of production diversification, a more special- ised (concentrated) farm may be more efficient as there is no competition for land between activities and farmers can focus their management efforts (Bojnec and Latruffe, 2009).
However, Lazíková et al. (2019) found that production diversity positively affected technical efficiency.
Subsidies can increase technical efficiency if they pro- vide the necessary financial means to keep technologies up to date or to invest in efficiency improvement (Zhu and Lan- sink, 2010). On the other hand, subsidies can serve to reduce farmers’ effort and consequently reduce their technical effi- ciency (Bojnec and Latruffe, 2009). Bojnec and Latruffe (2009) and Zhu and Lansink (2010) also found that total sub- sidies had a negative impact on technical efficiency. Accord- ing to Pawłowski et al. (2021), investments are a basic way to increase efficiency. However, they emphasised that not every investment leads to increased efficiency, owing to the phenomenon of overinvestment.
Investment
The extent of investment is influenced by several fac- tors. Investment history affects the subsequent investments, namely, farmers who invested recently are more likely to intend to invest again (Lefebvre et al., 2014). Larger farms are also more likely to invest (Lefebvre et al., 2014; Niavis et al., 2020). Farmers’ characteristics, such as age and educa- tion can also have an impact on investment decisions. The results of Niavis et al. (2020) suggested that the relation- ship between farmers’ age and their investment behaviour was not linear, instead one may observe phases in the life of farmer with different rates of investment. According to Wiel- iczko et al. (2019), education can have a negative impact on investment due to the non-agricultural work undertaken by these farmers which discourages agricultural investment.
Fertő et al. (2017) identified a positive association between investment and investment subsidies. Direct payments also contributed to increasing investment activity in agriculture, although this represents income support and not investment support (Fogarasi et al., 2014).
Methods and data
The empirical analysis uses micro data of Hungarian farms available from the national farm accountancy data network (FADN) collected by the Research Institute of Agricultural Economics (AKI) in Budapest. The FADN observes the assets-, financial- and income-based situations of a representative sample according to three categories:
region, economic size and type of farming. The sample con- sists of nearly 2000 agricultural holdings from year to year (Keszthelyi and Kis Csatári, 2020). Data from about 1000 crop specialised farms for the period 2001-2019 are used in this study. To investigate the relationship between insur- ance demand, technical efficiency and farm investment, it is firstly necessary to determine the technical efficiency scores.
The efficiency scores are estimated using Data Envelopment Analysis (DEA). Secondly, a system of simultaneous equa- tions is applied to examine the relationship between insur- ance take-up, technical efficiency and farm investment, also considering other factors, such as farm size, concentration, production intensity, subsidies and information on farmers’
characteristics.
The empirical analysis takes account of the three distinct phases of the Hungarian DMS. Initially, the DMS offered only very low compensation for losses (Kemény and Varga, 2010). To help increase the compensation capacity of the DMS, a two-scheme risk management system was intro- duced in 2012. The first scheme is damage mitigation, in which participation is compulsory for all farms above a cer- tain size in hectares (Lámfalusi and Péter, 2020). The sec- ond scheme consists of crop insurance premium support for three types of insurance (‘A’, ‘B’, ‘C’), in which participa- tion is voluntary. Under this scheme, the premium support cannot exceed 65 percent1 of the premium paid. Between 2012 and 2015, there was no lower limit for premium sup- port, this was introduced only in 2016 (‘A’ type – 41.25 per- cent, ‘B’ and ‘C’ type – 30 percent). The various types of subsidised insurance cover different combinations of crops and natural hazards (currently specified in the legislation).
The ‘A’ type (also referred as ‘all-risk’) insurance covers all the most important weather risks for the major arable and fruit crops. The ‘B’ type insurance addresses the major vegetable crops, minor fruit crops and some major arable crops, and covers only certain major risks. The ’C’ type insurance is available for all relevant crops for any damage not covered by insurance types ‘A’ and ‘B’ (Lámfalusi and Péter, 2020). Since 2012, farmers have had the option to cover weather risk by taking up subsidised or traditional (non-subsidised) crop insurance.
1 In 2020, the limit of financial support was raised to 70 percent.
Estimation of efficiency scores
The two principal methods used for efficiency analysis are Stochastic Frontier Analysis (SFA) which uses para- metric econometric techniques and DEA which is based on nonparametric mathematical programming techniques to construct a frontier over the data. Efficiency measures are calculated relative to this frontier (Coelli et al., 2005). The main advantage of using DEA over SFA for efficiency meas- urement is that it does not require any assumption about the functional form and about the distribution of the error terms (Charnes et al., 1994). However, the DEA method is data sensitive. The frontier is highly subject to the errors in the data because this method uses only the extreme observation to identify the ‘best-practice frontier’ (Timmer, 1971).
The statistical estimators of the frontier are obtained from a finite sample; consequently, the related measures of efficiency are sensitive to the sampling variations of the obtained frontier (Simar and Wilson, 1998). Simar and Wil- son (1998) provided a general methodology of bootstrapping to analyse the sensitivity of nonparametric efficiency scores to sampling variations. The present study employs output oriented constant returns to scale DEA model with bootstrap method to estimate the technical efficiency scores. The esti- mation of efficiency scores is based on one output (gross production value without subsidies) and four inputs (land, labour, capital, intermediate consumption).
System of simultaneous equations
To investigate the relationship between insurance use, technical efficiency and investment, a system of simultane- ous equations is used. The model is defined by the following equations (Amemiya, 1979; Maddala, 1983):
, (1) , (2) , (3) where , , are N × 1 vectors, , , , , , are scalars, is N × M1 matrix, is N × M2 matrix, is N × M3 matrix, is M1 × 1vector, is M2 × 1 vector, is M3 × 1 vector and , , are N × 1 error terms. The number of farms is indicated by N. The number of exogenous variables in the corresponding equations is denoted by M1, M2 and M3.
Equation (1) refers to the crop insurance demand model.
The dependent variable indicates the farmer’s decision on whether to take out crop insurance or not and is observed as a binary variable so that = if > 0, otherwise
= 0. Equation (2) describes the efficiency model, where the dependent variable indicates the technical efficiency scores which are estimated with the DEA method, as a result, these are bounded above by 1 and below by 0. Equa- tion (3) corresponds to the investment model. The depend- ent variable denotes the amount of net investment and is observed.
The model can be estimated equation-by-equation with the two-stage approach proposed by Amemiya (1979) and Maddala (1983). In the first stage the following reduced- form model is estimated.
, (4) , (5) , (6) where X is N × M vector consisting of all exogenous regres- sors from all equations, , , are the M × 1 coeffi- cients, and , , are the N × 1 error terms of the reduced model. The number of distinct exogenous vectors is denoted by M.
The coefficients of Equation (4) with the binary depend- ent variable are estimated with the Probit model. The depend- ent variable of Equation (5) is technical efficiency estimated using the DEA method. When regressing that variable, it is to be considered that the efficiency scores are serially corre- lated and the error terms are derived from a truncated distri- bution (Simar and Wilson, 2007). To deal with this issue, the empirical analysis follows Simar and Wilson (2007) and uses truncated regression with double bootstrap to estimate
Equation (5). Equation (6) with continuous dependent vari- able can be estimated using ordinary least squares (OLS).
The first stage predicted values are ,
and .
In the second stage, these fitted values are used as instru- ments for the endogenous regressors to estimate Equation (1), Equation (2) and Equation (3) following Newey’s two step procedure (Newey, 1987). The first step generates resid- uals from a linear probability regression of the endogenous variables on regressors and instruments. The second step fits the Probit, Simar-Wilson and linear regression models on regressors including the first step residuals (Cameron and Trivedi, 2009). The z statistics for the coefficients of first step residuals provides the basis of the Durbin-Wu-Hausman test for endogeneity. If some of the coefficients are significantly different from 0, then the second step estimator needs to be adjusted by using the bootstrap method following Cameron and Trivedi (2009).
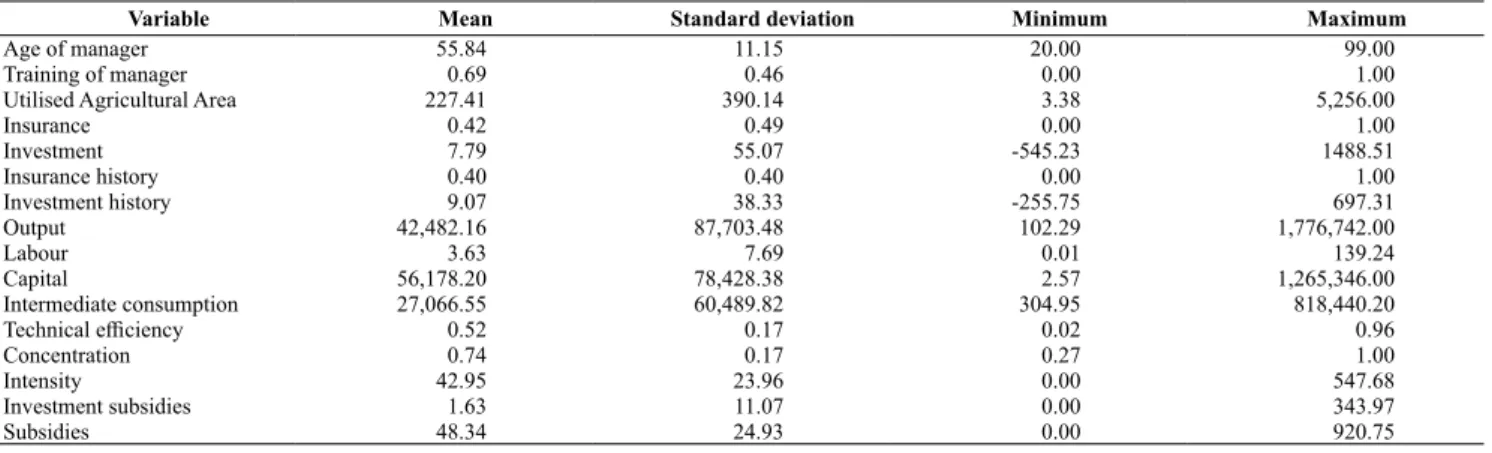
The list of variables used in the empirical analysis and their description is provided in Table 1. Monetary indica- tors have been deflated to the year 2001 using price indices provided by the Hungarian Central Statistical Office. The related descriptive statistics are presented in Table 2.
Table 1: Description of variables used in the empirical analysis.
Variable Description
Age of manager Age of the farm manager
Training of manager Agricultural training of the manager (0: no, 1: yes) Utilised Agricultural Area Size indicator, utilised agricultural area (ha)
Insurance Whether the farm has crop insurance in a given year (0: no, 1: yes)
Insurance history The average insurance use of the last three years. Proxy variable for willingness to take out crop insurance.
Investment Net investment per 1 hectare of land (HUF 1,000/ha)
Investment history The average net investment of the last three years (HUF 1,000/ha). Proxy variable for willingness to invest.
Output Gross production value without subsidies (HUF 1,000)
Labour Annual working unit (AWU) (sum of worked hours/2,200)
Capital Tangible assets (HUF 1,000)
Intermediate consumption Material expenses (HUF 1,000) Technical efficiency Technical efficiency (TE), CRS efficiency
Concentration Concentration of crop production calculated as the share of two major crops in the arable area Intensity Cost of seeds, fertilisers and pesticides and other direct material costs (HUF 1,000/ha) Investment subsidies Investment subsidies (HUF 1,000/ha)
Subsidies Total amount of subsidies excluding investment subsidies (HUF 1,000/ha)
2007-2011 period Dummy: 1 for 2007-2011, 0 otherwise
2012-2015 period Dummy: 1 for 2012-2015, 0 otherwise
2016-2019 period Dummy: 1 for 2016-2019, 0 otherwise
Source: Own compilation
Table 2: Descriptive statistics of the variables.
Variable Mean Standard deviation Minimum Maximum
Age of manager 55.84 11.15 20.00 99.00
Training of manager 0.69 0.46 0.00 1.00
Utilised Agricultural Area 227.41 390.14 3.38 5,256.00
Insurance 0.42 0.49 0.00 1.00
Investment 7.79 55.07 -545.23 1488.51
Insurance history 0.40 0.40 0.00 1.00
Investment history 9.07 38.33 -255.75 697.31
Output 42,482.16 87,703.48 102.29 1,776,742.00
Labour 3.63 7.69 0.01 139.24
Capital 56,178.20 78,428.38 2.57 1,265,346.00
Intermediate consumption 27,066.55 60,489.82 304.95 818,440.20
Technical efficiency 0.52 0.17 0.02 0.96
Concentration 0.74 0.17 0.27 1.00
Intensity 42.95 23.96 0.00 547.68
Investment subsidies 1.63 11.07 0.00 343.97
Subsidies 48.34 24.93 0.00 920.75
N=11,362
Source: Author’s calculations based on FADN data
Results
The results of the system of simultaneous equations employed in the study are presented in Tables 3, 4 and 5.
The endogeneity test based on the significance of first step residuals indicates that technical efficiency and investment are endogenous for insurance take-up, and insurance is endogenous for technical efficiency. Therefore, the second step estimator is adjusted by using the bootstrap method as required.
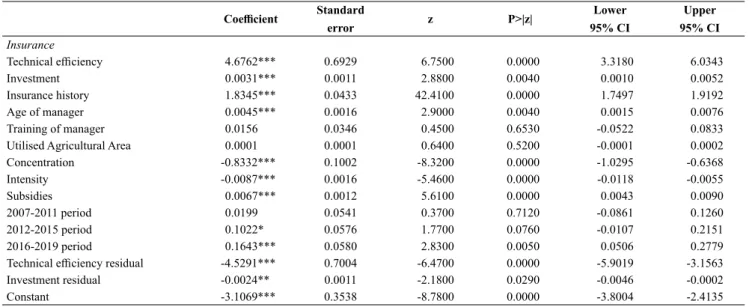
Results of the insurance take-up model
In addition to technical efficiency and investment, insur- ance history was found to have a positive and significant effect on insurance take-up (Table 3). The farmer’s age positively influences insurance usage, but the contribution of education is not significant. The coefficient of farm size is insignificant. Concentration and intensity significantly decrease insurance take-up. The total amount of subsidies (excluding investment subsidies) affects insurance demand positively. This variable also consists of the premium
support which is targeted to increase crop insurance usage.
The period 2007-2011 does not have a significant effect on insurance use but in the periods 2012-2015 and 2016-2019, insurance take-up increased significantly. The most recent period has the highest impact.
Results of the technical efficiency model
Insurance usage has a positive and significant effect on technical efficiency (Table 4). However, investment is sta- tistically insignificant for the efficiency model. The age of the farmer negatively influences technical efficiency, but the contribution of education is positive and significant. Farm size also impacts technical efficiency positively. Both con- centration and intensity have a positive and significant influ- ence on technical efficiency. By contrast, subsidies signifi- cantly decrease efficiency.
Results of the investment model
Insurance take-up has a positive and significant impact on investment (Table 5). However, technical efficiency does Table 3: Estimated parameters of the insurance take-up model
Coefficient Standard
error z P>|z| Lower
95% CI
Upper 95% CI Insurance
Technical efficiency 4.6762*** 0.6929 6.7500 0.0000 3.3180 6.0343
Investment 0.0031*** 0.0011 2.8800 0.0040 0.0010 0.0052
Insurance history 1.8345*** 0.0433 42.4100 0.0000 1.7497 1.9192
Age of manager 0.0045*** 0.0016 2.9000 0.0040 0.0015 0.0076
Training of manager 0.0156 0.0346 0.4500 0.6530 -0.0522 0.0833
Utilised Agricultural Area 0.0001 0.0001 0.6400 0.5200 -0.0001 0.0002
Concentration -0.8332*** 0.1002 -8.3200 0.0000 -1.0295 -0.6368
Intensity -0.0087*** 0.0016 -5.4600 0.0000 -0.0118 -0.0055
Subsidies 0.0067*** 0.0012 5.6100 0.0000 0.0043 0.0090
2007-2011 period 0.0199 0.0541 0.3700 0.7120 -0.0861 0.1260
2012-2015 period 0.1022* 0.0576 1.7700 0.0760 -0.0107 0.2151
2016-2019 period 0.1643*** 0.0580 2.8300 0.0050 0.0506 0.2779
Technical efficiency residual -4.5291*** 0.7004 -6.4700 0.0000 -5.9019 -3.1563
Investment residual -0.0024** 0.0011 -2.1800 0.0290 -0.0046 -0.0002
Constant -3.1069*** 0.3538 -8.7800 0.0000 -3.8004 -2.4135
Notes: *p < 0.1; **p < 0.05; ***p < 0.01.
Source: Author’s calculations based on FADN data
Table 4: Estimated parameters of the technical efficiency model.
Coefficient Standard
error z P>|z| Lower
95% CI
Upper 95% CI Technical efficiency
Insurance 0.0318*** 0.0061 5.2400 0.0000 0.0199 0.0437
Investment 0.0000 0.0001 0.3600 0.7160 -0.0001 0.0002
Age of manager -0.0009*** 0.0001 -6.1800 0.0000 -0.0011 -0.0006
Training of manager 0.0132*** 0.0033 4.0100 0.0000 0.0067 0.0196
Utilised Agricultural Area 0.0001*** 0.0000 20.6300 0.0000 0.0001 0.0001
Concentration 0.0249** 0.0106 2.3600 0.0180 0.0043 0.0456
Intensity 0.0024*** 0.0001 22.1200 0.0000 0.0021 0.0026
Subsidies -0.0009*** 0.0001 -8.9700 0.0000 -0.0011 -0.0007
Insurance residual -0.0259*** 0.0073 -3.5500 0.0000 -0.0402 -0.0116
Investment residual 0.0000 0.0001 0.2700 0.7830 -0.0002 0.0002
Constant 0.4488*** 0.0130 34.4000 0.0000 0.4232 0.4744
Notes: *p < 0.1; **p < 0.05; ***p < 0.01 Source: Author’s calculations based on FADN data
ance premium support, which specifically encourages crop insurance growth.
Differences in research methodology may explain why, unlike Enjolras and Sentis (2011), Sherrick et al. (2004) and Zubor-Nemes et al. (2018), no significant effect of farm size on insurance demand was detected. The first study applied logistic regression, the second used multinomial logit model and the third applied Probit models. The present study inves- tigated the reciprocal effects and the relationship between the three dependent variables may eliminate the direct impact of farm size on insurance demand. Similarly, Baráth et al.
(2017) applied a system of simultaneous equations and found that the effect of farm size is not significant for TFP specification, only for the PM specification.
The absence of any significant impact of education, in contrast to the finding of Sherrick et al. (2004) and Finger and Lehmann (2012), may also be caused by differences in research methodology. The effect of education on insurance demand can be eliminated by using a system of simultaneous equations.
Technical efficiency
Technical efficiency is determined by manager age and training, farm size, concentration, intensity and subsidies.
Farm size positively affects technical efficiency, in line with the findings of Bojnec and Fertő (2013) and Latruffe et al.
(2004). More educated farmers are more efficient, as shown by Dessale (2019). This implies that these farmers are will- ing to apply new technology to increase technical efficiency.
Concentration positively affects technical efficiency, as shown by Bojnec and Latruffe (2009), suggesting that farm- ers who can focus their management efforts are more effi- cient than farmers with more diversified cropping structures.
Intensity also increases technical efficiency. Kemény et al. (2019) modelled the effects of climate change on the yield of winter wheat and maize for the period 2020-2100 and showed that, in the case of maize, the application of the correct amount of nitrogen can reduce yield loss caused by climate change. The negative role of subsidies, as also shown by Bojnec and Latruffe (2009) and Zhu and Lansink not influence investment significantly. Investment history
also has a positive and significant effect on investment.
The impact of the farmer’s age and education are insignif- icant. The role of farm size is insignificant in the case of investment decision. Concentration influences investment negatively and significantly, but production intensity has no significant effect on investment. Total subsidies (excluding investment subsidies) and investment subsidies also have a positive sign; both are statistically significant, but the impact of investment subsidies is higher.
Discussion
This study examined the interrelationship between crop insurance take-up, technical efficiency and investment among Hungarian FADN crop specialised farms. All three factors can all play a role in improving these farms’ resil- ience to the impacts of extreme weather events and climate change and the empirical results show that each of them is influenced by several drivers.
Insurance take-up
Insurance take-up is influenced by insurance history, age of manager, concentration, intensity and subsidies but not by training of the manager and the farm size. The positive effect of manager’s age on insurance take-up, as also shown by Sherrick et al. (2004) and Finger and Lehmann (2012), suggests that older farmers are more risk averse. Concentra- tion influences insurance take-up negatively, which is in line with the findings of Mishra et al. (2004). This result suggests that a farmer with a diversified crop production structure may also take out crop insurance to further reduce weather risk. The negative role of intensity is in line with findings of Smith and Goodwin (1996) and Serra et al. (2003) and con- firms that intensification can substitute for insurance usage.
Subsidy influences positively crop insurance demand, as also shown by Baráth et al. (2017), who argued that subsidies may increase demand for crop insurance by relaxing farm budget constraints. In addition, total subsidy includes insur- Table 5: Estimated parameters of the investment model.
Coefficient Standard
error z P>|z| Lower
95% CI
Upper 95% CI Investment
Insurance 3.8928* 2.0774 1.8700 0.0610 -0.1792 7.9648
Technical efficiency 35.5100 21.7268 1.6400 0.1020 -7.0374 78.1393
Investment history 0.0853*** 0.0130 6.5400 0.0000 0.0597 0.1109
Age of manager 0.0002 0.0481 0.0000 0.9960 -0.0941 0.0945
Training of manager 0.6342 1.1045 0.5700 0.5660 -1.5307 2.7992
Utilised Agricultural Area -0.0031 0.0023 -1.3700 0.1710 -0.0077 0.0014
Concentration -15.8671*** 3.2624 -4.8600 0.0000 -22.2619 -9.4723
Intensity -0.0800 0.0488 -1.6400 0.1010 -0.1757 0.0157
Investment subsidies 1.5280*** 0.0445 34.3100 0.0000 1.4407 1.6153
Subsidies 0.0455* 0.0265 1.7200 0.0860 -0.0064 0.0975
Technical efficiency residual -0.4926 2.4273 -0.2000 0.8390 -5.2505 4.2653
Investment residual -29.2752 21.9509 -1.3300 0.1820 -72.3028 13.7524
Constant -2.2911 10.6342 -0.2200 0.8290 -23.1361 18.5538
Notes: *p<0.1; **p<0.05; ***p<0.01.
Source: Author’s calculations based on FADN data
(2010), suggests that subsidies can reduce farmers’ effort and therefore decrease technical efficiency.
The negative impact of farmers’ age on technical effi- ciency, in contrast to the findings of Nowak et al. (2016) and Dessale (2019), suggests that younger Hungarian farmers may adapt much more easily to new technologies, such as digital technologies, than their older counterparts.
Investment
Investment is affected by investment history, invest- ment subsidies and concentration but not by age of manager, training of manager, farm size or intensity. The positive role of investment history is in line with the findings of Lefeb- vre et al. (2014) and confirms that investment history is a good proxy for willingness to invest. Investment subsidies and total subsidies (excluding investment subsidies) also increase investment, as shown by Fertő et al. (2017) and Fogarasi et al. (2014). It may be that credit market imperfec- tions and the resulting liquidity constraints have an impact on investment decisions of farmers (Bakucs et al., 2009).
According to Fogarasi et al. (2014), credit market imperfec- tions are slightly compensated by investment support with facilitating the financing of agricultural activity. In addition, they argue that direct payments can also increase investment activity. Concentration has a negative effect on investment.
One reason could be that growing fewer types of crops might require less equipment with lower maintenance costs.
The absence of any significant impact of farmer age and education on investment, in contrast to the findings of Niavis et al. (2020), suggests that younger and older farmers invest similarly in Hungary. Similarly, the finding that agricultural education does not have a significant effect on investment among Hungarian farmers is not consistent with the findings of Wieliczko et al. (2019) in Poland. The current research investigates only the impact of agricultural training and could be extended to include non-agricultural education to get a deeper understanding of the impact of education.
Differences in research methodology may also explain why, unlike Lefebvre et al. (2014) and Niavis et al. (2020), this study detected no effect of farm size on investment. The former treated the investment variable as a dummy variable and the latter investigated the number of investments. The present study used net investment per hectare, and it fol- lows that investments of equal value appear to be smaller for larger farms, which may obscure differences by size.
One reason why intensity has no significant effect on investment may be that the quantitative changes of fertiliser or pesticide use do not influence significantly the equipment needed if the farmers already use these chemicals. In future work, it would be useful to investigate the partial effect of the changes on each input separately to see that the aggrega- tion of these inputs is the causes the insignificant result.
Interrelationships between the three factors
Crop insurance usage impacts positively on technical efficiency. Crop insurance provides a safety net – conse- quently, the producer also receives income in the case of nat- ural damage. This safety might also contribute to developing
the technology and improving technical efficiency. Another explanation might be that crop insurance has a premium cost which can put pressure on the farmer to improve their techni- cal efficiency to generate additional income to compensate.
As regards the positive and significant impact of technical efficiency on insurance usage, Baráth et al. (2017) obtained similar results when investigating the effect of economic performance (measured by farm profit margin and TFP) on insurance demand. This result suggests that managers of farms with higher technical efficiency also consider care- fully other aspects of production. They are more likely to subscribe to crop insurance to control risk than managers of farms with lower technical efficiency.
Insurance take-up affects investment positively. The rea- son may be that the safety net provided by the insurance pro- vides an opportunity for further development. Investment also encourages insurance demand. Lefebvre et al. (2014) simi- larly found a positive relationship between farmers intentions to invest and other good farm management practices, such as having agricultural insurance. However, some producers use credit to finance investment and insurance subscription is a precondition of contracting credits from financial institutions.
Although investments are a basic way to increase effi- ciency (Pawłowski et al., 2021), the present study, which investigates the simultaneous effects of insurance take-up, technical efficiency and investment, does not reveal any significant interaction between technical efficiency and investment. It may be concluded that since investment has a long-term effect, the current year’s investment improves the technical efficiency only in the following years. Similarly, the effect of technical efficiency on investment is not sig- nificant. This implies that the less efficient and more efficient farms equally willing to invest, especially with appropriate financial support.
Conclusions and recommendations
Climate change and extreme weather events are putting increasing pressure on agriculture in Hungary as elsewhere.
The empirical results of this study show that encouraging insurance take-up by Hungarian crop specialised farms has a positive effect both on their technical efficiency and invest- ment. Simultaneously, development of technical efficiency and investment increase insurance usage.
The model also reveals that significant differences in the insurance demand of farms have already occurred over time.
With the introduction of two-scheme risk management system in 2012, insurance usage increased significantly. In 2016, the establishment of lower limit of premium support was even more stimulating. Since Hungarian crop insurance policy has evidently become more effective following revision on several occasions, there may be scope for its further develop- ment. Future policy interventions concerning insurance usage may, by taking account of the drivers of farmers’ behaviour, potentially have additional positive impacts through spill-over effects on technical efficiency and investments.
Owing to the positive and significant impact of crop insurance take-up on investment, policy interventions focus- ing on insurance use might also pay attention to investment,
for example, differentiating insurance premium subsidies depending on whether there is an ongoing (or operating) investment that can be linked to weather-risk management.
In view of the different effects of managers’ age on insurance take-up and technical efficiency, it may be that the usage of crop insurance should be more forcefully tar- geted at older farmers. This approach might have a ‘knock on’ effect on technical efficiency and serve to make farms managed by older farmers more resilient to weather-related impacts.
Since insurance history significantly increases insurance take-up, the insurance companies might focus on farmers who have not purchased crop insurance recently to expand the range of insured. Similarly, since investment history is closely related to current investment, policy concerning investment initiatives might be more forcefully targeted at the farmers who have not invested recently.
Subsidies have a significant role for all three variables.
But it seems that in the context of crop insurance, techni- cal efficiency and investment, the targeted financial support is more effective than total subsidies including direct pay- ments. Total subsidies decrease technical efficiency. In con- trast, targeted subsidies, i.e., premium support, encourage crop insurance demand and investment subsidies stimulate investment significantly. This finding can help decision makers to further develop agricultural support schemes, for example through the refinement of direct support schemes.
Further research is needed to investigate the dynamic relationship between insurance take-up, technical effi- ciency and farm investment. This study does not examine the possible lagged effect of dependent variables; only average historical values are considered as proxy variables for the willingness to insure and the willingness to invest.
A deeper insight into the causality effects between these variables may be achieved by applying a dynamic panel model.
References
Amemiya, T. (1979): The Estimation of a Simultaneous-Equation Tobit Model. International Economic Review, 20 (1), 169–181.
https://doi.org/10.2307/2526423
Bakucs, L.Z., Fertő, I. and Fogarasi, J. (2009): Investment and fi- nancial constraints in Hungarian agriculture. Economics Let- ters, 104 (3), 122–124.
https://doi.org/10.1016/j.econlet.2009.04.019
Baráth, L., Bokusheva, R. and Fertő, I. (2017): Demand for Farm Insurance Under Financial Constraints. Eastern European Eco- nomics, 55 (4), 357–376.
https://doi.org/10.1080/00128775.2017.1294986
Bojnec, Š. and Fertő, I. (2013): Farm income sources, farm size and farm technical efficiency in Slovenia. Post-Communist Econo- mies, 25 (3), 343–356.
https://doi.org/10.1080/14631377.2013.813140
Bojnec, Š. and Latruffe, L. (2009): Determinants of technical ef- ficiency of Slovenian farms. Post-Communist Economies, 21 (1), 117–124. https://doi.org/10.1080/14631370802663737 Cameron, C.A. and Trivedi, P.K. (2009): Mocroeconometrics Us-
ing Stata. College Station, Texas: Stata Press.
Charnes, A., Cooper, W.W., Lewin, A.Y. and Seiford, L.M. (1994):
Data Envelopment Analysis: Theory, Methodology, and Appli- cations. Netherlands: Springer.
Coelli, T.J., Rao, D.S.P., O’Donnell, C.J. and Battese, G.E. (2005):
An Introduction to Efficiency and Productivity Analysis (2nd edition). New York, NY: Springer.
Collier, B., Skees, J. and Barnett, B. (2009): Weather Index Insur- ance and Climate Change: Opportunities and Challenges in Lower Income Countries. The Geneva Papers on Risk and In- surance - Issues and Practice, 34 (3), 401–424.
https://doi.org/10.1057/gpp.2009.11
Dessale, M. (2019): Analysis of technical efficiency of small holder wheat-growing farmers of Jamma district, Ethiopia. Agricul- ture & Food Security, 8 (1).
https://doi.org/10.1186/s40066-018-0250-9
Enjolras, G. and Sentis, P. (2011): Crop insurance policies and purchases in France. Agricultural Economics, 42 (4), 475–486.
https://doi.org/10.1111/j.1574-0862.2011.00535.x
Eurostat (2020): https://ec.europa.eu/eurostat/data/database (Ac- cessed 11 October 2021)
Falco, S.D., Adinolfi, F., Bozzola, M. and Capitanio, F. (2014):
Crop Insurance as a Strategy for Adapting to Climate Change.
Journal of Agricultural Economics, 65 (2), 485–504.
https://doi.org/10.1111/1477-9552.12053
Fertő, I., Bakucs, Z., Bojnec, Š. and Latruffe, L. (2017): Short com- munication: East-West European farm investment behaviour – The role of financial constraints and public support. Spanish Journal of Agricultural Research, 15 (1), 1–7.
https://doi.org/10.5424/sjar/2017151-10252
Finger, R. and Lehmann, N. (2012): The influence of direct pay- ments on farmers’ hail insurance decisions. Agricultural Eco- nomics, 43 (3), 343–354.
https://doi.org/10.1111/j.1574-0862.2012.00587.x
Fogarasi, J., Wieliczko, B., Marek, W. and Tóth, K. (2014): Financ- ing of Agriculture and Investment Supports in Agriculture. In Potori, N., Fieldsend, A.F. and Chmieliński, P. (Eds.), Struc- tural changes in Polish and Hungarian agriculture since EU accession: lessons learned and implications for the design of future agricultural policies. Budapest: Research Institute of Agricultural Economics.
Goodwin, B.K. (1993): An Empirical Analysis of the Demand for Multiple Peril Crop Insurance. American Journal of Agricultural Economics, 75 (2), 425–434. https://doi.org/10.2307/1242927 Goodwin, B.K. and Smith, V.H. (2013): What Harm Is Done By
Subsidizing Crop Insurance? American Journal of Agricultural Economics, 95 (2), 489–497.
https://doi.org/10.1093/ajae/aas092
IPCC (2014): Climate Change 2014: Synthesis Report. Contribu- tion of Working Groups I, II and III to the Fifth Assessment Re- port of the Intergovernmental Panel on Climate Change [Core Writing Team, R.K. Pachauri and L.A. Meyer (eds.)], Geneva, Switzerland.
Kemény, G., Molnár, A. and Fogarasi, J. (eds.) (2019): A klímavál- tozás hatásának modellezése a főbb hazai gabonafélék esetén [Modelling the impact of climate change for the key cereal crops in Hungary]. Budapest: Agrárgazdasági Kutató Intézet.
https://doi.org/10.7896/ak1901
Kemény, G. and Varga, T. (eds.) (2010): A hazai mezőgazdasági biztosítási rendszer problémái és továbbfejlesztésének lehetőségei [Problems and Further Development Possibilities of the Hungarian Agricultural Insurance System]. Budapest:
Agrárgazdasági Kutató és Informatikai Intézet.
Keszthelyi, S. and Kis Csatári, E. (2020): A Tesztüzemi Információs Rendszer eredményei 2018 [Results of the Farm Accountancy Data Network in 2018]. Budapest: NAIK Agrárgazdasági Kutatóintézet.
KSH (2020): Agrárcenzus 2020 [Agricultural census 2020].
https://www.ksh.hu/agrarcenzusok_agrarium_2020 (Accessed 11 October 2021)
Lámfalusi, I. and Péter, K. (eds.) (2020): Az agrár-kockázatkezelési rendszer működésének értékelése 2018 [Evaluation of the operation of the agricultural risk management system, 2018].
Budapest: NAIK Agrárgazdasági Kutatóintézet.
Latruffe, L., Balcombe, K., Davidova, S. and Zawalinska, K.
(2004): Determinants of technical efficiency of crop and live- stock farms in Poland. Applied Economics, 36 (12), 1255–1263.
https://doi.org/10.1080/0003684042000176793
Lazíková, J., Lazíková, Z., Takáč, I., Rumanovská, Ľ. and Bandlerová, A. (2019): Technical Efficiency in the Agricultural Business—The Case of Slovakia. Sustainability, 11 (20), 5589.
https://doi.org/10.3390/su11205589
Lefebvre, M., De Cuyper, K., Loix, E., Viaggi, D. and Gomez-y- Paloma, S. (2014): European farmers’ intentions to invest in 2014-2020: survey results. JRC Report 90441, Luxembourg.
https://doi.org/10.2791/82963
Maddala, G.S. (1983): Limited-Dependent and Qualitative Vari- ables in Econometrics (Econometric Society Monographs).
Cambridge: Cambridge University Press.
Mishra, A.K., El-Osta, H.S. and Sandretto, C.L. (2004): Factors affecting farm enterprise diversification. Agricultural Finance Review, 64 (2), 151–166.
https://doi.org/10.1108/00214660480001160
Möhring, N., Dalhaus, T., Enjolras, G. and Finger, R. (2020): Crop insurance and pesticide use in European agriculture. Agricul- tural Systems, 184, 102902.
https://doi.org/10.1016/j.agsy.2020.102902
Newey, W.K. (1987): Efficient estimation of limited dependent var- iable models with endogenous explanatory variables. Journal of Econometrics, 36 (3), 231–250.
https://doi.org/10.1016/0304-4076(87)90001-7
Niavis, S., Kyrgiakos, L.-S., Kleisiari, C. and Vlontzos, G. (2020):
What Drives Farmers’ Decisions to Invest? The Role of Re- search Engagement, Information Collection and Type of Farm.
International Journal on Food System Dynamics, 11 (3), 241–
257. https://doi.org/10.18461/ijfsd.v11i3.52
Nowak, A., Kijek, T. and Domańska, K. (2016): Technical effi- ciency and its determinants in the European Union. Agricultural Economics (Zemědělská ekonomika), 61 (6), 275–283.
https://doi.org/10.17221/200/2014-AGRICECON
OMSZ (2015): Megfigyelt hazai éghajlati változások [Observed climate changes in Hungary]. Budapest. Retrieved from https://www.met.hu/ismeret-tar/kiadvanyok/fuzetek/index.
php?id=1413&hir=Megfigyelt_hazai_eghajlati_valtozasok (Accessed 11 October 2021).
Pawłowski, K.P., Czubak, W. and Zmyślona, J. (2021): Regional Diversity of Technical Efficiency in Agriculture as a Results of an Overinvestment: A Case Study from Poland. Energies, 14 (11), 3357. https://doi.org/10.3390/en14113357
Serra, T., Goodwin, B.K. and Featherstone, A.M. (2003): Mod- eling changes in the U.S. demand for crop insurance during the 1990s. Agricultural Finance Review, 63 (2), 109–125.
https://doi.org/10.1108/00215030380001144
Sherrick, B.J., Barry, P.J., Ellinger, P.N. and Schnitkey, G.D. (2004):
Factors Influencing Farmers’ Crop Insurance Decisions. Ameri- can Journal of Agricultural Economics, 86 (1), 103–114.
https://doi.org/10.1111/j.0092-5853.2004.00565.x
Simar, L. and Wilson, P.W. (2007): Estimation and inference in two-stage, semi-parametric models of production processes.
Journal of Econometrics, 136 (1), 31–64.
https://doi.org/10.1016/j.jeconom.2005.07.009
Simar, L. and Wilson., P.W. (1998): Sensitivity Analysis of Effi- ciency Scores: How to Bootstrap in Nonparametric Frontier Models. Management Science, 44 (1), 49–61.
https://doi.org/10.1287/mnsc.44.1.49
Smith, V.H. and Goodwin, B.K. (1996): Crop Insurance, Moral Hazard, and Agricultural Chemical Use. American Journal of Agricultural Economics, 78 (2), 428–438.
https://doi.org/10.2307/1243714
Spinoni, J., Lakatos, M., Szentimrey, T., Bihari, Z., Szalai, S., Vogt, J. and Antofie, T. (2015): Heat and cold waves trends in the Carpathian Region from 1961 to 2010. International Journal of Climatology, 35 (14), 4197–4209.
https://doi.org/10.1002/joc.4279
Timmer, C.P. (1971): Using a Probabilistic Frontier Production Function to Measure Technical Efficiency. Journal of Political Economy, 79 (4), 776–794. https://doi.org/10.1086/259787 Wieliczko, B., Kurdyś-Kujawska, A. and Sompolska-Rzechuła, A.
(2019): Investment behavior of the Polish farms – is there any evidence for the necessity of policy changes? Journal of Central European Agriculture, 20 (4), 1292–1301.
https://doi.org/10.5513/JCEA01/20.4.2227
Zhu, X. and Lansink, A.O. (2010): Impact of CAP Subsidies on Technical Efficiency of Crop Farms in Germany, the Nether- lands and Sweden. Journal of Agricultural Economics, 61 (3), 545–564. https://doi.org/10.1111/j.1477-9552.2010.00254.x Zubor-Nemes, A., Fogarasi, J., Molnár, A. and Kemény, G. (2018):
Farmers’ responses to the changes in Hungarian agricultural in- surance system. Agricultural Finance Review, 78 (2), 275–288.
https://doi.org/10.1108/AFR-06-2017-0048