Fiscal Stability and Macroeconomic Environment in Nigeria: A Further
Assessment
BASHIR OLAYINKA KOLAWOLE
SENIOR LECTURER
LAGOS STATE UNIVERSITY e-mail: kolawolebashir@gmail.com
SUMMARY
This paper examines the relationship between fiscal stability and macroeconomic environment in Nigeria using time series data covering the period 1981-2019. As Nigeria’s debt appears excessive amid macroeconomic imbalance, different concerns are raised about the capacity of the government to repay the debt. In this regard, several studies are conducted on the sustainability of the country’s debt. But then, as a long-run analysis, assessment of debt sustainability is prone to considerable uncertainty and large margins of error. Thus, the relevance and need for a short-run analysis which serves as the basis for assessing fiscal stability. In the process, while multiple structural breaks are revealed in the total revenue, exchange rate, and total debt series, a feedback causal-effect is affirmed between fiscal stability and interest rate. Consequently, the short-run analysis establishes negative impacts from each of debt and exchange rate, as against positive effect from revenue on fiscal stability. As such, given a mixed relationship between fiscal stability and certain macroeconomic factors, an improved revenue collection is suggested with reduction in borrowing.
Keywords: Debt; fiscal stability; macroeconomic environment; revenue; sustainability Journal of Economic Literature (JEL) Codes: E62; H50
DOI: http://dx.doi.org/10.18096/TMP.2021.03.05
I NTRODUCTION
The need for fiscal soundness has drawn attentions of policy makers and international institutions to the debt profile and macroeconomic imbalance in Nigeria.i Incidentally, the situation raises specific concerns about interest payments which might consume large part of revenue and consequently make it difficult to create employment and grow the economy. Thus, as global debt climbs, total debt in Nigeria becomes excessive amid rising deficit.ii Although the country’s public debt is adjudged to be sustainable at 25% of gross domestic product (GDP), however, due to low revenue collections, total public debt-to-revenue and total debt service-to-revenue are trending upward and appear vulnerable to revenue shocks.iii Meanwhile, as global demand for oil declines, the situation results in slow GDP growths and a recession in 2020 (AfDB, 2021). Nonetheless, in the quest to set the country back on sustainable growth path with the hope of increasing public revenue and stimulate the economy,
the plans’ objective to enhance fiscal prudence and achieve transparency in public spending, majority of the states in the country find it difficult to pay salaries as unemployment rises from 14.2% in 2016 to 23.1%
in 2019 and 33.3% in 2020. Similarly, public debt increases from ₦7.55 trillion in 2012 to ₦32.915 trillion in 2020, and federal government retained revenue drops from ₦3.99 trillion in 2019 to ₦2.88 trillion in 2020 as against debt service payment well over 50% of federally collected revenue (AfDB, 2021;
National Bureau of Statistics [NBS], 2021; Sunnews, 2021). As such, given the gloomy macroeconomic environment, which of the macroeconomic factors drives fiscal stability in Nigeria?
Imperatively, fiscal stability relates to the solvency of an economy as regards its outstanding debt obligation. Therefore, when a country finds itself in a situation when its actual revenues could not match planned expenditure, it is normal to borrow but with the commitment to repay at, or over, a specific period of time. Thus, in this regard, discussions are raging on the sustainability of Nigeria’s debt. Prominent among
(2017) debt sustainability analysis (DSA)v and Kolawole (2019) assessment of fiscal financing and sustainability. While Kolawole (2019) establishes that foreign financing could not sustain the country’s debt, the DSA reveals that external debt portfolio maintains low risk even as external borrowing is forecast to increase marginally between 2017 and 2033. In addition, DMO’s analysis affirms that total public debt- to-GDP ratio is below the threshold of 56% over the period 2017-2037 as debt limit of 19.39% is suggested to be reviewed to 25% in the period 2018-2020. But then, the findings notwithstanding, for the fact that fiscal sustainability is a long-run indicator of government’s fulfilment of present value of budget constraint, its assessment is necessarily prone to considerable uncertainty and large margins of error (Giammarioli et al, 2006). As such, owing to the degree of error and uncertainty in the analysis of fiscal sustainability which undoubtedly points to the relevance and need for fiscal stability analysis, this paper, by objective, builds on Kolawole (2019) and answers the above question by assessing the effect of macroeconomic factors on fiscal stability in Nigeria.
Essentially, as the assessment serves as contribution to the discussion on fiscal soundness, it ascertains the efficacy of certain macroeconomic factors in maintaining solvency in the short-run.
Moreover, the significance of this paper also rests on the desire of the Nigerian government, as well as concerned international institutions, to achieve healthy public finance and a conducive macroeconomic environment in the country. Although the nation is at the verge of recovery from economic downturn and debt overhang necessitated by the corona virus disease 2019 [COVID-19] pandemic, yet, anti-socioeconomic activity of insurgents and bandits is causing addition to the already bloated fiscal spending and thus, casting doubt on the sustainability of debt. Thus, very
imperative is the relevance of this paper as its findings, to a large extent, will sensitise the government and concerned agencies on the importance of macroeconomic factors that can impact fiscal soundness in the short-run.
After this introductory aspect, the other part of the paper is structured as follows. Section two does an overview of the macroeconomic environment in Nigeria as the third section reviews relevant literature.
Section four provides the methodology while section five presents and discusses the results. Section six wraps the paper with conclusion and policy implications.
O VERVIEW OF MACROECONOMIC ENVIRONMENT IN NIGERIA
The macroeconomic activities of Nigeria are typical of a middle-income emerging economy broadly divided into three sectors: agriculture, industry and services, with more than 20 sub-sectors. As such, over the years, in the attempt to achieve macroeconomic balance and transparency in government financial management, the medium term expenditure framework (MTEF) and the Fiscal Responsibility Act were introduced as reforms in 2004 and 2007, respectively (African Economic Outlook, 2014). In addition, the Federal Inland Revenue Service (FIRS) and the Federal Ministry of Finance are actively implementing reforms aimed at plugging revenue leakages. The initiatives include the introduction of a tax identification number system, approval of generous incentives for revenue service staff, sustained capacity-building and using information technology in tax administration.
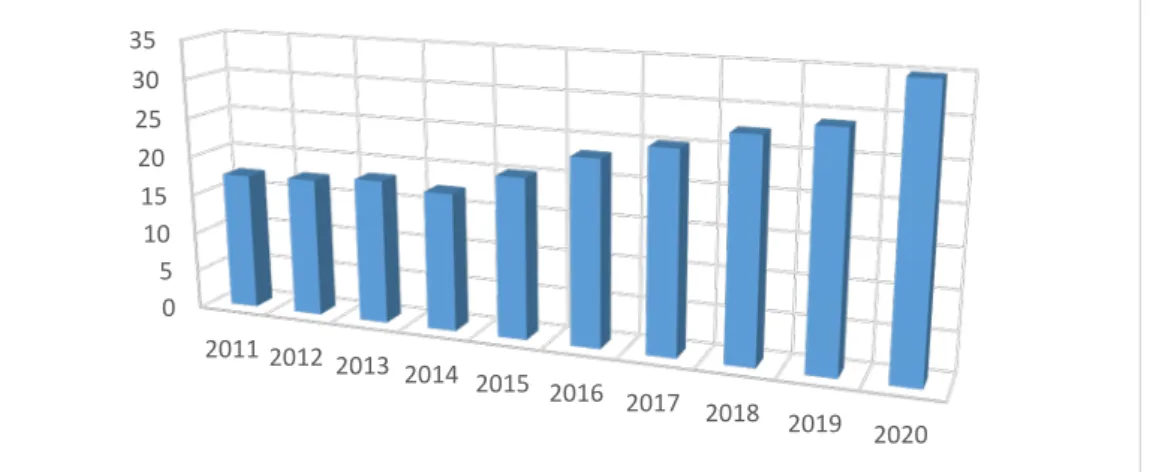
Source: Author’s representation using data from NBS (2021).
Figure 1. Debt-to-GDP ratio (% of GDP) in Nigeria, 2011 - 2020.
Also, with the aim of enhancing prudence and transparency in spending, and ultimately to ensure that states keep to fiscal sustainability path, the federal government introduces a 22-point FSP in 2016.
Imperatively, the FSP is strategized around increasing public revenue and sustainable debt management, among others. Despite the existence of the plan, however, majority of the states find it difficult to boost 0
5 10 15 20 25 30 35
2011 2012 2013 2014 2015 2016 2017
2018 2019 2020
their internally generated revenue even as debt obligations keep mounting. Moreover, in the attempt to cub revenue losses, the federal government inaugurates the “Revenue Optimisation and Verification Project” in January 2018 to probe revenue leakages in the mines and minerals sector between 2012 and 2017 (Amaefule, 2018). In addition, in its efforts to strengthen public financial management, the government has implemented the treasury single
account (TSA), the integrated payroll and personnel information system (IPPIS), and the government integrated financial management information system (GIFMIS). Nonetheless, as well as issuing the directive that the Nigeria national petroleum corporation (NNPC) to recover all outstanding obligations, the President mandates the deployment of the National Trade Window to enhance efficiency in Customs duty collection from 64 to 90% in the future (Udoma, 2019).
Table 1
Selected factors in the macroeconomic environment in Nigeria, 1981 - 2019.
Variable/Period
1981- 1985
1986- 1990
1991- 1995
1996- 2000
2001- 2005
2006- 2010
2011- 2015
2016- 2019
Real interest rate (%) -14.4 1.5 -13.7 4.7 4.2 5.9 9.6 5.8
Growth (%) -5.2 4.9 0.2 3.1 8.9 7.1 5.03 0.8
Fiscal balance (% of GDP) -2.4 -3.7 -3.9 -1.8 -1.7 -0.9 -1.5 -3
External debt stock (% of GNI) 16.8 59.4 88.8 56.1 36.8 5.8 5.6 11.6
Total debt service (% of GNI) 3.4 4.4 5.6 2.9 2.7 0.8 0.4 1.1
Gross domestic savings (% of GDP) 72.6 58.9 51.3 45.6 35.3 29.3 23.2 16.7
Gross savings (% of GNI) 72 57.5 49.7 44.3 33.7 32.9 24.5 19.8
Gross national expenditure (% of
GDP) 98.7 91.9 91.9 92 93 92.4 92.3 103
Inflation, consumer prices (annual
%) 15.4 25.9 48.9 12.3 15.7 10.3 9.7 13.9
Exports (% of GDP) 6.9 15.1 21.2 25.4 23.9 24.1 22.1 13
Imports (% of GDP) 5.5 7.04 13.1 17.5 16.9 16.3 14.2 15.5
Official exchange rate 0.7 5.1 18.6 51.9 125 134 164 293
Current account balance (% of GDP) -2 2.3 -0.8 2.4 8.2 8.5 1.4 0.7
FDI, net inflow (% of GDP) 0.4 1.5 3 1.2 1.9 2.3 1.3 0.8
Net ODA received (% of GNI) 0.04 0.4 0.7 0.3 1.1 1.5 0.5 0.8
Total reserves (% of total external
debt) 15.8 6.7 6.7 23 41.6 283 161 82.5
Oil revenue (₦Billion) 8.6 31.6
178.7 693 2626 4974 6868 4471 Non-oil revenue (₦Billion) 3.7 11.9
50.5 192 651.2 1368 2835 3747 Note: GNI is gross national income; FDI is foreign direct investment; and ODA is official development assistance.
Source: Author's computation using data from Central Bank of Nigeria [CBN] (2019) and World Bank (2021).
Meanwhile, as an oil producing country, Nigeria collects 70% of her revenue and 90% of foreign exchange from oil exports even as average daily production drops to 1.3 million barrels in 2020 from 1.9 million barrels in 2011 (Proshare, 2018; CBN, 2021a). As such, notwithstanding world oil price volatility which settles averagely at $41.8 per barrel in 2020, Table 1 shows the country’s oil revenue, in tandem with non-oil revenue, increasing from ₦8.6 billion in the period 1981-1985 to ₦4,471billion in the period 2016-2019. Also, non-tax revenue amounts to
3.1% of GDP in 2018 while its highest components of rents and royalties of 66.6% amounts to 2% of GDP as against tax-to-GDP ratio declining from 9.6% in 2011 to 6.3% in 2018 (Organisation for Economic Cooperation and Development [OECD], 2020). Yet, despite the performance in revenue, domestic savings decline consecutively from an average 72.6% of GDP in 1981-1985 to 16.7% in 2016-2019 which is in tandem with decrease in gross savings from an average 72% of GNI to 19.8%, respectively. In addition, FDI inflow declines from 2.3% in 2006-2010 to 1.8% and
0.8% respectively in 2011-2015 and 2016-2019. Also, relative to imports of goods and services, exports drop from 22.1% of GDP in 2011-2015 to 13% in 2016- 2019 as against increase in imports from 14.2% to 15.5%, respectively in the same period.
Moreover, gross national expenditure fluctuates over the years from 98.7% to 103% of GDP as fiscal balance rises from 2.4% to 3% of GDP, respectively from 1981-1985 to 2016-2019. But then, as countries are committed to servicing their loan obligations, including interest accrued, the compounding arrangement always makes debt servicing as large as the principal stock. In this regard, Nigeria’s foreign debt service payments increases from ₦0.03 billion in the 1970s to ₦415.66 billion in 2010 and continuously to ₦1.06 trillion, ₦1.584 trillion and ₦1.959 trillion in 2015, 2016 and 2017, respectively (CBN, 2019). In effect, as depicted in Figure 1, the country’s debt-to- GDP rises steadily from 17.5% in 2014 to 34.98% in 2020 (NBS, 2021).
R EVIEW OF LITERATURE
The review of literature is carried out in two subsections. While the first subsection conceptualises and discusses the measures of fiscal stability and sustainability as regard debt-GDP ratio, the second buttresses the justification for conducting the research through the review of several relevant empirical studies as follows.
Concept and Measure of Fiscal Stability and Sustainability
Conceptually, the fiscal stability of an economy implies its ability to meet total public debt obligation in the short-run. This is in contrast to fiscal sustainability which looks at debt obligations in the long-run. Thus, the evaluation of fiscal stability and/or sustainability of a country implies analysis of its fiscal soundness (Giammarioli et al, 2006; IMF, 2006). Moreover, while a healthy public finance rests on government’s capacity to raise revenue or reduce expenditure, the short- and long-run soundness are nonetheless connected by market investors. In effect, the ability of government to meet every upcoming obligation in the short-run characterizes a stable public finance or fiscal stability;
while maintaining solvency by keeping debt-GDP ratio below a threshold or ceiling, and servicing existing debt with accumulated interest through surpluses characterizes a sustainable public finance or fiscal sustainability. Thus, in a situation when observed debt- GDP ratio could not meet the inter-temporal budget constraint, then there is fiscal unsustainability.
Governments and policy makers worry about fiscal sustainability because unsustainability leads to potential vicious circle where increasing debt gives rise to higher interest payments which leads to deficit then to more borrowing and more debt. In essence, fiscal
sustainability refers to a situation when the government is able to achieve a fiscal stance that allows it to service public debt in the medium and long run without debt default or renegotiation, without the need to undertake policy adjustments that are implausible from an economic or political standpoint given financing costs and conditions it faces. Thus, fiscal sustainability implies government’s ability to maintain solvency, sustain current spending, and tax policy while promised expenditure or long-term financial obligations are not undermined (Elendu, 2017).
Regarding the measure of fiscal stability and sustainability, both are measured using the same indicator. A commonly used and most straight forward indicator is the debt-GDP ratio which could either be net or gross government debt as percentage of GDP, as the case may be. Thus, the debt ratio is otherwise referred to as net-debt-GDP ratio or gross-debt-to-GDP ratio. By net debt, it represents the difference between gross debt and financial assets such as shares and bonds held by the government. Although this is more relevant to certain extent of selling financial assets to service debts, however, its weakness is the difficulty in assessing the actual availability of an asset as liquid for the settlement of liabilities. In essence, a high and increasing debt ratio signals potential solvency problem. As such, a declining debt-to-GDP ratio is used by governments to regain or signal their ability to maintain long-term solvency. Specifically, to gross debt ratio, some of its potent advantages over other fiscal ratios include the fact that it is easy to interpret and its underlying data are readily available as well as relatively reliable. More importantly, gross debt ratio is an indicator frequently supported by the IMF for stabilization programmes (Giammarioli et al, 2006). A major demerit of the gross debt ratio, however, is the absence of a clear theoretical or practical postulation of what level of debt is acceptable as threat to the fiscal stability and sustainability of an economy. Other drawbacks include the ratio’s inability to explain ex ante the sustainability of public finances as gross debt, unlike net-debt, ratio does not take into account assets that could easily be liquidated for gross debt repayment. More so, another likely measure for fiscal stability is debt-to-revenue ratio. However, this indicator is also limited by the difficulty in determining an ex ante threshold appropriately (Mink & Rodrigues- Vives, 2004).
Empirics
Relevant empirical studies on stability and/or sustainability cut across economies even though the underlying effects of macroeconomic factors vary from country to country. Thus, for example, while examining how fiscal instability affect economic growth in Nigeria, Akanni and Osinowo (2013) use time series data over the period 1970-2010. As fiscal spending and output are measured respectively with Hodrick-Prescot (HP)-filtered and correlation
technique, the study affirms a highly volatile real GDP and fiscal spending in the sub-period 1970-1985, a countercyclical spending over 1970-1986, and a relatively stationary spending, as well as unstable real GDP between 1987 and 2010. It concludes that for sustainable economic environment, fiscal discipline is required in Nigeria. Also, in the assessment of the relationship between fiscal sustainability and financial stability, Komarkova, et al (2013) illustrates the need to take into cognizance the depth at which debt sustainability depends on both the debt-GDP ratio and the macroeconomic environment as regard growth and interest rates. Essentially, the discussion mainly surrounds tools of prudential policy that are suitable for reducing balance sheets’ sovereign risk. In conclusion, thus, the paper asserts that growth in the interdependence of financial and fiscal stability is in tandem with growth in the government-financial sector interaction. In review, however, it is observed that the paper is not specific on the period covered in its analysis. Specifically, given that financial and macroeconomic variables are dynamic in nature, a study on the behaviour of such variables should be carried out in consideration of time. The consideration of time would have necessarily provided the basis for comparing the dynamics of the variables among different studies conducted at different time periods.
Furthermore, Ayinde (2014) examines the sustainability of fiscal management in Nigeria during the period 1970-2011. Consequent upon employing a barrage of tests in light of disaggregated components of government expenditure, the results reveal both strong and weak unsustainability of fiscal policy in Nigeria.
Also, findings show that government’s fiscal operations change in tandem with regimes such that fiscal policies sustainability remains elusive in the country. Similarly, in the quest to determine whether, or not, the Nigerian government violates inter-temporal budget constraint during the period 1980-2010, Oyeleke and Ajilore (2014) investigate the sustainability of fiscal policy in the country. While adopting error correction technique, the study also uses Engle-Granger cointegration method to ascertain the long-run relationship between government revenue and expenditure. In the review of the paper, it is observed that the result of unit root test shows that the variables are integrated at orders 0 and 1 which implies that Engle and Granger technique is not suitable for the cointegrating analysis (Engle & Granger, 1987).
Rather, Autoregressive Distributed Lag (ARDL) techniques would have been appropriate because of its suitability for series that are integrated fractionally, or of order 0 and 1 (Pesaran & Shin, 1999; Pesaran et al., 2001). In effect, the use of ARDL would have afforded the paper a more robust result. Also, in the attempt to examine the existence of threshold effects between public debt and growth in Nigeria, Omotosho at al.
(2016) use quarterly data over the period 2005-2015.
The Khan and Senhadji (2001) approach reveals an inverted U-shape relationship as threshold level of
73.7% of GDP is identified as against 49.4 and 30.9%
inflexion points for external and domestic debts, respectively. The findings imply, according to the study, that accumulated debt in excess of the estimated threshold will impact growth negatively as records show an excessive debt above threshold level prior to debt forgiveness in 2005. In conclusion, however, a window of opportunities is suggested to be open for additional external debt accumulation for the country.
Moreover, as annual event, Nigeria’s Debt Management Office (2017) conducts its debt sustainability analysis (DSA) exercise for Nigeria by adopting World Bank/IMF debt sustainability framework for low-income countries (DSF-LICs) using debt stress categorisation methodology and by considering the baseline, optimistic and pessimistic scenarios. Thus, on the basis of external debt sustainability analysis, the baseline scenario affirms that the country’s external debt portfolio maintains a low risk debt stress as debt ratios fall below respective thresholds throughout 2017-2033, the projection period. Similarly, the fiscal sustainability analysis reveals that total public debt-to-GDP ratio is also below its threshold throughout the projection period.
However, while there is a considerable rise in the ratios of total public debt-to-GDP and total debt service-to- revenue, the study calls for revenue expansion, as well as diversifying the sources of the country’s revenues away from oil. However, in another study which attempts to assess the fiscal sustainability path of Nigeria given the 2018 budget and the country’s debt plan, Elendu (2017) identifies conditions that should be avoided; those that hinder growth, raise tax burdens, or shift large proportion of costs to future generation. In conclusion, the paper asserts that fiscal sustainability can be maintained in Nigeria if investment is directed towards educating the workforce, if there is provision of efficient transportation system, innovative entrepreneurs, infrastructural development, and supporting small scale businesses. In review, however, it is observed that Elendu’s paper does not mention the methodology adopted for the analysis that leads to its findings and conclusion. A mention of the methodology would have lent some credence to the paper as the steps and procedures leading to the findings would have been informative.
In addition, while examining the components of fiscal financing that are effective for solvency in Nigeria, Kolawole (2019) assesses the relationship between fiscal financing and sustainability in the country from 1981 to 2015. As a one-way causal effect is established from each of the components of financing to sustainability, the ARDL technique reveals a significantly positive impact of domestic financing on fiscal sustainability in both short- and long-runs. In addition, the results show that oil revenue and GDP growth impacts positively in the short-run as against negative effect from real interest rate in the long-run. The study thus concludes that foreign financing is not effective for sustaining the country’s
debt obligation. Also, in the attempt to ascertain whether, or not, fiscal policy is sustainable in the long- run, Ogiji and Ajayi (2020) employs data between the period 2000:Q1 and 2018:Q4 to establish the adequacy of fiscal measure adopted by the government in Nigeria. By adopting a fiscal reaction model along with ARDL technique, the study finds that as a measure of primary balance, the ratio of public debt-to-GDP is significantly negative which signals a considerable pressure for the country to run primary surpluses in the future. Thus, an improved revenue generation capacity and expenditure switching strategies are recommended.
Meanwhile, in a panel of 11 countries in the Eurozone, Paniagua et al. (2017) examine public finance sustainability during the period from 1970 to 2014. Using an empirical approach, as against the standard univariate estimation, the paper considers primary surpluses and its components which include tax revenue, government spending and gross debt ratio for analysis. The results reveal that public resources that are meant for bail out of countries end up triggering heterogenous effective fiscal responses from different countries. In review, since the paper uses a dynamic panel specification, it could have adopted the Blundell and Bond (1998) system Generalized Method of Moment (GMM). Being appropriate for dynamic panel analysis, the system GMM would have taken care of countries heterogeneity and revealed a robust result.
Thus, given the brief literature above, the review shows that none of the studies specifically considers the short-run analysis of the situation of debt as regards fiscal stability in relation to the macroeconomic environment. This gap, in essence, affirms the justification for the present study.
A NALYTICAL FRAMEWORK AND METHODOLOGY
Analytical Framework
The analytical framework is built on two approaches: fundamentals-based and expectation-based approaches. Basically, these approaches give insight to the reason financial creditors may stop lending to governments (Giammarioli et al., 2006). Thus, the fundamentals-based approach is concerned with the failure of the government to sustain its debt obligations thereby forcing investors to deny the government further access to financing. On the other hand, the expectation-based approach concentrates on the supplier side in the form that the government may be shut off from external financing when lenders are not able to coordinate activities among themselves. In this approach, even if all the lenders collectively agreed to advance finance to a government, any individual creditor among others can choose to act independently by refusing to provide loan to the government despite the group’s acceptance of the sustainability of the fiscal
position of the government in the long-run. This behaviour thus implies the expectation that a government may default in payment. Hence, in this approach, the concern of creditors is not the sustainability of debt position, but rather the ability of government to honour debt obligations in the short-run.
As such, while the interest of one approach is the sustainability of the government’s debt obligations the other is rather concerned with the ability of government to service its debt in the short-run, even if the debt position is sustainable (Cohen & Portes, 2004). Therefore, as the expectation-based approach models financial markets in relation to domestic financing, the fundamentals-based rather models the market relative to foreign financing. In essence, since both domestic and foreign financing are important for debt analysis, then both variables influence fiscal stability with inevitable consideration for the role of interest rate.
Methodology
The assessment of the relationship between fiscal stability and macroeconomic environment in Nigeria adopts a single multivariate equation. Thus, gross debt- to-GDP ratio is proxy for fiscal stability and serves as dependent variable. The independent variables include real GDP growth rate, total revenue, real interest rate, exchange rate, total debt, and fiscal balance (Chalk &
Hemming, 2000; Burnside, 2004; Giammarioli et al., 2006). Invariably, total debt is obtained from the addition of external debt and domestic debt while total revenue results from the summation of oil revenue and non-oil revenue. In effect, due to the fact that the country has history of debt overhang and forgiveness amid multiple revenue strategies,vi the study uses annual time series data covering 39 years over the period 1981-2019. As such, pre-estimation exercise commences with Dickey-Fuller breakpoint minimum tests, followed by the stationarity tests using the Augmented Dickey-Fuller (ADF) of Dickey and Fuller (1979), the techniques of Phillips and Perron (PP) (1988) and Kwiatkowski, Phillips, Schmidt and Shin (KPSS) (1992). The causality tests follow through the approach of Granger (1988). However, for the reason to obtain a uniform scale of measurement, as well as to ease the interpretation of results, data for fiscal stability, total revenue and total debt are transformed from nominal to natural logarithms.
Meanwhile, the paper follows the fundamentals- based approach which recognises, in addition to changes in macroeconomic variables, that the determinants of fiscal sustainability also affect fiscal stability. Thus, following the theoretical works of Giammarioli et al, (2006) and Gottschalk (2014), as well as Kolawole (2019) on the empirical front, the expression capturing the relationship between fiscal stability and macroeconomic factors is stated as follows.
𝐹𝐹𝐹𝐹𝐹𝐹𝑡𝑡=𝑓𝑓(𝐺𝐺𝐺𝐺𝐹𝐹𝑡𝑡,𝑅𝑅𝑅𝑅𝑅𝑅𝑡𝑡,𝑅𝑅𝑅𝑅𝐺𝐺𝑡𝑡,𝑋𝑋𝐺𝐺𝐹𝐹𝑡𝑡,𝐷𝐷𝐷𝐷𝐹𝐹𝑡𝑡,𝐹𝐹𝐷𝐷𝑎𝑎𝑎𝑎𝑡𝑡)
(1) where, at time t, Fst is fiscal stability measured as gross debt-to-GDP ratio, Grt is real GDP growth rate as annual percentage of GDP whose aggregates are based on constant 2005 U.S. dollars, Rev is total revenue made up of oil and non-oil revenue including intergovernmental transfer but excluding noncash transactions, Rir is real interest rate which is the lending interest rate adjusted for inflation and measured by the GDP deflator, Xrt is official exchange rate and refers to the exchange rate calculated as an annual average based on monthly averages in local currency relative to the U.S. dollar, Dbt is total public debt which consists of all liabilities that require payment or payments of interest and/or principal and is measured as a stock, and Fbal is fiscal balance between revenue and expenditure and is measured as % of GDP.
Data for all the variables are collated from CBN (2019), NBS (2021) and World Bank (2021).
The linear transformation of equation (1) becomes, 𝐹𝐹𝐹𝐹𝐹𝐹𝑡𝑡=𝛽𝛽0+𝛽𝛽1𝐺𝐺𝐺𝐺𝐹𝐹𝑡𝑡+𝛽𝛽2𝑅𝑅𝑅𝑅𝑅𝑅𝑡𝑡+𝛽𝛽3𝑅𝑅𝑅𝑅𝐺𝐺𝑡𝑡+𝛽𝛽4𝑋𝑋𝐺𝐺𝐹𝐹𝑡𝑡+𝛽𝛽5𝐷𝐷𝐷𝐷𝐹𝐹𝑡𝑡
+𝛽𝛽6𝐹𝐹𝐷𝐷𝑎𝑎𝑎𝑎𝑡𝑡+𝜀𝜀𝑡𝑡
(2) where, 𝛽𝛽0 is slope while 𝛽𝛽1, . . ., 𝛽𝛽6 are parameters, and 𝜀𝜀 is error term. The a priori expectation is that growth rate and revenue would have positive impact on fiscal stability, as against negative impact from other variables.
Specifically, equation (2) states explicitly that fiscal stability is determined in the right-hand-side by certain macroeconomic factors. However, because of the short-run analysis of the exercise, the following vector autoregressive (VAR) model of order p is necessarily
required to capture the impacts of the right-hand-side variables on fiscal stability. Thus,
∆𝐹𝐹𝐹𝐹𝐹𝐹𝑡𝑡=∑𝑝𝑝 𝛾𝛾𝑖𝑖1∆𝐹𝐹𝐹𝐹𝐹𝐹𝑡𝑡−1
𝑖𝑖=0 +∑𝑝𝑝 𝛾𝛾2𝑖𝑖∆𝐺𝐺𝐺𝐺𝐹𝐹𝑡𝑡−1
𝑖𝑖=0 +
∑𝑝𝑝 𝛾𝛾31∆𝑅𝑅𝑅𝑅𝑅𝑅𝑡𝑡−1
𝑖𝑖=0 +∑𝑝𝑝 𝛾𝛾4𝑖𝑖∆𝑅𝑅𝑅𝑅𝐺𝐺𝑡𝑡−1
𝑖𝑖=0 +
∑𝑝𝑝𝑖𝑖=0𝛾𝛾5𝑖𝑖∆𝑋𝑋𝐺𝐺𝐹𝐹𝑡𝑡−1+∑𝑝𝑝𝑖𝑖=0𝛾𝛾6𝑖𝑖∆𝐷𝐷𝐷𝐷𝐹𝐹𝑡𝑡−1+
∑𝑝𝑝 𝛾𝛾7𝑖𝑖∆𝐹𝐹𝐷𝐷𝑎𝑎𝑎𝑎𝑡𝑡−1
𝑖𝑖=0 + 𝛿𝛿𝛿𝛿𝛿𝛿𝛿𝛿𝑡𝑡−1 + 𝑢𝑢𝑡𝑡
(3) where, ∆ is the change operator, 𝛿𝛿 is the speed of adjustment parameter, ECT is the residual from the co- integrating relationship among the variables, and u is error term.
R ESULTS AND DISCUSSION
The outcome from the analysis of the relationship between fiscal stability and macroeconomic environment is sectioned into pre-estimation results and estimation results, as presented and discussed, as follows.
Pre-estimation results
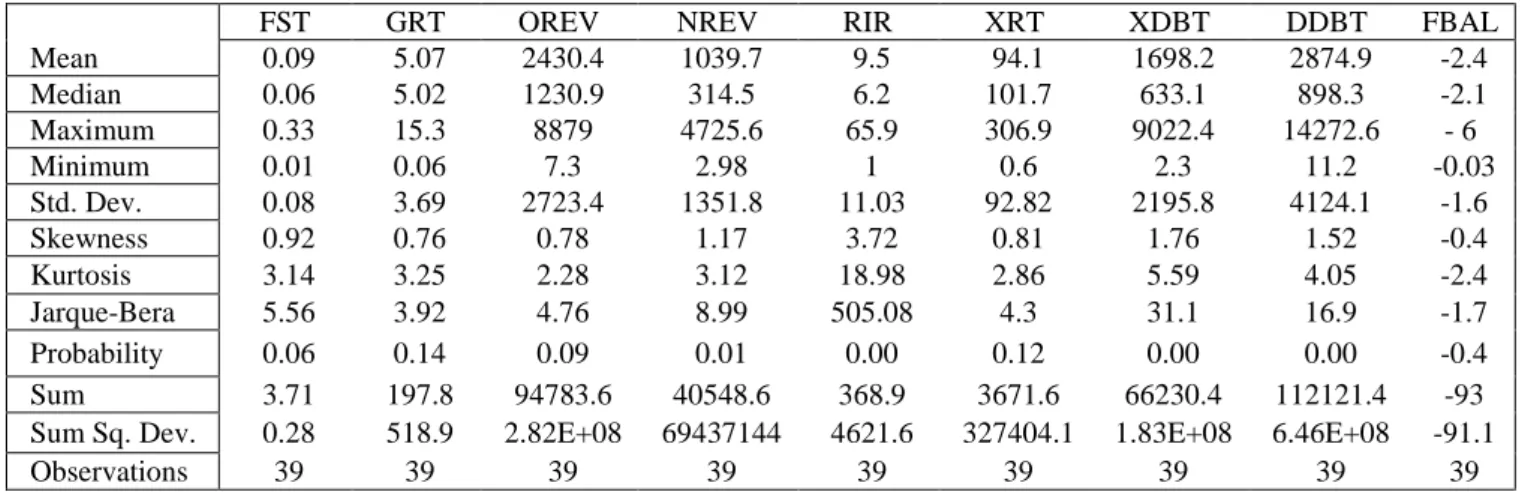
The descriptive statistics in Table 2 shows the average revenue from oil reaching ₦2,430.4 billion as against ₦1,039.7 billion from the non-oil sector while external debt and domestic debt are averagely
₦1,698.2 billion and ₦2,874.9 billion, respectively.
These statistics explicitly give room for the fear of debt sustainability as the country’s revenue performance could not have marched its debt profile, even as the economy experiences an average 5% growth, over the period 1981-2019.
Table 2 Descriptive statistics
FST GRT OREV NREV RIR XRT XDBT DDBT FBAL
Mean 0.09 5.07 2430.4 1039.7 9.5 94.1 1698.2 2874.9 -2.4 Median 0.06 5.02 1230.9 314.5 6.2 101.7 633.1 898.3 -2.1 Maximum 0.33 15.3 8879 4725.6 65.9 306.9 9022.4 14272.6 - 6
Minimum 0.01 0.06 7.3 2.98 1 0.6 2.3 11.2 -0.03
Std. Dev. 0.08 3.69 2723.4 1351.8 11.03 92.82 2195.8 4124.1 -1.6
Skewness 0.92 0.76 0.78 1.17 3.72 0.81 1.76 1.52 -0.4
Kurtosis 3.14 3.25 2.28 3.12 18.98 2.86 5.59 4.05 -2.4
Jarque-Bera 5.56 3.92 4.76 8.99 505.08 4.3 31.1 16.9 -1.7 Probability 0.06 0.14 0.09 0.01 0.00 0.12 0.00 0.00 -0.4 Sum 3.71 197.8 94783.6 40548.6 368.9 3671.6 66230.4 112121.4 -93 Sum Sq. Dev. 0.28 518.9 2.82E+08 69437144 4621.6 327404.1 1.83E+08 6.46E+08 -91.1
Observations 39 39 39 39 39 39 39 39 39
Source: Author’s computation.
Meanwhile, following Harvey et al. (2013), the results of the Dickey-Fuller breakpoint minimum tests in Table 3 serves as precursor to the unit-root tests
whose results reject the null-hypothesis of non- stationarity for total revenue, exchange rate, and total debt as presented in Table 4. In this regard, the pre-
estimation tests continue with the structural break methodology of Bai and Perron (2003) to ascertain the possibility of multiple breaks in the series.
Table 3
Results of Dickey-Fuller breakpoint minimum tests.
Series Fst Grt Rev Rir Xrt Dbt Fbal
Critical value -3.52 -5.59 -5.02 -15.2 -1.02 -3.32 -4.25
Probability 0.37 0.01 0.68 0.01 0.99 0.49 0.09
Break date 2009 1999 1986 1995 2014 2009 2000
Source: Author’s computation. Note: Decisions are based on 5% level of significance.
Essentially, the not-so-frequent disparity in the outputs of ADF and PP, as obtained in the tests involving GDP growth rate in Table 4, necessitates the
inclusion and adoption of KPSS. In effect, as KPSS affirms an I(0) status for GDP growth rate, the variable is therefore adjudged as I(0).
Table 4
Results of unit-root tests
ADF PP KPSS
Variable Level 1st Diff Dec Level 1st Diff Dec Level 1st Diff Dec
Fst -4.71 - I(0) -4.24 - I(0) 0.64 - I(0)
Grt -2.45 -13.53 I(1) -5.25 - I(0) 0.10 - I(0)
Rev -1.28 -4.95 I(1) -1.34 -6.25 I(1) 0.71 0.26 I(1)
Rir -2.38 - I(0) -6.03 - I(0) 0.21 - I(0)
Xrt -2.07 -4.50 I(1) -1.51 -4.24 I(1) 0.72 0.06 I(1) Dbt -2.64 -4.43 I(1) -2.41 -4.44 I(1) 0.71 0.34 I(1)
Fbal -3.13 - I(0) -3.14 - I(0) 0.29 - I(0)
Source: Author's computation. Note: Decisions are based on 5% level of significance.
Moreover, the significant values of F-statistics in the Bai and Perron (2003) results in Table 5 affirm the presence of multiple breakpoints in 1994 and 2008;
1996 and 2008; and 1994 and 2007 for total revenue, exchange rate, and total public debt, respectively.
Table 5
Result extract from Bai and Perron tests
Series Break Dates F-stat(1) Critical value(1) F-stat(2) Critical value(2)
Rev 1994, 2008 2144.065 9.03 57.54701 10.14
Xrt 1996, 2008 2291.166 9.11 58.91113 10.33
Dbt 1994, 2007 2418.301 9.15 62.79121 11.24
Source: Author’s computation.
Nonetheless, following the approach of Perron (1989) and Weideman (2016) to understand whether, or not, the breaks in the series are the reasons for their non-stationarity at level, each of the series is partitioned into segments which are then further tested for stationarity. Consequently, the results of the tests, as presented in Table 6, suggest that the stationarity of the segments implies that non-stationarity of the series, before partitioning, is actually due to the breaks in trend.
Thus, the 1994 break in revenue series could be ascribed to the effect from the introduction of VAT in
1993 which phases out the regime of ‘Sales Tax’ in the country. The VAT introduction probably causes an increase in non-oil revenue to ₦41.72 billion in 1994 from ₦30.67 billion in 1993 as against reduction in oil revenue to ₦160.19 billion from ₦162.1 billion, respectively. The break in 2008 could, however, be traced to the collective effects of tax reforms in 2004 as well as the passage of the FIRS Establishment Act in 2007. Therefore, as part of the reforms, the funding autonomy propels revenue collection such that, in comparison to ₦1.2 trillion in 2004, the actual tax collection rises to ₦2.972 trillion in 2008 even as
against ₦2.682 trillion collected over the period 1996- 2003 (Okauru, 2012; Trustees of Princeton University, 2012). More so, the break in foreign exchange in 1996 results probably from the cumulative effects of the reforms and liberalization of the foreign exchange market in 1994 and 1995, respectively. Essentially, the 1994 policy, in reaction to the volatility in the exchange rates, pegs the value of the local currency against foreign currencies, centralizes foreign exchange in the CBN, and restricts the Bureaux de Change to buy foreign exchange as agents of the CBN, among others. The 1995 policy, however, liberalizes the foreign exchange market following the introduction of an autonomous foreign exchange market (AFEM) by the apex bank. As such, the average AFEM rate appreciates from ₦82.33 per dollar in 1995 to ₦81.48 to a dollar in 1996. In addition, the 2008 break reflects the combined effects of policies which include the introduction of whole sale Dutch auction system (WSDAS) as well as the completion of consolidation in the banking industry in 2006, and the 2007 appointment of additional two banks to collect the Nigerian exports supervision scheme (NESS) fees. In
effect, aside the experience of stability in the liberalized foreign exchange market, Nigeria’s net international investment position climbs steadily from -
$21,945.18 million in 2005 to $14,722.01 million in 2008 with debt securities improving, respectively from
$276.56 million to $1,256.55 million (CBN, 2019, 2021b). As regards debt series, the 1994 break is traceable to the effect of the decline in the country’s external reserve in 1993 as a result of oil price slump coupled with persistent high debt service payment (Kalu, 1994). However, the 2007 break is ascribed to the ripple effect of the discussions surrounding the sustainability of the country’s debt which eventually resulted into debt forgiveness by the London and Paris clubs in 2005. Also, the break is linked to the servicing of promissory notes and meeting bilateral commitments in 2006 which culminated in a significant reduction in the country’s foreign debt profile from ₦2,695 billion in 2005 to ₦438.89 billion in 2007, and the total public debt from ₦4,220 billion to ₦2,608 billion in the same period (CBN, 2019;
Kolawole, 2020).
Table 6
Results of stationarity tests on individual segment.
Segments R1 R2 R3 X1 X2 X3 D1 D2 D3
Year 1981-93 1994-07 2008-19 1981-95 1996-07 2008-19 1981-93 1994-06 2007-19
ADF -3.22 -4.24 -4.62 -5.44 -4.58 -3.21 -4.49 -3.99 -4.11
PP -3.22 -4.34 -4.64 -5.44 -4.57 -3.21 -4.49 -3.99 -4.11
KPSS 0.11 0.12 0.15 0.11 0.11 0.1 0.16 0.16 0.12
Conclusion S S S S S S S S S
Source: Author’s computation. Note: R = Revenue; X = Exchange rate; D = Debt; and S = Stationary.
Meanwhile, there is the necessity to capture the effects of breaks in the respective dates. In this regard, and following Bai and Perron (2003), the comparable equations in Table 7 are estimated. In each of the equations, C is constant intercept term, T is time as trend variable, D is dummy variable which starts as 1 for the break date as well as the subsequent years, and
0 for the years before the break. Therefore, the 1994 dummy is 0 from 1981 to 1993 and 1 from 1994 to 2019; the 1996 dummy is 0 from 1981 to 1995 and 1 from 1996 to 2019; the 2007 dummy is 0 from 1981 to 2006 and 1 from 2007 to 2019; and the 2008 dummy is 0 from 1981 to 2007, and 1 from 2008 to 2019.
Table 7
Equations to be estimated based upon Bai and Perron results.
Series Equations Break Dates
Rev 𝑅𝑅𝑅𝑅𝑅𝑅𝑡𝑡= C+𝐷𝐷1994+𝐷𝐷2008+T+𝐷𝐷1994T+𝐷𝐷2008T+𝜇𝜇𝑡𝑡 1994, 2008 Xrt 𝑋𝑋𝐺𝐺𝐹𝐹𝑡𝑡= C+𝐷𝐷1996+𝐷𝐷2008+T+𝐷𝐷1996T+𝐷𝐷2008T+𝜇𝜇𝑡𝑡 1996, 2008 Dbt 𝐷𝐷𝐷𝐷𝐹𝐹𝑡𝑡= C+𝐷𝐷1994+𝐷𝐷2007+T+𝐷𝐷1994T+𝐷𝐷2007T+𝜇𝜇𝑡𝑡 1994, 2007 Source: Author’s specification.
Table 8
Lag order selection criteria
Lag LogL LR FPE AIC SC HQ
0 -533.5485 NA 25989.18 30.03047 30.33838 30.13794 1 -276.0405 400.5680* 0.255212 18.44670 20.90995* 19.30644 2 -227.9060 56.15690 0.370623 18.49478 23.11338 20.10679 3 -149.9509 60.63180 0.204981* 16.88616* 23.66010 19.25045*
Source: Author's computation.
Very imperative is the need to ascertain the causal relationship between a respective pair of the variables.
In this regard, the lag length selection is conducted and the result is presented in Table 8 in which majority of the criteria select a lag of 3.
Thus, following the lag length selection, the pairwise causality results in Table 9 reveal feed-back effects between fiscal stability and real interest rate.
Incidentally, however, in a one-way causality, fiscal stability appears to be Granger-caused by each of growth rate, revenue, exchange rate, debt, and fiscal balance. Imperatively, the null hypothesis of the relationship is that there is Granger no-causality between a pair of variables. Thus, the null is accepted if the probability value is above 5%, otherwise it is rejected.
Table 9
Abridged results from pairwise Granger-causality tests.
Null Hypothesis: Obs F-Statistic Prob.
GRT does not Granger Cause FST 36 5.7968 0.0088
FST does not Granger Cause GRT 36 0.6592 0.5241
REV does not Granger Cause FST 36 6.4797 0.0011
FST does not Granger Cause REV 36 1.7828 0.1845
RIR does not Granger Cause FST 36 4.0162 0.0214
FST does not Granger Cause RIR 36 5.5763 0.0114
XRT does not Granger Cause FST 36 5.3941 0.0131
FST does not Granger Cause XRT 36 0.3588 0.7013
DBT does not Granger Cause FST 36 6.3934 0.0012
FST does not Granger Cause DBT 36 0.5001 0.6111
FBAL does not Granger Cause FST 36 5.9806 0.0062
FST does not Granger Cause FBAL 36 0.3412 0.7134
Source: Author’s computation. Note: Decisions are based on 5% level of significance.
Estimation Results
As presented in Table 10, and contrary to expectation, real GDP growth rate bears negative effect on fiscal stability as debt obligation becomes 8 percentage point stable given 10% fall in the rate of growth. In other words, a rise in GDP growth rate inhibits government’s compliance with debt obligation in the short-run. The negative effect of GDP growth rate reflects the situation in which rising debt drags growth backward due to dwindling revenue and rising spending (Cecchetti et al., 2010; Kumar & Woo, 2010).
Also, an increase in the stock of public debt causes fiscal instability as a 10% addition to the stock of outstanding public debt results in 1.8 % point reduction in the ability of the government to pay debt. This, as a matter of fact, reflects IMF’s worry over the country’s ability to repay its rising external debt, even though the government claims that the debt is sustainable (Oketola
& Ameh, 2019). Imperatively, excessive debt impacts negatively on growth and development as the ability of government to implement desired policy is weakened when increasing percentage of revenue is devoted to debt-service payments (Gottschalk, 2014). The
findings notwithstanding, IMF (2010) affirms that countries with significantly lower debt-GDP ratio may likely experience debt distress if they operate in a weaker policy and institutional environment.
Regarding exchange rate, as expected, results imply that as the country’s currency appreciates, the country becomes more fiscally stable in meeting its debt obligation. Numerically, that is to say, a 10%
appreciation in the rate at which the local currency is exchanged for the dollar brings about 1.1 % point increase in the ability of the government to comply with its debt obligation in the short-run. This situation gives space to the relevance of the view of Basdevant and de Wet (2000) that exchange rate dynamism correlates with debt unsustainability. That is, when exchange rate depreciates, the debt burden increases relative to the domestic currency. However, where a country’s debt is substantially foreign currency denominated, the best option for sustainability is to stabilize the exchange rate. As such, in this case, the idea of depreciating domestic currency to discourage imports and stimulate exports would not be a considerable option to policy makers.
Table 10
Impacts of macroeconomic factors on fiscal stability in the short-run
Short-run estimates: Dependent variable: ∆𝐹𝐹𝐹𝐹𝐹𝐹
Variable Coefficient S-Error t-statistic Probability
C 2.04 0.03 0.59 0.41
∆𝐹𝐹𝐹𝐹𝐹𝐹(−1) 0.21 0.15 5.71 0.00
∆𝐺𝐺𝐺𝐺𝐹𝐹(−1) -0.08 0.16 -5.23 0.00
∆𝑅𝑅𝑅𝑅𝑅𝑅(−1) 0.09 0.12 4.82 0.03
∆𝑅𝑅𝑅𝑅𝐺𝐺(−1) -0.21 1.14 -0.54 0.24
∆𝑋𝑋𝐺𝐺𝐹𝐹(−1) -0.11 0.17 -5.38 0.00
∆𝐷𝐷𝐷𝐷𝐹𝐹(−1) -0.16 0.11 -5.51 0.00
∆𝐹𝐹𝐷𝐷𝑎𝑎𝑎𝑎(−1) 0.31 1.77 0.94 0.62
ECT (-1) -0.82 0.18 -5.11 0.01
Adj R2 0.73
F-Stat 32.57 0.00
DW-stat 1.76
Source: Author’s computation. Note: Decisions are based on 5% level of significance.
Furthermore, and in conformity to expectation, total revenue propels fiscal stability positively given that a 10% increase in revenue translates into an approximately 1.0 % point rise in the government’s compliance with debt obligation. That is, the more the revenue falls, the more it becomes difficult for the government to repay the country’s debt in the short- run. Essentially, as spending outpaces revenue with debt burden becoming worrisome, the need to increase non-oil tax revenue is paramount as observed in the finance Act 2020 where amendments are made to some extant tax laws (Oxford-Analytica, 2019; Financial Derivatives Company, 2020). Thus, the drive to boost revenue collections by relevant government agencies is a pointer to sustaining the country’s debt. However, with respect to real interest rate, the results suggest that interest rate affects debt obligation negatively, but not significantly in the short-run. But then, there are two sides to the explanation regarding the effect of interest rate. The one side argues that as public debt increases, interest rate is expected to increase as investors demand higher interest premium in compensation for
government defaults. The other, however, holds that in a recession where savings are surplus, and inflation is low, higher level of debt might not bring about a rise in real interest rate (Pettinger, 2018). Also, as numerous short-term variables affect fiscal stability, Komarkova, Dingova and Komarek (2013) assert the importance of interest rate when considering the sustainability of debt. Generally, the model adjusts back to long-run equilibrium with a speed of 82% as indicated by the coefficient of error correction term, Ect.
Moreover, in comparison to the baseline short-run results, the outcome of the estimation of equations in Table 7, as well as the effects of the breaks, are presented in Tables 11 and 12, respectively. As it stands in Table 11, the columns for Constant and Trend show the values for short-run estimates, while the columns for Constants and Trends in 1994, 1996, 2007 and 2008 indicate the values as departure from the baseline. In effect, the departure from the baseline result shows in Table 12 that, despite the breaks, revenue consistently has significant positive impact on fiscal stability in Nigeria.
Table 11
OLS results from the estimation of equations in Table 7
Series C C-1994 C-1996 C- 2007
C-
2008 T T-1994 T-
1996 T-2007 T-2008
Trev 2.04 0.081** - - 0.09* -1.1 0.03** - - 0.01**
Xrt 2.04 - 0.07** - 0.06* -1.1 - 0.03** - 0.01**
Dbt 2.04 0.08** - 0.07* - -1.1 0.06** - 0.02** -
Source: Author’s computation. Note: * and ** denote significance at 1 and 5%, respectively.
The results, however, show a significantly positive effect of exchange rate. That is to say, that domestic currency depreciation leads to fiscal instability over the break periods. As regards debt, the results show that, if
there were no breaks, the negative impact of debt would be less devastating on the country’s solvency in the short-run.
Table 12
OLS results of the effect of breaks
Variable Coeff Std Error t-stat Prob
Trev 0.13 0.12 5.68 0.01
Xrt 0.06 0.14 5.44 0.03
Dbt -0.08 0.11 -5.91 0.00
Adj R2 0.63
F-stat 22.81 0.00
DW 1.73
Source: Author’s computation. Note: Decisions are based on 5% level of significance.
C ONCLUSION AND POLICY IMPLICATIONS
This paper focuses on the relationship between fiscal stability and macroeconomic environment in Nigeria.
Findings reveal that while the country’s currency maintains stability in 2019, external reserves decline to the lowest at $38 billion in the same year. The situation necessarily correlates with the persistent 45% yearly shortfall in actual revenue relative to the target since 2015. In 2012, as crude oil production slows by 2%
and international price climbs mildly by 0.6%, a loss of about ₦853 billion revenue is recorded. Similarly, in 2016, the slump in the price of crude, among other factors, results in revenue shortfall of ₦1.1 trillion. As such, the shortfall in revenues and the fiscal commitment to finance imports, as well as socio- economic infrastructure and budgetary expenditure, constraint the government into borrowing from both foreign and domestic sources. In effect, government efforts at meeting its debt obligation results in structural breaks which provide information on the need for improved revenue collections as well as imminent intervention in the foreign exchange market while debt needs to be kept within short-term stability.
Thus, the whole analysis reveals a mixed relationship subsisting between fiscal stability and certain macroeconomic factors in Nigeria.
Nonetheless, consequent upon the findings, the following recommendations suffice with policy implications. Since revenue is paramount for fiscal stability, government should strive to either review the extant revenue policy of tax reforms or introduce new strategies that would help increase collections in both oil and non-oil sectors. Ordinarily, when revenue collection is improved upon, more money would be available to fund public projects and grow the economy while some parts would be used to repay debt. More so, an increased revenue collection would to a large extent cub the spate of borrowing by the government.
Also, as rising public debt leads to fiscal instability, then the government should, as a necessity, reduce borrowing. If government reduces borrowing, it would, in one hand, save the future generation from burden of repaying the debt they do not owe or benefit from; and on the other hand enhance government’s capacity to comply with debt obligation which would invariably boost the country’s credit worthiness with investors and creditors. Ordinarily, a creditworthy economy will always find it easy to secure financial assistance whenever the need arises, especially in the short-run.
REFERENCES
AFDB (2021): Nigeria economic outlook. African Development Bank. Retrieved May 26, 2021 from https://www.afdb.org/en/countries-west-africa-nigeria/nigeria-economic-outlook.
AFRICAN ECONOMIC OUTLOOK (2014): Nigeria 2014. Retrieved February 03, 2021 from http://www.africaneconomicoutlook.org
AKANNI, K.A., & OSINOWO, O.H. (2013): Effects of fiscal instability on economic growth in Nigeria. Advances in Economics and Business, 1(2), 124-133. DOI: 10.13189/aeb.2013.010207.
AMAEFULE, E. (PUNCH January 23, 2018): Fg hires consultants to probe minerals sector’s revenue leakages.
Punchnewspaper. Retrieved May 12, 2021 from http://punchng.com/fg-hires-consultants-to-probe-minerals-sectors- revenue-leakages/.
ASU, F. (PUNCH January 3, 2019): IMF warns Nigeria, others as global debt hits $184tn. Punchnewspaper. Retrieved May 16, 2021 from https://punchng.com/imf-warns-nigeria-others-as-global-debt-hits-184tn/.
AYINDE, T.O. (2014): Sustainable fiscal management in Nigeria: A triangulation analysis. Journal of Economics and Development Studies, 2(2), 2334-2390.
BAI, J., & PERRON, P. (2003): Computation and analysis of multiple structural change models. Journal of Applied Econometrics, 6, 72–78.
BASDEVANT, O., & DE WET, T. (2000): Debt sustainability and exchange stabilization: Towards a new theory, 3(3), 436-445.
BLUNDELL, R., & BOND, S. (1998): Initial conditions and moment restrictions in dynamic panel data models.
Journal of Econometrics, 87, 115-143.
BURMSIDE, C. (2004): Fiscal sustainability in theory and practice: Handbook. Retrieved July 12, 2021 from https://www.amazon.com/Fiscal-Sustainability-Theory-Practice- Handbook/dp/082135874X.
CECCHETI, S.G., MOHANTY, M.S., & ZAMPOLI, F. (2010): The future of public debt: Prospects and implications.
BIS Working Papers No. 300, Basel: Bank for International Settlements.
CBN (2019): Statistical bulletin. Central Bank of Nigeria. Retrieved May 22, 2021 from https://www.cbn.gov.ng/documents/statbulletin.asp.
CBN (2021a): Crude oil production, price. Central Bank of Nigeria. Retrieved May 22, 2021 from https://www.cbn.gov.ng/documents/statbulletin.asp.
CBN (2021b): Exchange rate policy. Central Bank of Nigeria. Retrieved May 23, 2021 from https://www.cbn.gov.ng/IntOps/ExchRatePolicy.asp.
CHALK, N., & HEMMING, R. (2000): Assessing fiscal sustainability in theory and practice. IMF Working Paper WP/00/81, International Monetary Fund.
COHEN, D., & PORTES, R. (2004): “Dealing with destabilizing ‘market discipline.’” CEPR, Discussion Paper, No.
4280.
DMO (2017): Report of the annual national debt sustainability analysis. Debt Management Office, Nigeria. Retrieved May 26, 2021 from https://www.dmo.gov.ng/debtsustainabilityreport.
DICKEY, D.A., & FULLER, W.A. (1979): “Distribution of the estimators for autoregressive time series with a unit root”. Journal of the American Statistical Association, 74, 427-431.
ELENDU, K. (2017): Fiscal sustainability: Between Nigeria’s debt plan and the 2018 budget. Retrieved from http://csr- in-action.org/fiscal-sustainability-between-nigerias-debt-plan-and-the-2018-budget/.
ENGLE, R.F., & GRANGER, C.W.J. (1987): “Co-integration and error-correction: Representation, estimation and testing”. Econometrica, 55, 251-276.
FINANCIAL DERIVATIVES COMPANY (2020): FDC monthly economic update. A Financial Derivatives
Company Publication, 10(1), January 15. Retrieved April 21, 2021 from https://trwstockbrokers.files.wordpress.com/2020/01/fdc-economic-december-monthly-update-january-15-2020.pdf.
GIAMMARIOLI, N., NICKEL, C., ROTHER, P., & VIDAL, J-P. (2006): Assessing fiscal soundness: Theory and practice. SSRN Electronic Journal, pp. 637-672. Doi: 10.2139/ssrn.2005166.
GOTTSCHALK, J. (2014). Fiscal and debt sustainability. Fiscal Analysis and Forecasting Workshop. IMF-TAOLAM.
GRANGER, C.W. (1988): Some recent development in a concept of causality. Journal of Econometrics, 39, 199-211.
HARVEY, D.I., LEYBOURNE, S.J., & TAYLOR, A.R. (2013). Testing for unit roots in the possible presence of multiple trend breaks using minimum Dickey-Fuller statistics. Journal of Econometrics, 17(2), 265-284.
IMF (2006): Fiscal adjustment for stability and growth. International Monetary Fund, Washington D.C.
IMF (2010): IMF staff guidance note on the application of the joint fund-bank debt sustainability framework for LICs.
International Monetary Fund. Retrieved July 23, 2021 from http://www.imf.org/staff-guidance-note-on-the- application-of-the-joint-fund-bank-debt- sustainability-framework-for-lics/.
KALU, I.K. (1994): Press briefing on 1994 budget and national rolling plan 1994-1998. New breed magazine, pg.
14.
KHAN, M.S., & SENHADJI, A. S. (2001): Threshold effects in the relationship between inflation and growth. IMF Staff Papers, Vol. 48.
KOLAWOLE, B.O. (2019): Fiscal financing and sustainability in Nigeria: An empirical assessment. In Dauda, R.O.S., Akinleye, S.O., & Balogun, E.D. (eds.) Leading Issues in Macroeconomic Stabilisation and Financial Development: A Festschrift in Honour of Professor Oluwatayo Fakiyesi, pp. 231-249. Akoka, Lagos: University of Lagos Press and Bookshop Ltd.
KOLAWOLE, B.O. (2020): Effect of budget deficit on economic growth in Nigeria. LASU Journal of Economics, 2(1), 17-32.
KOMARKOVA, Z., DINGOVA, V., & KOMAREK, L. (2013): Fiscal sustainability and financial stability. Czech National Bank/ Financial Stability Report, pp. 103-112.
KUMAR, M.S., & WOO, J. (2010): Public debt and growth. IMF Working Paper 10/174, Washington, DC: IMF.
KWIATKOWSKI, D., PHILLIPS, P.C.B., SCHMIDT, P., & SHIN, Y. (1992): Testing the null hypothesis of stationarity against the alternative of a unit root. Journal of Econometrics, 54(1-3), 159-178.
MINK, R., & RODRIGUEZ-VIVES, M. (2004): “The measurement of government debt in the economic and monetary union.” In Public Debt, Roma: Banca d’Italia.
NBS (2021): Key statistics: Gdp, unemployment, cpi. National Bureau of Statistics, Nigeria. Retrieved May 21, 2021 from https://www.nigerianstat.gov.ng.
NWEZE, C. (2019, April 22): N24.39tr debt: Nigeria not in debt crisis, says fed govt. The Nation Retrieved April 28, 2021 from https://thenationonlieng.net/n24-39tr-debt-nigeria-not-in- debt-crisis-says-fed-gov.
Organisation for Economic Co-operation and Development [OECD] (2020): Revenue statistics in Africa 2020 – Nigeria. Retrieved 21 June, 2021 from https://www.oecd.org/ctp/tax-policy/revenue-statistics-africa-nigeria.pdf.
OGILJI, P., & AJAYI, K.J. (2020): Estimating a fiscal reaction function for Nigeria. CBN Journal of Applied Statistics, 11(1), 35-63.
OKAURU, I.O. (2012): Federal inland revenue service and taxation reforms in democratic Nigeria. Nigeria: Safari Books.
OKETOLA, D., & AMEH, J. (PUNCH April 11, 2019): N24.39tn debt: Imf worries over Nigeria’s repayment capacity.
Retrieved 18 July, 2021 from https://punchng.com/n24-39tn-debt-imf-worries-over-nigerias-repayment-capacity/.
OMOTOSHO, B.S., BAWA, S., & DOGUWA, S.I. (2016): Determining the optimal public debt threshold for Nigeria.
CBN Journal of Applied Statistics, 7(2), 1-25.
OXFORD-ANALYTICA (2019): Nigerian government faces critical revenue challenges. Expert Briefings. Retrieved July 8, 2021 from https://doi.org/10.1108/OXAN-DB243574.
OYELEKE, O.J., & AJILORE, O.T. (2014): Analysis of fiscal deficit sustainability in Nigerian economy: An error correction approach. Asian Economic and Financial Review, 4(2), 199-210.
PANIAGUA, J., SAPENA, J., & TAMARIT, C. (2017): Fiscal sustainability in EMU countries: A continued fiscal commitment? Journal of International Financial Markets, Institutions & Money, pp. 1-32. doi:
http://dx.doi.org/10.1016/j.intfin.2017.08.014.
PERRON, P. (1989): The great crash, the oil price shock, and the unit root hypothesis. Econometrica: Journal of the Econometric Society, pp.1361-1401.
PESARAN, H.M., & SHIN, Y. (1999): Autoregressive distributed lag modelling approach to cointegration analysis. In Storm, S. (ed.), Econometric and Economic Theory in the 20th Century (Chapter 11). The Ragner Frisch Centennial Symposium, Cambridge University Press, Cambridge.
PESARAN, M.H., SHIN, Y., & SMITH, R.J. (2001): “Bounds testing approaches to the analysis of level relationship.”
Journal of Applied Economics, 16, 289-326.
PETTINGER, T. (2018): Does higher debt lead to higher interest rates? Retrieved July 19, 2021 from https://www.economicshelp.org/blog/4966/debt/link-between-debt-and-bond-yields/
PHILLIPS, P.C.B., & PERRON, P. (1988): “Testing for a unit root in time series regression.” Biometrika, 75, 335-346.
PROSHARE (2018, December 26): Nigeria prioritizes revenue generation, mulls response to global changes affecting assumptions. Retrieved May 08, 2021 from https://www.proshareng.com/news/NIGERIA%20ECONOMY/Nigeria- Prioritizes-Revenue-Generation-Mulls-Response-To-Global-Changes-AffectingAssumptions/43293.
SUNNEWSONLINE (2021, January 26): FG deficit rises to N4.45tn in 10 months. Retrieved May 15, 2021 from https://www.sunnewsonline.com/fg-deficit-rises-to-n4-45tn-in-10-months/.
TRUSTEES OF PRINCETON UNIVERSITY (2012): A change agent in the tax office: Nigeria’s federal inland revenue service, 2004-2009. Innovations for Successful Societies, Princeton University. Retrieved June 21, 2021 from https://successfulsocieties.princeton.edu/sites/successfulsocieties/files/Policy_Note_ID18 4.pdf.
UDOMA, U.U. (2019): Breakdown of 2019 fgn budget proposal. Retrieved March 23, 2021 from https://www.proshareng.com/admin/upload/report/11888HMBNP2019EBPPublicPresentationReviewed191218FIN AL1-proshare.pdf.
WEIDEMAN, J.P. (2016): Structural breaks in renewable energy in South Africa: A Bai and Perron break test application. Department of Economics Working Paper, 2016-36, University of Pretoria.
WORLD BANK (2021): World development indicators. Retrieved July 22, 2021 from https://datacatalog.worldbank.org/dataset/world-development-indicators.
iiThe International Monetary Fund [IMF] is worry about the sustainability of the country’s debt profile which rises from
$3627.5 million in 2009 to $79.44 billion in first quarter 2019 (Nweze, 2019).
iiii The total deficit widens from 4.3% in 2019 to 5.2% in 2020 as the figure reaches ₦4.45trillion from ₦3.8trillion in 2019
(Asu, 2019; African Development Bank [AfDB], 2021; Sunnews, 2021).
iiiiii Even while the debt level is within the specific limit of 19.39% as public debt-to-GDP rises from 13.02% in 2015 to 16.27% in 2016, yet, owing to low revenue, especially from the oil sector, the public debt service-to-revenue is relatively high at 33.94% (DMO, 2017; AfDB, 2021).
iviv The federal government introduced the fiscal sustainability plan (FSP) in 2016 and the economic sustainability plan (ESP)
in 2020 to revive the economy from recessions in both years.
vvAccording to DMO (2017), external debt analysis captures external debt of the federal government of Nigeria (FGN), the 36 states and federal capital territory (FCT); while fiscal sustainability analysis (or total public debt sustainability) covers domestic and external debt of the FGN, states and FCT, and their respective revenues, including internally generated revenues.
vivi The revenue strategies include the introduction of value added tax (VAT) in 1993, tax reforms of 2004, and FSP in 2016,
among others. The country received debt forgiveness from the London and Paris Clubs in 2005.