CORVINUS UNIVERSITY OF BUDAPEST
D
EPARTMENT OFM
ATHEMATICALE
CONOMICS ANDE
CONOMICA
NALYSIS Fövám tér 8., 1093 Budapest, Hungary Phone: (+36-1) 482-5541, 482-5155 Fax: (+36-1) 482-5029 Email of corresponding author: zsolt.darvas@uni-corvinus.huWebsite: http://web.uni-corvinus.hu/matkg
W ORKING P APER
2011 / 2
F ISCAL AND M ONETARY I NSTITUTIONS IN C ENTRAL , E ASTERN AND S OUTH -E ASTERN E UROPEAN C OUNTRIES
Zsolt Darvas & Valentina Kostyleva
April 2011
Fiscal and Monetary Institutions in Central, Eastern and South-Eastern European Countries
by
Zsolt Darvas and Valentina Kostyleva April 2011
Abstract
This paper studies the role of fiscal and monetary institutions in macroeconomic stability and budgetary control in central, eastern and south-eastern European countries (CESEE) in comparison with other OECD countries. CESEE countries tend to grow faster and have more volatile output than non-CESEE OECD countries, which has implications for macroeconomic management: better fiscal and monetary institutions are needed to avoid pro-cyclical policies.
The paper develops a Budgetary Discipline Index to assess whether good fiscal institutions underpin good fiscal outcomes. Even though most CESEE countries have low scores, the debt/GDP ratios declined before the crisis. This was largely the consequence of a very favourable relationship between the economic growth rate and the interest rate, but such a favourable relationship is not expected in the future. Econometric estimations confirm that better monetary institutions reduce macroeconomic volatility and that countries with better budgetary procedures have better fiscal outcomes. All these factors call for improved monetary institutions, stronger fiscal rules and better budgetary procedures in CESEE countries.
JEL classification: E32, E50, H11, H60
Keywords: CESEE countries, Budgetary Discipline Index, budget process, fiscal institutions, budgetary institutions, monetary institutions, macroeconomic stability, econometric analysis, budgetary procedures, fiscal outcomes, fiscal rules
This paper is forthcoming in the OECD Journal on Budgeting. Copyright remains with the OECD at all times.
Zsolt Darvas is a research fellow at Bruegel and at the Institute of Economics of the Hungarian Academy of Sciences, and associate professor at the Corvinus University of Budapest (e-mail: zsolt.darvas@bruegel.org).
Valentina Kostyleva is a policy analyst in the Budgeting and Public Expenditures Division of the OECD Public Governance and Territorial Development Directorate (e-mail:
valentina.kostyleva@oecd.org).
We thank Mark Hallerberg, Dirk-Jan Kraan, Peter Van den Berg and the participants at the 6th annual meeting of CESEE Senior Budget Officials in Budva, Montenegro, 23- 24 September 2010, for comments and suggestions, and Rita Orsolya Tóth and Lucia Granelli for research assistance.
1. Introduction
This paper aims to identify the major institutional determinants of macroeconomic stability and aggregate budgetary control in central, eastern and south-eastern European (CESEE) countries.1 The region grew fast before the crisis, but the crisis hit most of these countries hard – more so than any other country group of the world – and the recovery from the crisis is also generally slow. As a consequence, the pre-crisis seemingly smooth economic progress and good budgetary record suddenly came to an end.
Have fiscal2 and monetary institutions played important roles in macroeconomic stability and aggregate budgetary control? Since the crisis had a decisive impact on both macroeconomic stability and budgetary control, the impact of these institutions on the build- up of pre-crisis vulnerabilities and on crisis response has a crucial relevance to this question.
This paper defines fiscal institutions as a set of arrangements directing budgetary preparation (including expenditure frameworks and fiscal rules), approval and execution. Monetary institutions are associated with the exchange rate regime, the quality of financial regulation and supervision, the independence of central banks, and the transparency of central bank decision making. Causal links from fiscal and monetary institutions to budgetary control and macroeconomic stability can be hypothesised as follows:
• Fiscal institutions and macroeconomic stability: Countries with better fiscal frameworks are presumably following counter-cyclical fiscal policy. Letting automatic stabilisers run and implementing counter-cyclical discretionary fiscal policy through the business cycle can dampen macroeconomic volatility.
• Fiscal institutions and budgetary control: Better fiscal institutions can directly lead to better budgetary outcomes (i.e. low deficit or surplus, and low public debt) by constraining fiscal policy.
• Monetary institutions and macroeconomic stability: The ultimate goal of monetary policy should be the stabilisation of the economy through the business cycle, and better monetary institutions should be more successful in achieving this goal.
Monetary institutions are defined broadly, and the role of financial stability is considered through regulation and supervision. The crisis has proven even more clearly that financial stability has strong implications for macroeconomic stability.
• Monetary institutions and budgetary control: There should not be a direct causal link from monetary institutions to budgetary control. However, the indirect channel through a higher level of macroeconomic stability can work.
1. This paper analyses 26 countries of central, eastern and south-eastern Europe: 12 central European and Baltic members of the EU (Bulgaria, Cyprus, Czech Republic, Estonia, Hungary, Latvia, Lithuania, Malta, Poland, Romania, Slovak Republic, Slovenia), the six European CIS countries (Armenia, Azerbaijan, Belarus, Moldova, Russian Federation, Ukraine), five non-EU countries of former Yugoslavia (Bosnia and Herzegovina, Croatia, FYR Macedonia, Montenegro, Serbia), and Albania, Georgia and Turkey.
The information in this paper with reference to “Cyprus” relates to the southern part of the Island. There is no single authority representing both Turkish and Greek Cypriot people on the Island. Turkey recognises the Turkish Republic of Northern Cyprus (TRNC). Until a lasting and equitable solution is found within the context of the United Nations, Turkey will preserve its position concerning the “Cyprus issue”.
2. For the purposes of this paper, “budgetary” and “fiscal” have the same meaning.
The paper is structured as follows. Section 2 describes macroeconomic stability and budgetary outcomes. Budgetary institutions are assessed in Section 3: the “Budgetary Discipline Index” deviates from similar indices in the literature as it considers a set of institutional features that focus specifically on budgetary discipline. Section 4 discusses monetary institutions. Section 5 presents the empirical analysis on the impact of fiscal and monetary institutions on macroeconomic stability and budgetary control. Section 6 presents some concluding remarks.
2. Macroeconomic stability and fiscal outcomes 2.1. Development of GDP
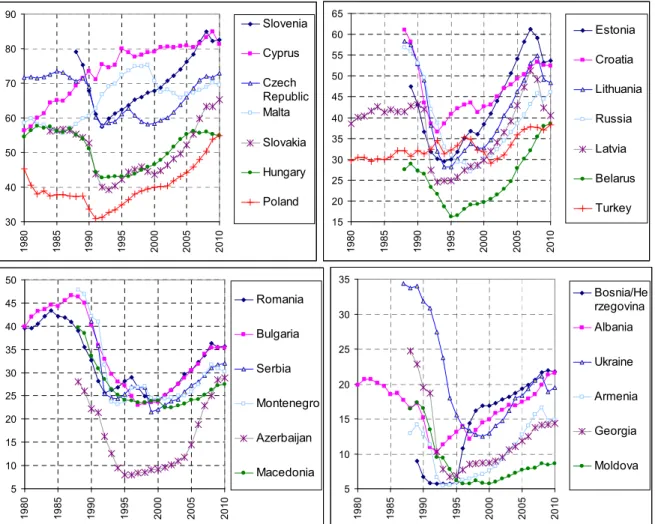
Most of the CESEE countries (except Cyprus, Malta and Turkey) went through a historically unprecedented transition from socialist political systems towards democracies and from centrally planned economies towards market economies. The extraordinarily deep recession after the collapse of the communist regimes was followed by a fast and apparently smooth economic recovery – that is, growth of per capita GDP has well exceeded the growth in the CESEE region’s main trading partners (Figure 1).
Figure 1. GDP per capita at purchasing power parity (EU15=100), 1980-2010
30 40 50 60 70 80 90
1980 1985 1990 1995 2000 2005 2010
Slovenia Cyprus Czech Republic Malta Slovakia Hungary Poland
15 20 25 30 35 40 45 50 55 60 65
1980 1985 1990 1995 2000 2005 2010
Estonia Croatia Lithuania Russia Latvia Belarus Turkey
5 10 15 20 25 30 35 40 45 50
1980 1985 1990 1995 2000 2005 2010
Romania Bulgaria Serbia Montenegro Azerbaijan Macedonia
5 10 15 20 25 30 35
1980 1985 1990 1995 2000 2005 2010
Bosnia/He rzegovina Albania Ukraine Armenia Georgia Moldova
Note: Countries are ranked according to their 2010 forecast values.
Source: Authors’ calculations based on data from the IMF World Economic Outlook April 2010 and EBRD database on main macroeconomic indicators.
Figure 1 also indicates that the duration of the recession in the 1990s (the transition period) varied substantially across CESEE countries, which complicates the selection of a start date for the sample period for the econometric analysis in this study. The current global financial and economic crisis complicates the selection of the end date of the sample period.
Figure 1 indicates that the recovery has halted in several CESEE countries and even reversed in some of them. Quarterly GDP indicators also show that recovery from the crisis is in general slow in CESEE countries and much slower than in other emerging country groups (Figure 2). For example, in the six small and open Asian economies shown in Panel A of Figure 2, output growth is currently faster than it was before the crisis, implying that these countries may converge to their pre-crisis trend line. But in CESEE countries, the speed of recovery so far falls behind pre-crisis growth, even though there is heterogeneity: Albania and Poland have not suffered from a recession in 2009, while in Armenia, Estonia, Latvia, Lithuania and Ukraine the drop in output was close to or even above 20%.
Figure 2. Quarterly GDP developments (2008Q3=100), 2005Q1-2010Q4 Panel A. Main country regions
70 75 80 85 90 95 100 105 110 115
2005Q1 2006Q1 2007Q1 2008Q1 2009Q1 2010Q1
Asia-6 Latam-8
OECD non-CESEE CESEE-21
Panel B. CESEE countries
70 75 80 85 90 95 100 105 110 115
2005Q1 2006Q1 2007Q1 2008Q1 2009Q1 2010Q1
Czech Rep.
Hungary Poland Slovakia Slovenia
70 75 80 85 90 95 100 105 110 115
2005Q1 2006Q1 2007Q1 2008Q1 2009Q1 2010Q1
Bulgaria Estonia Latvia Lithuania Romania
70 75 80 85 90 95 100 105 110 115
2005Q1 2006Q1 2007Q1 2008Q1 2009Q1 2010Q1
Croatia Cyprus Malta Serbia Turkey
70 75 80 85 90 95 100 105 110 115
2005Q1 2006Q1 2007Q1 2008Q1 2009Q1 2010Q1
Armenia Belarus Georgia Moldova Russia Ukraine
Notes: Country group averages in panel A are non-weighted averages. Asia-6: Indonesia, Korea, Malaysia, Philippines, Taiwan and Thailand. Latin America-8: Argentina, Brazil, Chile, Columbia, Ecuador, Mexico, Peru and Uruguay. CESEE-21: the average of the 21 countries shown in Panel B. OECD non-CESEE: 27 OECD countries except Czech Republic, Hungary, Poland, Slovak Republic, Slovenia and Turkey.
Sources: Eurostat (EU countries and Croatia), OECD (other OECD countries and Russian Federation), and national statistical offices, IMF and EBRD quarterly GDP database (other countries). Whenever seasonally adjusted series were not available, the Census X-12 method for seasonal adjustment was used.
The reasons behind both the more serious average impact of the crisis on CESEE countries and the diversity among those countries have been studied (see, for example, Mitra, Selowsky and Zalduendo, 2009; Darvas, 2010; and Becker et al., 2010), so only the main issues are summarised here.
The pre-crisis development model pursued by CESEE countries had many special features compared to other emerging economies. It was based on deep political, institutional, financial and trade integration with the EU3 which was also accompanied by substantial
3. There are also differences within the CESEE region, however. The new EU member states have reached the highest level of integration, followed by the countries of the western Balkans and Turkey that have the status of either EU candidate or potential candidate. The six Eastern Partnership countries, which were part of the
labour mobility into EU15 countries. Other emerging country regions did not have an anchor similar to the role the EU played for CESEE countries. Economic growth in the CESEE region relied on net private capital inflows, which have reached higher levels than elsewhere.
In the aftermath of the dramatic crises in Asia and Latin America in the late 1990s and early 2000s, the CESEE region was the only emerging region of the world that had persistent current account deficits. Economic recovery was accompanied by real exchange rate appreciations – again a largely unique feature of the CESEE development model – and real interest rates fell.
But the CESEE development model had two important variants within the region. Some countries, most notably countries in central Europe, were more successful in making use of the development model. In these countries, pre-crisis growth was accompanied by small and even improving trade balances, as a reflection of reindustrialisation after the collapse that followed the fall of communist regimes. In most of the other countries, however, the trade and current account balances deteriorated sharply before the crisis, reaching double-digit levels in several cases. As a consequence, external debt rose fast before the crisis. Also, housing prices rose much faster and real exchange rate appreciation was also more rapid, while real interest rates fell to lower levels than in central European countries and inflation also rose considerably before the crisis. All of these factors suggest that economic growth in this group of countries was to a considerable extent fuelled by unsustainable booms. Indeed, there was extremely rapid growth of credit to the private sector, and the composition of foreign direct investment (FDI) was also biased in favour of banking, real estate and other domestic sectors.
When the crisis started, most people thought that the CESEE region would not be hit too hard. For example, the April 2008 Regional Economic Outlook Europe of the IMF foresaw that “emerging Europe’s convergence trend is set to continue, based on good fundamentals, although its pace is likely to slow” (IMF, 2008), and other institutions and commentators shared this view. However, after the collapse of Lehman Brothers, there was a sudden interruption, and even reversal in some countries, of capital inflows to CESEE countries. This led to a credit crunch which, combined with the subsequent export and investment declines, has depressed economic activity. Commodity exporters, such as Azerbaijan, the Russian Federation or Ukraine, were also hit by falling commodity prices. As the crisis unfolded, the credit crunch was replaced by falling demand for credit, caused by increased uncertainty and lowered expectations with respect to future growth prospects (Ghosh, 2009).
The diversity of responses to the crisis within the CESEE region could be related to different reliance on pre-crisis capital inflows, trade and commodity exports. But the crisis responses have likely been influenced by the fiscal and monetary policies during the crisis:
only a few CESEE countries (e.g. Azerbaijan, Czech Republic, Poland, Russian Federation, Slovenia, and Turkey) implemented fiscal stimulus in order to dampen the crisis. Most other countries had to consolidate public finances, thereby likely amplifying the downturn (Darvas, 2010).4 Furthermore, monetary policy could not be eased at a time when capital was moving out, and indeed several countries had to raise interest rates as well.
Soviet Union, have reached varying degrees of integration with the EU15, and the Russian Federation still remains an important anchor for these countries.
4. The appendix table in Darvas (2010) details the fiscal measures taken by CESEE countries in response to the crisis.
2.2. Macroeconomic stability
Two measures of macroeconomic stability are used for the econometric analysis of Section 5 below:
• volatility of GDP growth rates, 2000-10
• output decline in 2009
The first one can be regarded as an average measure of stability, while the second can be regarded as a “tail” event. The selection of these measures is based on the following:
The developments described in the previous sub-section suggest that considering the pre- crisis period only would be misleading, since pre-crisis economic growth has led to economic structures that made CESEE countries more prone to the crisis. In particular, the seemingly fast and smooth growth before the crisis has led to vulnerabilities in several CESEE countries, which eventually resulted in huge output falls and slow recoveries so far. Therefore, the crisis should be included in the sample. On the other hand, the 1990s was burdened with so many structural changes that the inclusion of this sample period would not be informative.
Therefore, whenever data availability allows, the sample period of 2000-10 is used when studying macroeconomic stability, but a pre-crisis sample period (2000-07) is also used for comparison.
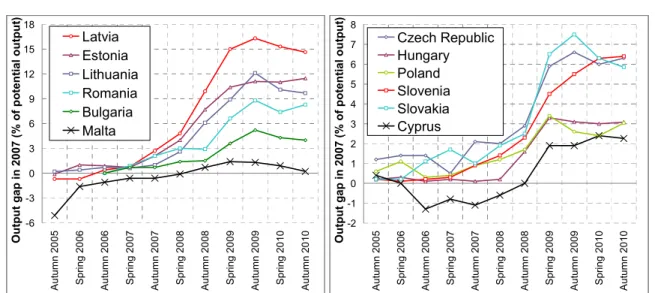
Macroeconomic stability has various interpretations.5 The focus here is on GDP volatility, which of course can also reflect internal and external disequilibrium. Ideally, GDP volatility should be measured as the volatility of the deviation from potential output. However, measures of potential output are especially uncertain for countries like those of central, eastern and south-eastern Europe and at the time of the global crisis. An example is given in Figure 3 which depicts the 2007 output gap in EU member CESEE countries as seen at different dates, using data from the European Commission. The figure shows huge revisions in potential output calculations. The EC first published forecasts for the 2007 output gap in autumn 2005, when it predicted, for example, that the output gap of Latvia in 2007 would be - 0.7%. This forecast was maintained in the spring of 2006, but later it was substantially revised upward. In the spring of 2008, the 2007 output gap was seen as 4.8% and in autumn 2009 it was seen as 16.3%. Therefore, we do not study the volatility of the output gap, but concentrate on GDP growth.
5. At the broadest level, macroeconomic stability can be defined as the volatility of output. It could also be defined, for example, as the level and volatility of inflation (representing internal equilibrium in the economy) or the level and volatility of the current account balance (representing external equilibrium).
However, the assessment of both internal and external equilibrium is complicated by the economic developments of CESEE countries.
Figure 3. The 2007 output gap as seen at different dates
-6 -3 0 3 6 9 12 15 18
Autumn 2005 Spring 2006 Autumn 2006 Spring 2007 Autumn 2007 Spring 2008 Autumn 2008 Spring 2009 Autumn 2009 Spring 2010 Autumn 2010
Output gap in 2007 (% of potential output)
Latvia Estonia Lithuania Romania Bulgaria Malta
-2 -1 0 1 2 3 4 5 6 7 8
Autumn 2005 Spring 2006 Autumn 2006 Spring 2007 Autumn 2007 Spring 2008 Autumn 2008 Spring 2009 Autumn 2009 Spring 2010 Autumn 2010
Output gap in 2007 (% of potential output)
Czech Republic Hungary Poland Slovenia Slovakia Cyprus
Source: European Commission forecasts made at the dates indicated on the horizontal axis.
Figure 4 shows the standard deviation of real GDP growth rates in 2000-07 and in 2000- 10 in order to assess the possible increase in volatility in response to the crisis. Indeed, considering the pre-crisis period of 2000-07, volatility was seemingly low in several CESEE countries. In some cases, volatility was even below the average of non-CESEE OECD countries. However, data for 2000-10 suggest that the seemingly low pre-crisis volatility has indeed masked underlying vulnerabilities. In some cases, such as Estonia, Latvia, Lithuania and Ukraine, the rise in volatility is quite dramatic. On the other hand, there are four countries (Albania, Belarus, Cyprus and Poland) where volatility is below the non-CESEE OECD average in the 2000-10 period.
Figure 4. Standard deviation of annual GDP growth rates
0.0 2.0 4.0 6.0 8.0 10.0
Azerbaijan Latvia Lithuania Ukraine Estonia Armenia Turkey Montenegro Georgia Russia Romania Moldova Slovakia Slovenia Hungary Croatia Macedonia Czech Republic Serbia Bosnia/Herzegovina Bulgaria Malta OECD (non-CESEE) Belarus Poland Cyprus Albania
2000-2007 2000-2010
Source: Authors’ calculations using data from the IMF World Economic Outlook April 2010.
2.3. Fiscal outcomes
Two measures of fiscal outcomes are used for the econometric analysis of Section 5 below:
• average general government balance (as a per cent of GDP) in 2000-10
• change in general government gross debt (as a per cent of GDP) from 2000 to 2010 The two measures are related, but not perfectly, as will be demonstrated below. The second measure considers the change in the debt/GDP ratio (as opposed to the level of the debt/GDP ratio) because good fiscal institutions in a given year cannot impact the inherited stock of debt, but can impact the change in debt. Of course, the econometric analysis controls for the initial level of debt and other potential determinants. Similarly to the study of macroeconomic stability, the pre-crisis period (2000-07) is also used for comparison to the preferred sample of 2000-10.
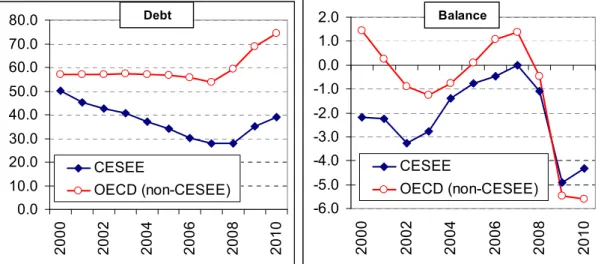
Figure 5 shows developments in general government balance and debt as a per cent of GDP. The trend in general government gross debt has been much more favourable in CESEE countries than in non-CESEE OECD countries. The average ratio of debt to GDP has decreased by more than 20 percentage points between 2000 and 2008 in CESEE countries, whereas it has been stable (or showed just slight decreases) in (other) OECD countries. One reason for this development could be differences in budget balances. However, this is certainly not the case, since the budget balance6 was better in non-CESEE OECD countries than in CESEE countries. Therefore, the two measures described at the beginning of this sub- section are not perfectly correlated.
Figure 5. General government balance and gross debt (% GDP), 2000-10
0.0 10.0 20.0 30.0 40.0 50.0 60.0 70.0 80.0
2000 2002 2004 2006 2008 2010
CESEE
OECD (non-CESEE) Debt
-6.0 -5.0 -4.0 -3.0 -2.0 -1.0 0.0 1.0 2.0
2000 2002 2004 2006 2008 2010
CESEE
OECD (non-CESEE) Balance
Sources: IMF World Economic Outlook April 2010 and EBRD Main macroeconomic indicators.
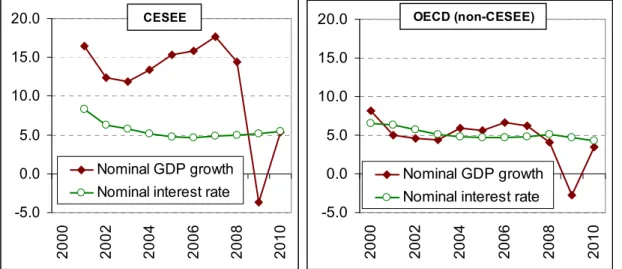
The explanation for the divergent trends in debt/GDP ratios is most likely the consequence of a highly favourable relationship between the economic growth rate and the interest rate. As Figure 6 indicates, economic growth in CESEE countries largely exceeded
6. The primary balance is unfortunately not available for several CESEE countries.
the interest rate before the crisis, while in (other) OECD countries the two variables broadly moved together. The favourable relationship in CESEE countries was supported by financial integration (by reducing borrowing costs), higher real GDP growth rates and higher inflation rates.7
Figure 6. Implicit nominal interest rate1 on government debt and nominal GDP growth (per cent), 2000-10
-5.0 0.0 5.0 10.0 15.0 20.0
2000 2002 2004 2006 2008 2010
Nominal GDP growth Nominal interest rate
CESEE
-5.0 0.0 5.0 10.0 15.0 20.0
2000 2002 2004 2006 2008 2010
Nominal GDP growth Nominal interest rate
OECD (non-CESEE)
Note: Interest rate=government interest expenditures/previous year gross debt.
Source: Authors’ calculations using data from the IMF World Economic Outlook April 2010 and Eurostat website (implicit interest rate).
3. Fiscal institutions
This section identifies budgetary institutions which may contribute to aggregate control and fiscal discipline, and proposes a new index called “Budgetary Discipline Index”. The
“Fiscal Institutions Index” of Fabrizio and Mody (2008) and the budgetary institutions indexes of Hallerberg, Strauch and von Hagen (2007) have motivated the development of this Budgetary Discipline Index which nevertheless differs by according more importance to different or additional aspects and by omitting some criteria analysed by the previous authors.
This paper develops a set of institutional features which are considered to be crucial for mechanisms of fiscal discipline at the three stages of the budgetary cycle: the preparation stage (when the budget is drafted), the authorisation stage (when the budget is approved by parliament) and the implementation stage (when the budget is implemented and may be amended). The set provides a benchmark for assessing the countries and a basis for constructing the Budgetary Discipline Index.
7. It should be noted that, during the crisis, the interest rate risk premium has increased and may remain at about pre-crisis levels in the coming years, while nominal GDP growth may be squeezed. Therefore, such a highly favourable relationship between the growth rate and the interest rate may not return. Also, this paper uses the actual implicit interest rate, which is largely determined by past interest rates due to long maturity bonds. A rise in spot interest rates will be shown in the implicit interest rates after a lag.
3.1. Budget preparation stage
For the stage of budgetary preparation, three leading parameters contribute to budgetary control: fiscal rules, the medium-term expenditure framework and multi-annual expenditure estimates.
3.1.1. Fiscal rules
According to the definition of a fiscal rule proposed by Kopits and Symanski (1998, p. 2), a fiscal rule is “a permanent constraint on fiscal policy, typically defined in terms of an indicator of overall fiscal performance. …A critical feature of a fiscal rule is that …it is intended for application on a permanent basis by successive governments in a given country.”
Fiscal rules can serve different goals, and their role in promoting budgetary control varies. Depending on how they affect fiscal discipline, the rules are classified as follows:8
• Expenditure rules usually set permanent or medium-term limits on total, primary or current spending in absolute terms, in growth rates, or in per cent of GDP.
Expenditure rules in their essence include expenditure frameworks with fixed ceilings (ceilings that cannot be changed from year to year). Expenditure rules are always anchored in a budget balance rule over the cycle (see below). Expenditure rules can provide an operational tool to trigger the required fiscal consolidation consistent with sustainability. Steering on the expenditure side rather than on a cyclically adjusted deficit constraint is more transparent and possibly less susceptible to manipulation (Anderson and Minarik, 2006). Therefore, the largest value is assigned to expenditure rules.
• Budget balance rules, which can be set as headline balance and structural (or cyclically adjusted) balance, help to ensure that the debt-to-GDP ratio converges to a finite level. (Sometimes the “balance rule” is referred to as a “deficit rule”.)
− Headline balance rules have certain disadvantages. The revenue side of the budget is almost entirely determined by substantive legislation, namely tax legislation, and the expenditure side is partly determined by substantive legislation, in particular social security and health legislation (entitlements). This means that forecasts for the actual deficit are permanently moving, not only during the formulation phase of the budget process but also during the execution phase. Focus on the headline balance therefore requires that the budget be amended often during both phases of the budget process to react to the latest predictions. This hampers an orderly decision-making process and tranquillity in the budget numbers. Moreover, it leads to a volatile fiscal stance that changes from month to month in the light of the latest forecasts. Budgetary adjustments motivated by short-term macroeconomic fluctuations bring a pro-cyclical element into budgetary policy and hamper the stabilising effect of the budget (Kraan et al., 2006).
− A structural (or cyclically adjusted) balance rule may solve some issues associated with the headline balance rule and improve the trade-off between
8. See IMF (2009) for further details.
concerns about sustainability and cyclicality. The cyclically adjusted fiscal balance is obtained by removing the cyclical component from the headline fiscal balance. The cyclical component, in turn, depends on two factors: the size of the output gap; and the output elasticity of the tax yield, which indicates the extent to which the tax yield reacts to fluctuations in GDP. However, one disadvantage of a cyclically adjusted deficit constraint is that there are arbitrary elements in the calculation of the output gap on which the cyclically adjusted deficit is based.9 Moreover, the concept of the cyclically adjusted balance rule is not always transparent to politicians and the public.
− Some variant of cyclically adjusted balance rules is now used by about 11% of countries around the world (IMF, 2009). However, none of the CESEE countries have adopted cyclically adjusted balance rules. Concerns about the accuracy of calculations might be the main reason for the countries’ abstinence. Given the relatively high volatility of macroeconomic variables in the CESEE region, it would be difficult to produce an accurate cyclical component. Therefore, this paper does not separate structural and headline balance rules, but rather assigns them the same score (after expenditure rules).
• Debt rules set an explicit limit or target for public debt in per cent of GDP. This type of rule is, by definition, the most effective in terms of ensuring convergence to a debt target. However, it does not provide sufficient guidance for fiscal policy when debt is well below its ceiling. Therefore, debt rules score low in the calculation.
A significant proportion of countries frequently combine balance and debt rules, which reflects governments’ preferences for rules with a close link to fiscal sustainability.
Finally, the absence of a fiscal rule of any kind does not contribute to fiscal discipline;
thus a zero is assigned to the countries with no fiscal rules.
3.1.2. Medium-term expenditure framework
Almost all OECD countries currently work with a medium-term expenditure framework.
Most of them adjust the framework from year to year in the light of the previous year’s outcomes, new estimates of the consequences of current policies and new political priorities.
This framework can be called a flexible one. The major advantage of a flexible framework in comparison to no framework is that, at the time of budget formulation, the multi-annual consequences of all changes (setbacks and windfalls on the revenue and expenditure sides, and new priorities) have to be traded off against each other and against the adjustment of medium-term targets for expenditures, revenues or the deficit.
A few countries (notably the Netherlands, Sweden and the United Kingdom) have a medium-term expenditure framework that is not adjusted from year to year; this can be called a fixed framework. It is characteristic for a fixed framework that, during budget formulation, all line-item budget numbers and all line-item multi-year estimates have to be squeezed under the overall ceiling over the entire term of the framework. The first major advantage of a fixed expenditure framework in comparison to no framework is identical to that of a flexible framework: all trade-offs have to be considered. A second major advantage is that a fixed
9. See Figure 3 for an example of the uncertainty of output gap estimates.
framework is (more) effective than a flexible framework in realising multi-year expenditure targets. Precisely because the overall ceiling cannot be changed from year to year, the target is automatically realised as long as the framework is maintained. Although only a few OECD countries work with a fixed expenditure framework, many others seek to keep their expenditure framework as stable as possible from year to year (without formally committing to a fixed framework).
Medium-term expenditure frameworks sometimes contain not only overall ceilings or broad sectoral ceilings for central government, local government or the social security funds, but also ceilings at the level of ministries or expenditure areas. Ministerial ceilings are important because, once established, they impose a certain discipline on ministers and help to prevent overspending.
CESEE countries have also adopted expenditure frameworks in their budgetary process.
The frameworks are characterised by different degrees of flexibility. For the purposes of this paper, the highest score was attributed to the countries that have fixed ceilings for the ministries at the very beginning of the budget formulation process and that try to keep them as stable as possible from year to year. If a country has targets which may be substantially changed and renegotiated during the budget drafting process, the country was given a score of zero.
3.1.3. Multi-annual estimates
Multi-annual estimates should be integrated into the annual budget to ensure consistency with the expenditure framework. Multi-annual line-item estimates on the basis of current policy or current law are essential for the allocation of financial resources in the annual budget negotiation, and they help to ensure the consistency of current law or policy with the multi-annual ceilings. Multi-annual estimates on the basis of current policy or current law (“baseline estimates”) should be produced and agreed between the line ministry and the finance ministry at least twice a year. Such estimates are an essential tool for budgetary discipline not only during budget formulation, but also during budget execution: during execution, they alert at an early stage to possible overspending, which may trigger corrective measures.
Establishing the expenditure framework can be seen as a top-down process, and preparing budgetary and multi-annual estimates as a bottom-up process. In fact, the reconciliation of prescriptive targets or ceilings with descriptive line-item estimates is central to a programme-based budget process. Government spending programmes in OECD countries have reached such levels of size and complexity that it is frequently difficult to make policy changes in the current year that substantially affect the next year’s budget.
Therefore, the maximum score was attributed to the countries where multi-annual line- item estimates based on current policy are updated twice or several times per year, a lower score to the countries where multi-annual line-item estimates based on current policy are available at the start of the budget preparation, and zero to the countries where the estimates are prepared on an ad hoc basis or are not produced at all.
3.2. Budget authorisation stage (legislation)
In the legislative stage of the budgetary process, parliament can amend the budget bill and either pass or reject it. Two indicators in this second stage are important for promoting fiscal discipline: constraints on parliament to amend the budget bill, and independent assessment of fiscal policy by a fiscal council.
3.2.1. Constraints on parliament to amend the budget bill
The approval stage of the budget cycle serves as an important opportunity for debate of the executive’s policy and expenditure priorities. Without intending to study the meaning of political representation or the confidence in the legislature held by civil society, the argument is that a restricted formal amendment power of parliament contributes to better budgetary discipline. If the legislature can only make budget amendments under the condition that the budget balance (surplus or deficit) within the executive’s budget proposal is unchanged – or, alternatively, if the legislature can only amend downwards any aggregates of expenditure – the constraints on the executive budget are maintained and the budgetary cycle is not fragmented. This situation will contribute to fiscal discipline. The highest score was attributed to countries where the amendment power of parliament is restricted, and a score of zero to the countries where the legislature may increase or decrease the level of revenues and/or expenditures without the consent of the executive.
3.2.2. Fiscal councils
An independent fiscal agency or a fiscal council can help in the formulation and implementation of sound fiscal policies. Fiscal councils analyse and assess budgetary developments and policies, offer advice, and stimulate public debate and scrutiny while leaving the policy mandate with the elected representatives. Fiscal councils can provide independent input into the budgetary process and contribute to greater transparency by alerting about the political cost of inappropriate policy.
The desirable form of a fiscal council is specific to each country. The best form depends on the nature of a country’s political environment, including the constitutional set-up, the legal traditions and the policy-making customs. A fiscal council can complement the role played by existing institutions and enhance the effectiveness of fiscal rules (see Debrun, Hauner and Kumar, 2009).
For the analysis in this paper, only fiscal agencies which are fully independent (or a nonpartisan government agency) and whose role consists in assessing fiscal policy were considered. The premise is that the larger the guarantee of independence from political interference, the greater the likelihood of perceived or actual impact on fiscal outcomes.
3.3. Budget implementation stage
In the third stage, the budget law is executed and further modifications of the law may be possible. Two parameters were selected to indicate the level of budgetary control: the rules for carryovers of unused funds to the next fiscal year, and the quality of external audit.
3.3.1. Carryovers of unused funds
The issue of carryovers of unused funds to the next fiscal year arises in the stage of budgetary execution. Any automatic carryover arrangement, whether cash-based or accruals- based, will lead to stacks of unused appropriations that will increase from year to year. Any general rule limiting carryover will lead to “December fever”. Therefore, the most sensible solution is bilateral negotiation between the line minister and the finance minister on a case- by-case basis. Under a cash regime, each agreed carryover will have to be compensated in the next budget year and the finance minister should see to that (Kraan, 2007). Therefore, the rules allowing carryovers within certain limits with authorisation of the finance ministry were given the highest score, prohibited carryovers were given an average score, and unlimited carryover rules (which do not contribute to fiscal discipline) were given a value of zero.
3.3.2. Quality of external audit
The quality of external audit is probably the most arbitrary parameter. It encompasses various issues related to external audit, namely the openness and availability of audit reports to the public, timeliness of such publications, the nature of audit reports (for instance, performance audit reports are considered as a more advanced level of auditing with greater outcomes than compliance reports), the mechanism provided for follow-up measures, and some other criteria which can differ depending on countries’ circumstances. Therefore, the countries with both financial and performance audits complemented by strong mechanisms for follow-up measures score high in the ranking. A focus on financial audit and/or insufficient use of audit reports indicates an insufficient level of development of audit institutions (zero score).
3.4. Design of the index
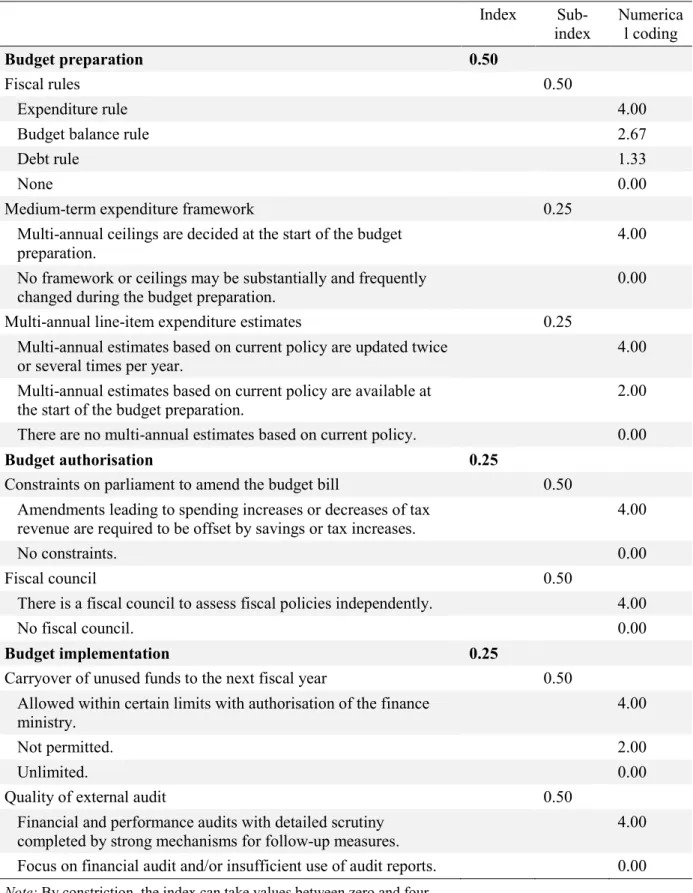
Table 1 provides an overview of the design of the Budgetary Discipline Index and indicates the preferred weights.
It should be kept in mind that the study looks at budgetary institutions from the perspective of how well they contribute to the fulfilment of one particular function of the budget: control of spending, taxation and borrowing. Therefore, other functions of the budget – namely the efficient allocation of resources, the cost-efficient management of spending programmes, the democratic authorisation of and accountability for taxation, spending and borrowing – are not considered. This focus determines the set of variables in the construction of the Budgetary Discipline Index. Institutional characteristics that promote co-ordinated and cohesive decision making are expected to be more conducive to fiscal discipline and therefore receive a higher score in the quantitative index used for the empirical analysis.
Table 1. Construction of the Budgetary Discipline Index: index parameters
Index Sub-
index
Numerica l coding
Budget preparation 0.50
Fiscal rules 0.50
Expenditure rule 4.00
Budget balance rule 2.67
Debt rule 1.33
None 0.00
Medium-term expenditure framework 0.25
Multi-annual ceilings are decided at the start of the budget preparation.
4.00 No framework or ceilings may be substantially and frequently
changed during the budget preparation.
0.00
Multi-annual line-item expenditure estimates 0.25
Multi-annual estimates based on current policy are updated twice or several times per year.
4.00 Multi-annual estimates based on current policy are available at
the start of the budget preparation.
2.00
There are no multi-annual estimates based on current policy. 0.00
Budget authorisation 0.25
Constraints on parliament to amend the budget bill 0.50
Amendments leading to spending increases or decreases of tax revenue are required to be offset by savings or tax increases.
4.00
No constraints. 0.00
Fiscal council 0.50
There is a fiscal council to assess fiscal policies independently. 4.00
No fiscal council. 0.00
Budget implementation 0.25
Carryover of unused funds to the next fiscal year 0.50
Allowed within certain limits with authorisation of the finance ministry.
4.00
Not permitted. 2.00
Unlimited. 0.00
Quality of external audit 0.50
Financial and performance audits with detailed scrutiny completed by strong mechanisms for follow-up measures.
4.00
Focus on financial audit and/or insufficient use of audit reports. 0.00
Note: By constriction, the index can take values between zero and four.
3.5. Data
Limited availability of data on CESEE countries restricts the research, and the major concern is that the data do not always contain enough information to enable solid conclusions to be drawn. Two main sources have been used: OECD budget reviews (www.oecd.org/gov/budget) and the OECD International Budget Practices and Procedures Database 2007/08 (www.oecd.org/gov/budget/database).
The objective of the budget reviews is to provide a comprehensive overview of the budget process in the country under examination, to evaluate national experiences in the light of international best practice and to provide specific policy recommendations, as well as to offer other countries an opportunity to comment on specific budgeting issues in the country under examination (“peer review”).10 The reviews look at the budget institutions or the rules of the budget process and the way they function. Therefore, the budget reviews provided the required facts and analyses of institutional features in CESEE countries.
The International Budget Practices and Procedures Database is a database maintained by the OECD.11 Therefore, the Budgetary Discipline Index calculated here is a snapshot of the situation between 2007 and 2008. The index does not reflect emerging trends or reforms since 2008, or the general economic slowdown. For instance, all the progress achieved in such countries as Hungary (introduction of advanced fiscal rules and a fiscal council) is not reflected in this paper.
3.6. Results
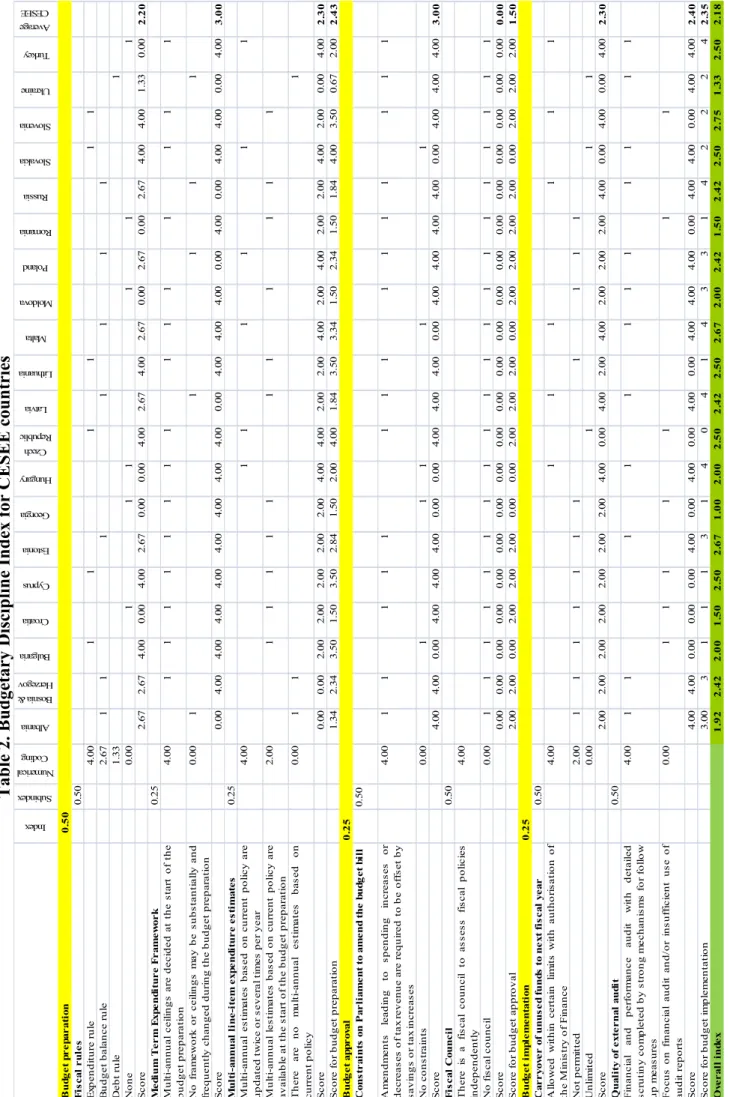
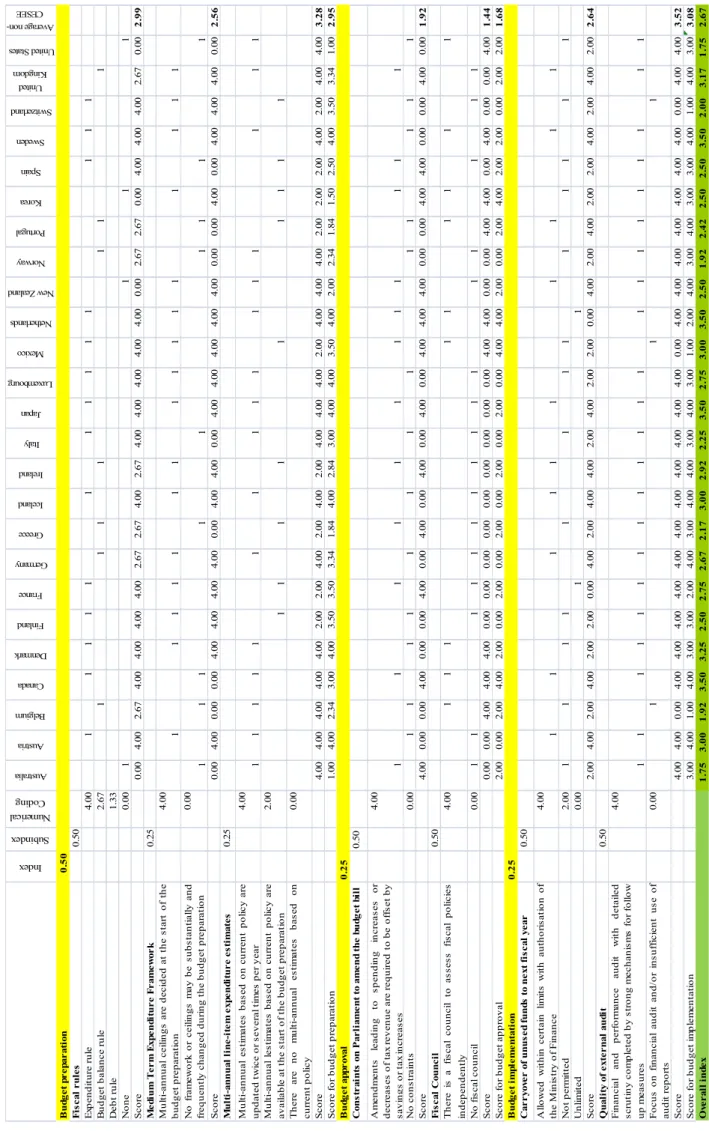
On the basis of the premises and parameters discussed in the previous sub-section, a quantitative Budgetary Discipline Index was constructed for 20 CESEE countries for which data were available: Albania, Bosnia and Herzegovina, Bulgaria, Croatia, Cyprus, Czech Republic, Estonia, Georgia, Hungary, Latvia, Lithuania, Malta, Moldova, Poland, Romania, the Russian Federation, the Slovak Republic, Slovenia, Turkey and Ukraine. For comparative reasons, the same indices were created for OECD countries. Figures 7 and 8 show the overall index for CESEE and OECD countries12 (the OECD countries do not include the ones which are also CESEE countries: Czech Republic, Hungary, Poland, Slovak Republic and Turkey).
Tables 2 and 3 detail the calculations.
10. The following countries have been reviewed: Romania and Slovenia in 2005; Croatia, Georgia and Hungary in 2006; Turkey in 2007; Estonia and the Russian Federation in 2008; Bulgaria and Latvia in 2009, Lithuania and Moldova in 2010.
11. It contains among other things the results of the 2007 OECD survey of budget practices and procedures in OECD countries and the 2008 World Bank/OECD survey of budget practices and procedures in Asia and other regions. Information on budget institutions from 97 countries is available including the 31 OECD member countries and 66 non-member countries. The data refer to the years 2007 and 2008.
12. Estonia and Slovenia were not member countries of the OECD in 2008, but joined the Organisation later.
Figure 7. Budgetary Discipline Index for CESEE countries (2007/08)
Source: Authors’ calculations based on OECD budget reviews and the OECD International Budget Practices and Procedures Database.
Figure 8. Budgetary Discipline Index for non-CESEE OECD countries (2007/08)
Source: Authors’ calculations based on OECD budget reviews and the OECD International Budget Practices and Procedures Database.
Among CESEE countries, there is a relatively large disparity in terms of scores. Globally, EU member countries have higher scores than non EU members, with the notable exception of Romania scoring relatively low. Slovenia, Estonia and Malta had the strongest budgetary institutions at the time. Overall, countries which adopted fiscal rules score the highest in the ranking.
By comparing the indices of CESEE countries (Figure 7) with the indices of OECD countries (Figure 8), the OECD indices appear to be generally higher, and the average index among OECD countries (2.7) is significantly higher than the average index in CESEE countries (2.2). However, there is a relatively large heterogeneity among OECD countries as well, and some OECD countries – namely the United States, Australia, Norway, Belgium and Switzerland – show relatively low rates.
The low scores in some OECD countries might be due to the fact that this paper looks at the legal framework of a country (at the central level) and coalition agreements to examine the presence and the nature of fiscal rules and expenditure frameworks. The fact that some countries (for example, Australia, Norway or the United States) have long-standing customs which are not necessarily reflected in the legislation is not taken into consideration.
Therefore, even if these countries have no legal provisions regarding fiscal control measures, they may have other strong tools to promote aggregated budgetary control.