Implicit rating: A potential new method to alert crisis on the interbank lending market
by Edina Berlinger
C O R VI N U S E C O N O M IC S W O R K IN G P A PE R S
http://unipub.lib.uni-corvinus.hu/2203
CEWP 4 /201 6
1
Implicit rating:
A potential new method to alert crisis on the interbank lending market
Edina Berlinger, PhD1
Associate professor, Corvinus University of Budapest
Budapest, 20.01.2016 Abstract:
A new measure called “implicit rating” is introduced which might be a component of an early warning system. The proposed methodology relies on the aggregation of experts’ knowledge hidden in the transactional data of the interbank market of unsecured loans. Banks are simultaneously assessing the creditworthiness of each other which is reflected in the partner limits and in the interest rates. In the Hungarian interbank market the overall trading volume and the average interest rate did not show any negative trends before the crisis of 2008, however the average implicit partner limit started to decrease several months earlier, hence it might serve as a stress indicator.
JEL-code: D85, E42, G01, G15, G21
Keywords: financial crisis, credit rationing, counterparty risk, partner limits, risk adjusted interest rate, network analysis
1 edina.berlinger@uni-corvinus.hu
2 1. Introduction
Setting up early warning systems to alert financial crises and detecting the systematically important financial institutions (SIFIs) became critical issues for the regulators after the recent global financial crisis (BCBS 2011a, 2011b), however, there is no consensus on the right methodology. On the one hand the increasing amount of granulated information (e.g. detailed network data) may serve as a solid base for sophisticated quantitative analysis; on the other hand, commonly used analytical methods may have little relevance within certain conditions, see Acemoglu et al. (2015).
Early warning systems are mostly based on high powered econometrics (eventually supported by artificial neural network systems) in order to exploit the information hidden in market data, (Wilmott 2006, Brussiere and Fratzscher 2006, Davis and Karim 2008, Kim et al. 2009). Sun and Li (2009) propagate a completely different approach which relies on the experts’
knowledge by applying innovative group-decision making procedures.
In this paper, a new method is introduced which can help to improve early warning systems.
The proposed methodology relies on the aggregation of experts’ knowledge hidden in the transactional data of the interbank market of unsecured loans. When lending each other, banks are simultaneously assessing the creditworthiness of their partners which is reflected in the partner limits (quantity adjustment) and in the interest rates of the loan (price adjustment).
This information can be mined out and aggregated into an indicator called “implicit rating”
for each bank which can be easily monitored by the regulator.
In Section 2 the proposed method is presented. In Section 3 the method is applied to the Hungarian interbank market of unsecured loans between 2003 and 2012. In Section 4 the results are analyzed, while in Section 5 conclusions are derived.
2. The proposed method
It is a well-documented empirical fact that credit markets do not clear out by price adjustments, i.e. lenders limit their supply of credit even if borrowers are willing to pay a higher interest. This phenomenon is called “credit rationing”.
It is demonstrated in theoretical papers that credit rationing can be a result of an equilibrium model, but explanations are quite different: e.g. adverse selection in Stiglitz and Weiss (1981); moral hazard in Holmstrom and Tirole (1998), and Guttentag and Herring (1984); and stochastic collateral in Jones (1995). In all these models the increased partner risk (due to idiosyncratic or systemic factors) leads to increased credit rationing, hence less funding will be available. Homolya et al. (2013) examined the practice of the Hungarian banks of setting their partner limits, and found that partner limits depend most of all on the riskiness of the partner.
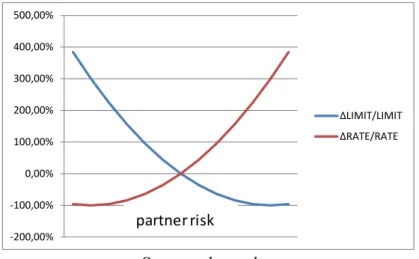
3 Without analyzing the possible causes of credit rationing, we simply suppose that there is a strong negative correlation between partner risk and partner limit. More precisely, we assume that interest rates and partner limits adjust simultaneously but in opposite direction. When the riskiness of the jth bank increases, some of their potential partners perceive this and react in two ways at the same time: (i) they increase the interest rate and (ii) decrease their partner limit toward bank j. Figure 1 illustrates this double-sided adjustment process.
Figure 1: Simultaneous adjustments of the interest rate and the partner limit, an illustration
Source: the author
Of course, the exact shape of these functions is not known, and we only assume that higher partner risk (= less attractive partners) goes with higher interest rate and lower partner limit (=
less favorable loan conditions). Based on this idea, both partner limit and interest rate are linearly combined into a so called implicit rating formula (IR), which is designed to reflect the relative attractiveness of the jth bank seen by the other banks:
R R L
IRj Lj j
1 (1)
where
- α is the weight of quantity adjustment (between 1 and 0) - Lj is the average partner limit toward bank j (equally weighted) - Rj is the average interest rate of bank j (volume weighted) - Δ is the difference from the average
- 𝐿̅ is the average partner limit toward all banks (equally weighted) - 𝑅̅ is the average interest rate of all banks (volume weighted)
Data on the interest rates are usually available for the regulator, but unfortunately, partner limits are kept in secret. Hence, we can only approximate these by estimations obtained by analyzing transactional data which will be described in the next section in detail.
-200,00%
-100,00%
0,00%
100,00%
200,00%
300,00%
400,00%
500,00%
ΔLIMIT/LIMIT ΔRATE/RATE
partner risk
4 This measure is called “rating” because it characterizes the credit/counterparty risk of the given bank. If it is strongly positive then the bank is considered as a relatively good borrower, whereas its negative value indicates high counterparty risk. It measures the creditworthiness
“implicitly” because it can be calculated inversely from market transactions. In the next sections we explore each component (implicit partner limits and interest rates), and then combine them into (1) with different weights.
3. Empirical analysis
The database was obtained from the National Bank of Hungary. Data cover the period between January of 2003 and 2012; hence it contains the liquidity crisis of the end of 2008 due to the Lehman-fall when the trading volume suddenly dropped from 2500 to 1000 billion HUF, and the average interest rate rose from 8% to 12%. However, before the burst of the crisis these aggregate measures did not show any negative tendencies.
The database contains the code of the reporting bank (lender), the code of its partner bank (borrower), the loan amount, the interest rate and the maturity and the date of start for each transaction. These data can be represented as a dynamically changing network where the vertices are the 55 Hungarian banks which were treated anonymously. The edges are transactions, i.e. unsecured loans between banks. After data cleaning I had a set of 92 619 transactions.2
3.1. Partner limits
In order to estimate the average partner limit for a bank based on the network data, the following are assumed:
- banks set limits against their potential partners;
- limits depend on the creditworthiness/risk of the borrower;
- limits are expressed as % of the lender’s total daily exposure;
- higher limit means lower partner risk, see Figure 2;
- limits are reset at the beginning of each month.
2 I thank to Gábor Benedek and Márton Michaletzky for data cleaning.
5 Figure 2: Monotonicity of partner limits, an illustration
Source: the author
Let 𝐵𝑖𝑗 stand for the nominal value of the amount borrowed from i to j. 𝑃𝑖𝑗 = ∑ 𝐵𝐵𝑖𝑗
𝑖𝑘
𝑘 is the relative share of bank j within the loan portfolio of bank i. For estimating the implicit partner limit from i to j during month t, first Pijwas calculated at a daily level, then the maximum of Pij-s was determined over the whole month. This maximum value is a lower bound for the partner limit from i to j in month t. Finally, we took the simple, equally weighted average of all estimated partner limits toward bank j:
𝐿𝑗=∑ 𝑚𝑎𝑥𝑘 𝑡(𝑃𝑘𝑗) 𝑘
(2)
This value can be supposed to approximate the real average partner limit since banks feel partner limits as real constraints according to Homolya et al. (2013).
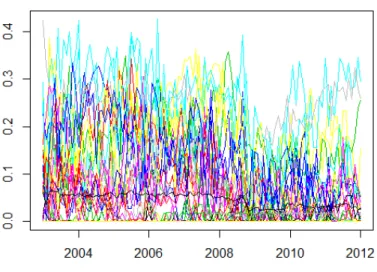
These implicit partner limits (IPLs) of the four banks with highest trading activity can be seen in Figure 3 where the red vertical line indicates the Lehman-fall.
partner risk partner limit
100%
0%
6 Figure 3: Implicit partner limits of the most important banks, by months
Source: the author
Important banks with high trading activity show two characteristic patterns for the evolvement of implicit partner limits in relation with their post-Lehman characteristics: (i) rebounding (banks 5 and 13), and (ii) stagnant (banks 20 and 11). Until the beginning of 2008, implicit partner limits were rather increasing, in 2008 they sharply dropped, and after the Lehman-fall they rebounded or they became stagnant. It’s notable, that the fall of the IPL toward these banks appears to be an effective warning signal of the forthcoming crisis. We can observe the IPLs of all the banks together on Figure 4.
Rebounding: 13, 5
Stagnant: 11, 20
7 Figure 4: Implicit partner limits for all banks, by months
Source: the author
The black line on Figure 4 shows the average IPL. Figure 5 zooms into this average and underpins that IPLs started to drop from the end of 2007.
Figure 5: Average implicit partner limits, by months
Source: the author
One can see on Figure 5 that the typical pattern of IPL over time is stagnation until the end of 2007, then sharp decrease during 2008 and stagnation again. By comparing Figures 3 and 5 we can see that the drop of the average IPL is sharper than that of the big four, therefore it seems that the average IPLs can be a more effective early warning signal.
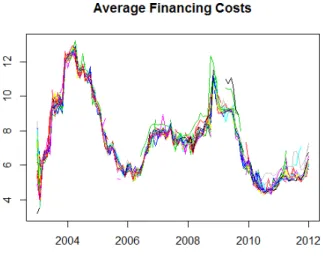
8 3.2. Interest rate
In this section the interest rates, i.e. the financing costs are examined. First of all, we calculated the average interest rate for a bank for each month (interest rates were averaged across all transactions within a month weighted by the volume of the transactions), see Figure 6.
Figure 6: Average interest rate for all banks, by months
Source: the author
In most of the time the interest rates varied within the range determined by the alternative deposit and loan conditions. However, during 2009 it happened that some banks had to borrow at very high rates outside this channel. Comparing Figures 4 and 6 one can see a much higher diversity in the partner limits than in the interest rates, which suggests that quantity adjustments might be more relevant than price adjustments.
4. Results
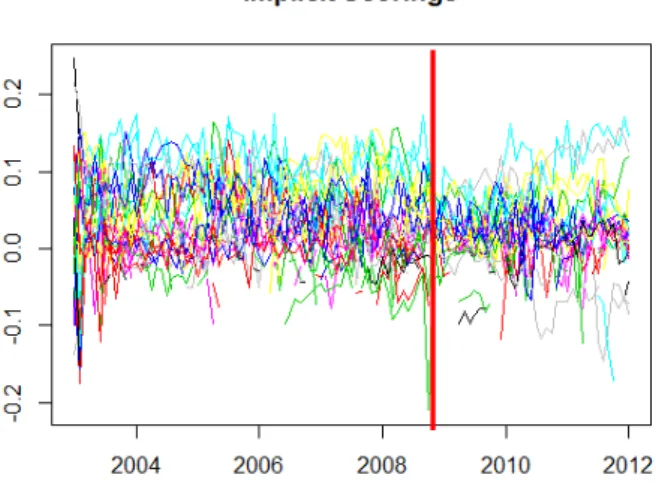
In line with formula (1), the relative differences in the partner limits and in the interest rates were calculated and combined into an implicit rating/scoring measure. In the first step the two components got equal weights (50%-50%), see Figure 7.
9 Figure 7: Implicit rating for all banks (50%-50%), by months
Source: the authors
The implicit rating measure attempts to grasp how the loan conditions were favorable in terms of partner limit and interest rate in relation of each bank. Higher measure reflects more favorable loan conditions, hence banks with higher measure can be considered as more attractive partners. Figure 8 shows the distribution of banks according to their implicit scoring after crisis (ISac).
Figure 8: Distribution of banks according to implicit rating (weights=50%-50%) in the post-Lehman period
Source: the author
The distribution is symmetric with two banks in extreme positions: Bank 13 enjoyed the best loan conditions while Bank 53 was practically excluded from this market as borrower.
13 53
10 However, the shape of the distribution changes dramatically if we give different weights to the components. Figure 10 depicts the distribution of all banks according to implicit rating if only partner limits are considered.
Figure 10: Distribution of banks according to the partner limit component in the post-Lehman period
Source: the author
The distribution of the partner limit component is asymmetric. Banks 13, 24, 7, 11, and 15 got the best partner limits. They constitute the exclusive club of best rated banks in terms of partner limits.
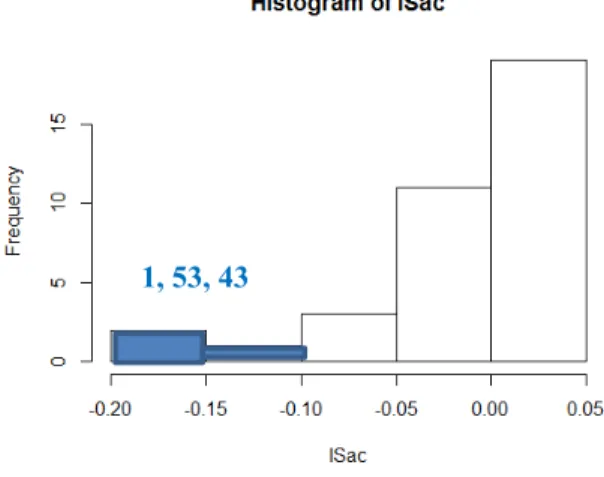
Finally, Figure 11 shows the implicit scores based solely on the interest rate.
Figure 11: Distribution of banks according to the interest rate component in the post-Lehman period
Source: the author
In this case, the asymmetry of the distribution has turned over. From this viewpoint, we can select only the bad banks (1, 53, and 43).
15, 11, 7, 24, 13
1, 53, 43
11 Therefore, we found that best banks tend to be awarded by higher partner limits while worst banks are rather punished by higher interest rates. This is consistent with convex adjustment functions both in partner limit and financing costs as it was shown on Figure 1.
5. Conclusions
Having introduced a new “implicit rating” measure combining the estimated partner limits and the interest rates from transaction data, we applied it to the Hungarian interbank market between 2003 and 2012.
Partner limits were dispersed much more around the average than interest rates. Hence, quantity adjustments were much more relevant than price adjustments and it is the average implicit partner limit which may serve as an early warning indicator.
Banks with the highest trading activity were the ones with the highest rating measure in the post-Lehman period; hence the most active banks get the best funding conditions at the same time which contributes to the stability of the network.
Acknowledgement: The research was supported by the National Bank of Hungary.
12 References
Acemoglu, D.; Ozdaglar, A.; Tahbaz-Salehi, A. (2015): Systemic risk and stability in financial networks. American Economic Review 105(2): 564-608
BCBS (2011a): A global regulatory framework for more resilient banks and banking systems.
Committee on Banking Supervision, http://www.bis.org/publ/bcbs189.pdf (downloaded on 17.07.2013)
BCBS (2011b): Global systematically important banks: assessment methodology and the additional loss absorbancy requirement. Committee on Banking Supervision, November.
http://www.bis.org/publ/bcbs201.pdf (downloaded on 17.07.2013)
Bussiere, M.; Fratzscher, M. (2006) Towards a new early warning system of financial crises.
Journal of International Money and Finance, 25(6): 953-973
Dömötör, B. (2013). Modelling optimal hedge ratio in the presence of funding risk.
In ECMS 282-287
Guttentag, J.; Herring, R. (1984): Credit Rationing and Financial Disorder. The Journal of Finance, 39: 1359-13
Holmstrom, B.; Tirole, J. (1998): Private and public supply of liquidity. Journal of Political Economy, 106: 1-40
Homolya, D.; Lakatos, M.; Mátrai, R.; Páles, J.; Pulai, Gy. (2013): Setting limits in the practice of Hungarian banks: partner limits in the focus, Review of the Hungarian National Bank (MNB), https://www.mnb.hu/letoltes/homolya-lakatos-matrai-pales-pulai-1.pdf
Jones, R. A. (1995): Credit risk and credit rationing. Discussion Paper, dp95-15, Department of Economics, Simon Fraser University.
http://www.sfu.ca/~rjones/econ811/readings/Credit.pdf
Kim, D. H.; Lee, S. J.; Oh, K. J.; Kim, T. Y. (2009): An early warning system for financial crisis using a stock market instability index. Expert Systems, 26: 260-273
Stiglitz, J.; Weiss, A. (1981): Credit rationing in markets with imperfect information. The American Economic Review, 71(3): 393-410
Sun, J.; Li, H. (2009): Financial distress early warning based on group decision making.
Computers & Operations Research (36): 885-906
Wilmott, P. (2006) Paul Wilmott on Quantitative Finance. London, Wiley and Son