Volume 24 2017 Number 2
INVITED ARTICLES
Zsuzsanna PÓSFAI∗, Gábor NAGY∗1
CRISIS AND THE REPRODUCTION OF CORE-PERIPHERY RELATIONS ON THE HUNGARIAN HOUSING MARKET
Abstract . Housing markets can be understood as indicators of the spatial pattern of capital investment under contemporary financial capitalism. We take this point of entry in order to analyze core-periphery relations around the turning point of the global financial crisis of 2007–2008 on the Hungarian housing market . The instance of crisis sheds light on patterns of homogenization and differentiation; the effects of which can be understood by exploring housing market activity on various scales from the European to the local/ regional . We argue that these two patterns of uneven development are inextricably linked and result in deepening sociospatial polarization.
Key words: uneven development, housing, spatial fix, global financial crisis, Hungary.
1. INTRODUCTION
In our paper, we will investigate the spatial patterns of capital investment on the Hungarian housing market since the turn of the millennium through the theoretical lens of uneven development; analyzing patterns of homogenization and differen- tiation on various spatial scales . By intersecting a scalar analysis with an under- standing of the dual pattern of uneven spatial development, we can grasp how homogenization – or the spread-out of capital – on one scale can mean increasing differentiation on another.
∗ Zsuzsanna PÓSFAI, Gábor NAGY, Centre for Economic and Regional Studies, Institute for Re- gional Studies, Hungarian Academy of Sciences, ‘Alfold’ department, H-5600 Békéscsaba, Szabó Dezso Street 42, Hungary, e-mails: posfai@rkk .hu; nagyg@rkk .hu
10 .1515/esrp-2017-0007
We center our analysis around the turning point of the crisis of 2007–2008 – because of the significant impact it had on the Hungarian housing market, and also because crisis is a historical instance crucial to the development of capital- ism, which also sheds stronger light on underlying mechanisms of unevenness . Concretely, on European housing markets the financial crisis of 2008 showed how European peripheries had developed a housing finance model which was strongly dependent on capital flows from the European core, leading to different forms of housing crisis and stagnating markets in the aftermath of the crisis . Through an analysis of the Hungarian housing market we will argue that this was not a coin- cidence, but a consequence of these countries’ dependent integration in the Eu- ropean (and global) financial system, in which housing played an important role.
After a brief theoretical and methodological framing we will first demonstrate how housing markets of the European periphery absorbed surplus capital from European financial markets preceding the crisis, with investment flows being re-centered to the European core following the crisis . In the second half of the paper we give an analysis of the Hungarian housing market – showing how the above-described pattern of homogenization and differentiation plays out on the national and subnational scale . Through these two chapters and scales we will argue that the period of economic growth in the early 2000s produced a certain ho- mogenization on a macro – European – scale in terms of housing market activity . However, this pattern of homogenization relied on increasing territorial and social inequalities internally (on the subnational scale), which were subsequently stabi- lized in the years of economic stagnation following the crisis . This dual dynamic also sheds light on the argument put forth by scholars of political economy and critical geography (see e .g . Vliegenthart, 2010; Hudson and Hadjimichalis, 2014) that peripheries – understood on various scales – are more vulnerable to crisis . We will conclude that these processes produce mutually dependent patterns of ho- mogenization and differentiation; resulting in increasing socio-spatial unevenness on the Hungarian and European housing markets .
2. THE SPATIALITY OF CONTEMPORARY CAPITALISM IN THE FRAME OF UNEVEN DEVELOPMENT AND DEPENDENCIES
In our paper we draw on theoretical work analyzing the spatiality of capitalism . Within this approach that links political economy and economic geography, we structure our analysis along two main lines of thought . On the one hand, we take as our conceptual starting point the notion of uneven development as developed by Neil Smith (1984), while also incorporating more recent endeavors for re-the- orizing this notion in the context of contemporary capitalism. Thus, we scruti-
nize the Hungarian housing market through the lens of the interlinked processes of homogenization and differentiation under capitalist spatial development. On the other hand, we complement this theoretical body by notions originating from world systems theory and dependency theories, analyzing core-periphery rela- tions on various scales . When thinking of cores and peripheries we strongly draw on contemporary scholars employing these notions in a scale- and context-sensi- tive; relational and process-based manner (Lang, 2015) . We believe that linking these two bodies of thought is fruitful in understanding processes on the Hungar- ian housing market . While the analytical frame of uneven development makes us sensitive to following the spatial patterns of capital investment and lends a scalar perspective, dependency theories allow for an understanding of how these pat- terns of capitalist spatial development are embedded in systematically unequal core-periphery relations .
2.1. Uneven Development under Financial Capitalism – and How it Relates to Housing
Recent work in the field of economic geography has made important steps in em- ploying the notion of uneven development to concrete institutional developments, firm strategies and to a variety of spatial scales (Dunford and Liu, 2017; Hudson, 2016; Peck, 2016) . These approaches help in understanding homogenization and differentiation both in institutional and spatial terms. In the first sense, we also build on the work of scholars writing about the financialization of housing (Aal- bers and Christophers, 2014), as well as on the idea of variegated capitalism (Peck and Theodore, 2007) . What is common to these approaches is that they understand contemporary capitalism as one dominant economic system, which, however, is articulated in varied concrete forms across different institutional and historical contexts. They analyze these concrete institutional setups and socioeconomic cir- cumstances in order to account for exactly how the systemic pressures of global fi- nancial capitalism are translated to other scales (Hudson and Hadjimichalis, 2014;
Hudson, 2016) . We thus situate ourselves theoretically between recent proposi- tions within economic geography for re-theorizing uneven development (see Peck, 2016), the post-crisis burgeoning literature on financialization (see Engelen, 2012), and writings on variegated capitalism (see Peck and Theodore, 2007) .
In the field of housing we relate to the claim that housing systems around the world are all developing in the general direction of increasing financialization – reflecting the growing importance of housing markets as spatial fixes of surplus capital (Harvey, 2014). However, markedly different trajectories persist in exactly how these housing systems develop in terms of finances, ownership, regulation, etc . (Fernandez and Aalbers, 2016) . Relating to the more concretely spatial di- mension of homogenization and differentiation on the housing market we argue
that in boom periods there is a spread-out of investment into previously unex- plored areas; spatially homogenizing the housing market in the sense that mort- gages (or other forms of financialized housing) become accessible in geographical areas and for social groups which were previously excluded. This spread-out is, however, an exploitative inclusion or overinclusion (Sokol, 2013; Aalbers, 2012) in the sense that it leads to increasing inequalities in the wake of a crisis . Patterns of deepening differentiation thus reveal how capital accumulation in one place is inherently linked to capital extraction from another.
2.2. Bringing Dependencies Back in
In our perspective the spatial patterns of capital investment and extraction are not incidental or interchangeable, and the position a given locality takes up within the global economy is crucial . For this reason, we mobilize the notions of core and periphery developed by dependency theories; employing this approach to the con- text of the European Union (Vliegenthart, 2010; Becker et al ., 2015) . We make the claim that cores and peripheries are mutually interdependent, with a systematic transfer of wealth from the periphery to the core (Arrighi, 1990) . The acknowle- dgment of this systematic nature of inequalities in the spatiality of capitalism is something that is relatively lacking even from new endeavors for theorizing un- even development; which explicitly integrate analysis on a global scale (Dunford and Liu, 2017) .
In the past few decades, credit and debt became central in how the transfer of wealth from peripheries to cores is happening (Sokol, 2013; Jessop, 2014) . On a European scale, credit poured into the European semiperiphery1 in the 1990s and 2000s was an important vehicle for the economic core of Europe to displace its own crisis (Jessop, 2014; Raviv, 2008). Since external capital invested through the financial channel can also be rapidly withdrawn, the credit boom also made the semiperiphery more vulnerable to crisis (Vliegenthart, 2010) . Mortgage credit played an important role, making housing markets of the European semiperiphery the absorbers of European surplus capital . This was also the case in Hungary:
preceding the crisis a massive mortgage boom occurred mainly financed by capi- tal channeled through the subsidiaries of Western European financial institutions.2 Following the crisis these lines of credit rapidly dried up, resulting in the near complete freeze of the Hungarian housing market (Raviv, 2008) .
1 For analyses of Central and Eastern Europe as the European semiperiphery see for example Arri- ghi 1990, Gowan 2000 .
2 For an analysis of how capital was channeled from the periphery to the core through housing finance in the years preceding the crisis both on a European and a national scale in Hungary see Pósfai, Nagy and Gál 2017 forthcoming .
2.3. Bringing the Macro-Analysis Down to a Subnational Scale
One of the main shortcomings of scholarly work conceptualizing Central and East- ern Europe as a semiperiphery is that they rarely go below the national scale in the analysis of core-periphery relations . We adhere to authors claiming that internal fragmentation and sociospatial disparities cannot be understood independently from external dependencies (Gowan, 2000) . Integrating the perspective of global positions in understanding intra-national spatial unevenness became important in recent work in the field of economic geography (see Hudson, 2016; Dunford and Liu, 2017; Hürtgen, 2015) . This re-theorizing on a global scale can be linked to the need for a return to more macroscopic/structuralist explanations in the wake of the global financial crisis of 2008. At the same time, these new attempts at theo- ry-building about the spatiality of capitalism also take theoretical developments of the past 20 years seriously and strive to incorporate more networked, fragmented and nuanced understandings of uneven development relating to institutions, polit- ical context and scale (which were developed during the 1990s and 2000s).
As a result, this perspective can also help in understanding processes of pe- ripheralisation on a subnational scale, underlining the fact that cores and pe- ripheries are dynamic categories embedded in a multiscalar way . A certain place can have different positions in terms of peripherality or centrality depending on the scale we are looking at (Hudson and Hadjimichalis, 2014) . We understand
‘scales’ as analytical and conceptual devices and not as mutually exclusive, bounded spatial and institutional categories (MacLeod and Goodwin 1999) . For instance, a wave of investment from financial institutions of the European core towards housing markets of CEE countries can be seen as a process of homog- enization on a European scale, but is most likely to produce further differenti- ation on the scale of national housing markets . In our analysis we will attempt to grasp the processes of homogenization and differentiation inherent to uneven development, as well as of overinclusion and recentering of capital on various scales. We will explore how cores and peripheries are mutually dependent, look- ing specifically at how the economic crisis affected this relation in the context of the Hungarian housing market .
3. METHODOLOGICAL OBSERVATIONS AND LIMITATIONS
In our paper we produce a theoretically guided statistical analysis of the dynamics of the Hungarian and – to a limited extent – European housing markets. In our analysis we employ a scalar analysis based on statistical data issued by institutions attached to the European (the European Mortgage Federation – EMF), and to the national (the Hungarian Central Statistical Office – HCSO) scale.
The descriptive analysis of data sets produced by the HCSO constitutes the foundation for the arguments put forward in this article (referenced as ‘KSH 2016’
throughout the article) . We rely mainly on data about housing constructions, trans- actions and prices on the municipality level from 2000 to 2014 . These data sets have important limitations – first of all, due to data collection methods certain data is not available for the years preceding 2008 (specifically: house prices and transactions for non-urban municipalities; and with some gaps of data in the case of certain cities as well) . Furthermore, due to principles of data privacy, data for municipalities with a very low number of housing transactions is not made availa- ble . This led to small instances of data loss for years when housing market activity was very low . Altogether, 80–90% of transactions appear in the case of larger municipalities, and somewhat less for small ones .
Furthermore, we are very aware of the limitations inherent to analyzing only a very restricted pool of housing market indicators – although we have grounded our choice in all cases . With this data set we can mainly shed light on the changes in the housing sector – which, however, only affect a small part of the total stock (even on the peak of housing market activity in 2007, transactions only involved 4,3% of the total stock) . House prices are also calculated solely based on real transactions, which can be very different from estimated values of the complete existing housing stock. Nevertheless, we believe the changing part of the housing sector gives important explanations about broader processes and sheds light on the mechanisms of capital investment in housing . We are also aware of the lim- itations of a principally statistical analysis – the results presented here must be taken further by qualitative research shedding light on the driving forces behind the development of the housing market .
4. SPREAD-OUT AND RECONCENTRATION ON THE EUROPEAN SCALE The first decade of the millennium was a period of global capital abundance, which translated into a credit boom in many places of the global economy . This can be interpreted as a period when the homogenizing nature of uneven development was predominant on a European scale, with the scale of capital accumulation becoming more international (Smith, 2003) and capital spreading out to new markets and spac- es. During this period housing became an increasingly important spatial fix, and the spread of a credit-fueled, indebtedness-based housing model of homeownership sig- naled homogenizing tendencies on European housing markets . However, this hous- ing model did not unfold in exactly the same way or at the same time everywhere in Europe – local institutional and historical conditions remain important .
In Central and Eastern Europe the liberalization of financial markets and the process of adhesion to the EU opened the door for investment from Western Eu-
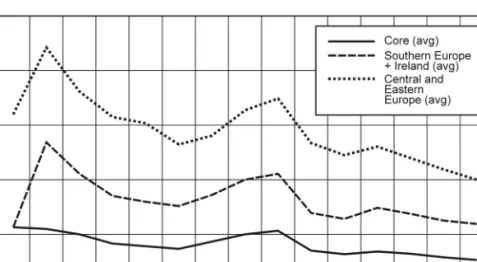
ropean financial institutions (Hudson and Hadjimichalis, 2014), which actively started entering the market of individual mortgages in the region (Bohle, 2013) . Consequently, mortgages became a crucial driving force behind the functioning of the housing market and a financialized housing regime unfolded. In Hunga- ry the housing market boom in the early 2000s is often solely attributed to new state policies supporting homeownership through subsidized mortgages, liberaliz- ing the banking sector and providing the legal framework for mortgage issuance (Hegedüs and Somogyi, 2016) . The role of the state in this process is unquestion- able, however it is important to see how these policy measures channeled macro- economic push-factors relating to the need for market expansion driving Western European financial institutions (Raviv, 2008). This need for market expansion was dominant in how and when certain policy instruments were introduced, and lead to similar outcomes in other countries of the European periphery as well . In a con- text of declining rates of profitability and saturating mortgage markets in Western Europe (Raviv, 2008), CEE countries with systematically higher interest rates (see Fig . 1)3 were a promising field for the investment of a global ‘wall of money’ (Fer- nandez and Aalbers, 2016) searching for yields .
Fig . 1 . Representative interest rates on new residential loans; annual average based on monthly figures, in percent, in different European country groupings
Source: European Mortgage Federation 2015
3 For this graph we have grouped the countries with available data in the following way: ‘core’: Au- stria, Belgium, Denmark, Finland, France, Germany, Italy, Luxembourg, Netherlands, Sweden, United Kingdom; ‘Southern Europe and Ireland’: Cyprus, Greece, Ireland, Malta, Portugal, Spain; ‘Central and Eastern Europe’: Bulgaria, Croatia, Czech Republic, Estonia, Hungary, Latvia, Lithuania, Poland, Ro- mania, Slovakia, Slovenia . We base this categorization primarily on Arrighi’s notion of the semiperiphe- ry (Arrighi), modified by the type of housing regime these countries have (Fernandez and Aalbers 2016).
This led to a situation where globally available cheap money was channeled into the housing markets of European peripheries, providing significant yields for the financers (some banks entering the region earned the majority of their profits here – Raviv, 2008) and significant risks for the borrowers.
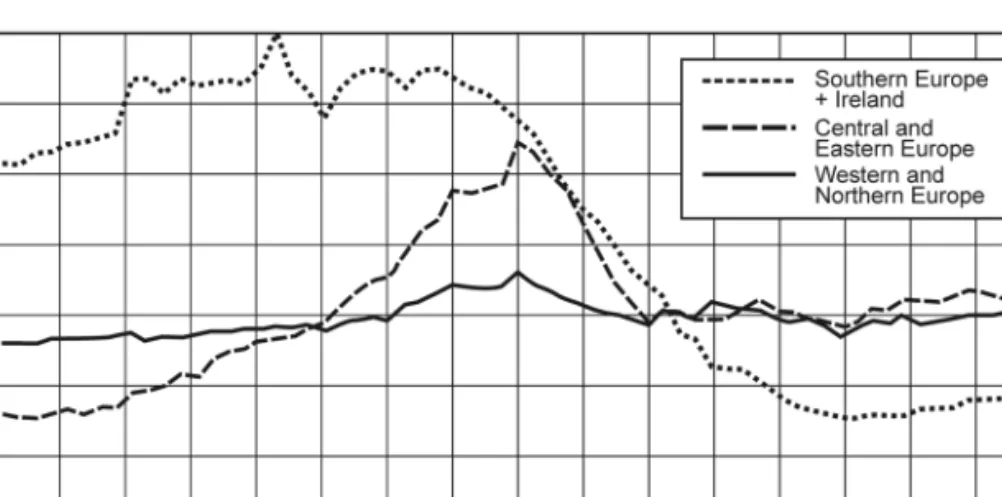
The rapid increase in crediting activity resulted in booming housing mar- kets in many countries of the European periphery . Indices of construction volume (Fig . 2)4 and of housing prices (Fig . 3)5 increased more rapidly in these countries than in the core. This period of expanding housing market activity appeared to be a much-needed ‘relaunch’ of housing markets (and real estate industry), which was politically often coined as the awaited development of a ‘healthy’ capitalist housing market in post-socialist CEE countries . However, the vulnerability of this housing finance model became apparent following the crisis when investment in the housing sector abruptly stopped on the peripher- ies of Europe and was recentered into safer core markets, in which the German housing market was dominant (European Mortgage Federation, 2015; Wiegand et al ., 2016) .
Fig. 2. Volume index of housing construction; quarterly in different European country groupings (2010 yearly average = 100)
Source: Eurostat 2016
4 For this graph we have grouped the countries with available data in the following way: ‘core’:
Belgium, Denmark, Germany (until 1990 former territory of the FRG), France, Italy, Luxembourg, Netherlands, Austria, Finland, Sweden, United Kingdom; ‘Southern Europe and Ireland’: Ireland, Greece, Spain, Cyprus, Malta, Portugal; ‘Central and Eastern Europe’: Bulgaria, Czech Republic, Estonia, Croatia, Latvia, Lithuania, Hungary, Poland, Romania, Slovenia, Slovakia .
5 For this graph we have grouped the countries with available data identically as in the case of Fig . 1 .
Fig. 3. Nominal house price indices in different European macro-regions (2006 = 100) Source: European Mortgage Federation, 2015
The volatility of housing prices on the peripheries of Europe compared to the stability of core housing prices, sheds light on how the housing markets of peri pheral European countries are exposed to capital fluctuations happening on a transnational scale . The fact that certain core markets managed to maintain or slightly increase house prices even during the crisis period (Eurostat, 2016) was a clear sign of capital re-concentrating in these markets .
In our analysis we focus on data sets that grasp processes and change on Eu- ropean housing markets (and not stocks of outstanding mortgages or volumes of construction, for instance) . This is a choice taken in order to shed light on the dependency (brought to the surface by the historical instance of crisis) and volatility which we consider to be central to core-periphery relations . We claim that it is not incidental that peripheral housing markets reflect patterns of higher volatility, but understand this as a consequence of their dependent integration in the broader – in this case European – economic space . Because of a chronic lack of capital, the financial sectors of peripheral countries largely depend on external financing, which can easily be withdrawn in times of crisis (Becker et al ., 2015) .
The withdrawal of international capital from the housing markets of the Eu- ropean periphery also had significant consequences on the uneven development of housing market activity locally . In the following section we will analyze how the dual patterns of homogenization and differentiation played out in the uneven development of the Hungarian housing market in times of crisis .
5. UNEVEN DEVELOPMENT AND CRISIS ON THE HUNGARIAN HOUSING MARKET
During the credit boom of the early 2000s increasing segments of Hungarian soci- ety were integrated in a debt-based regime of homeownership (Bohle, 2013) . Our argument is that this inclusion of new social and spatial segments in a financialized housing regime actually resulted in deepening socio-spatial inequalities – producing differentiation inherent to uneven development on the subnational scale.
The level of housing construction and transactions, but also the level of private indebtedness was very low throughout the 1990s (Bohle, 2013) . This served as the basis for the introduction of a state-subsidized mortgage program in 2000 that strongly promoted further access to homeownership and new construction . The target groups of the program were continuously broadened (as a result the level of indebtedness of Hungarian households jumped from 5% to 31% of GDP between 2000 and 2008 – MNB 2016a), making it clear that – similarly to other European countries – the only mode of access to housing supported by government policy was a model of private indebtedness-based homeownership (Hegedüs and Somo- gyi, 2016; Bohle, 2013) . By the time the state subsidized mortgage program was stopped for budgetary reasons in 2004, the liberalization of the financial sector was sufficiently advanced to open the way for international financial institutions to enter the Hungarian mortgage market . There was thus an increase in foreign capital coming into the country through the banking sector and being distributed as mortgage loans from 2004 onwards (Smith and Swain, 2010) . According to the Hungarian National Bank, households acquiring mortgages in the forex-mortgage period generally had lower income and education levels than debtors of previ- ous years, signaling riskier mortgage lending practices (Dancsik et al ., 2015) . Furthermore, the disbursed loans also had riskier structures (such as over 90%
loan-to-value ratios) . This did not produce any visible problems in the period of economic growth preceding the crisis, however, with the economic meltdown and disinvestment the country experienced after 2008, more and more of these mort- gages started defaulting . This is the mechanism based on which we claim that the social expansion of the housing market was overinclusive (Aalbers, 2011) and contributed to the production of new social inequalities in the mid-term .
Furthermore, we argue that processes on the Hungarian housing market before the crisis also reflected a pattern of spatial overinclusion (Aalbers, 2011; Dymski, 2009) . During this period, many households acquired property in areas where real estate prices dropped significantly after the crisis, thus leaving them with negative equity and unsellable property . The geography of these blocked housing markets will be analyzed in later sections .
Following the crisis – as a consequence of the externally dependent housing finance system that was built up before the crisis – the drying up flows of foreign
capital meant an abrupt halt of crediting activity and a freeze of the housing mar- ket on a national scale . Real house prices dropped by 57,5% on average between the end of 2007 and the end of 2013 (MNB 2016b), and the number of transactions dropped by more than 50% (KSH 2016) . This general freeze does, however, cover some important disparities on finer geographical scales – both among regions of the country and between cities and smaller settlements . The following sections give an analysis of these finer patterns of uneven development.
5.1. New Construction Reflects the Spatial Unevenness of Capital Investment Most Directly
Data on housing construction is important from the point of view of our analysis because new construction reflects capital channeled in the housing market in the most direct way, and also very explicitly shows the volatility of these investments on the (semi)periphery . House prices of new housing are systematically much higher than of existing (in 2009, for instance, new house prices were 167% of existing house prices on a national average – KSH 2016), it is thus in this segment of the housing market that spatial inequalities can be most explicitly grasped. In- creasing levels of housing construction in the years of the housing boom between 2000 and 2008 reflected marked territorial disparities – strengthening patterns of differentiation on the subnational scale.
During the first phase of the housing boom the share of Budapest and other main cities in new construction rapidly increased, accounting for around half of all new construction by 2004 (Fig . 4) .6 After 2004 the share of larger cities started declining to the advantage of smaller cities. This was the period when forex-mortgages were introduced and housing credit became more accessible . As a result housing market activity broadened spatially (homogenization), while also producing increasing in- equalities (inherent differentiation). The share of villages in new construction con- tinuously declined from the end of the 1990 onwards7 – producing a new pattern of divergence between urban and rural housing markets . Due to the introduction
6 The category of ‘cities’ designates county seats and large cities that have an administrative status equivalent to county seats . Altogether, this group represents the 23 largest cities in Hungary (beside Budapest) . We use the category of ‘towns’ for all the other settlements with an urban status . We will use these categories in this way throughout the paper . The share of the capital city in new con- struction climbed from 14% to 30% between 2000 and 2005, while the share of county seats also increased up to over 25% by 2004 .
7 This decline in the share of villages can also be due to the fact that many villages were admini- stratively transferred to the category of town/city – especially the ones that experienced population growth (eg . in the suburban area of Budapest) . Data from various municipalities is organized ac- cording to the administrative category they belonged to in each given year . In the following we will designate cities and towns as ‘urban’ and villages as ‘rural’ housing markets .
of various mortgage schemes professional developers entered the housing market, concentrating their activity on more stable urban markets (only 2–5% of housing constructed by real estate developers was realized in villages – KSH, 2015) .
Fig . 4 . New housing construction by 1000 inhabitants in Hungary by settlement types Source: Hungarian Central Statistical Office – Housing Statistical Yearbooks, 1997‒2015
Following the crisis, construction levels drastically dropped: since this is the most capital intensive sector of the housing market, the lack of housing credit af- fected it very directly . The small volumes of remaining construction were concen- trated to Budapest and to the traditionally wealthy Györ-Moson-Sopron county bordering Austria .
In spite of the importance of this sector we think it is a trap to study only new construction in relation to shifts on the housing market because of its limited scope . Even in 2008, at the peak of housing construction, new housing only rep- resented a little over 9% of all housing transactions, mainly concentrated in large cities (KSH, 2016) .
Going beyond new construction, an analysis of the geographical dispersal of all housing transactions is an important indicator of how fluid / mobile a given housing market is – especially on a housing market which is as much dominated by homeownership as the Hungarian one (over 90% of housing is owner-occu- pied), and where other modes of access to housing are limited . In combination with price levels, transactions also reflect the geographical areas where capital is being channeled into the housing market, and where processes of peripheralisa- tion are dominant . The Hungarian housing market generally froze after 2008, with the number of transactions halving between 2007 and 2013 (KSH, 2016) . If we consider the whole of the market, this decrease was quite evenly distributed on
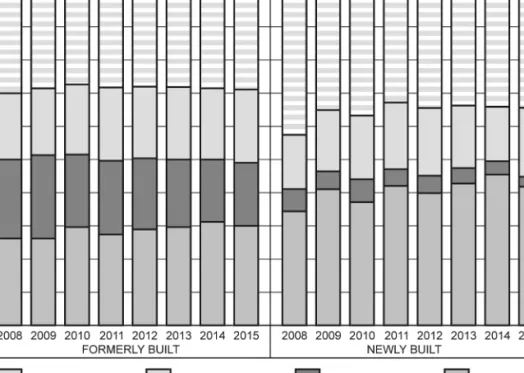
different spatial scales. However, a distinction between transactions of new and existing housing units makes it apparent that as a result of the crisis the market of new housing became even more polarized, with a strong urban – and predomi- nantly Budapest-centered – concentration (see Fig . 5) .
Fig. 5. Polarization of house transaction numbers in two different market segments (related to the total number of trasactions nationally)
Source: Hungarian Central Statistical Office – House prices and house transactions, Quarterly Newsletter, 2016 Q1 .
5.2. Peripheral Housing Markets are More Volatile
The housing market boom of the early 2000s resulted in a general house price increase which is a characteristic of credit-fueled housing transactions (Aalbers, 2008) . Based on a comparison of changes in urban house prices during the pre-cri- sis boom (2000–2008) and the crisis period (2008–2013), one of the tendencies we see is that many of the cities/ towns experiencing rapid price increases during the former period were also the ones that registered the most drastic declines dur- ing the latter .8 We see this as a consequence of spatially overinclusive mortgage
8 Due to methodological constraints we only have an overview of how house prices changed in cities in the period preceding the crisis– but since cities represented 78% of all transactions in 2008,
lending, which drove prices relatively high in economically underprivileged areas . Changes in house prices show stronger inequalities and oscillations around the turning point of the crisis than transaction numbers, since they are more direct in- dicators of the financialization of housing and of the inequalities of capital invest- ment in housing . The largest volatility in house prices can be observed in towns and cities which are situated in disadvantaged geographical regions (MNB, 2016b) . In the region of Northern Hungary, for instance (most affected by post-fordist structural transformation) this meant a drop of more than 80 percentage points between 2008 and 2014. The three most extreme examples of this volatile pattern are Mórahalom (172% price increase between 2000 and 2008), Pécsvárad (156%
increase) and Sajószentpéter (140% increase) (see Fig . 6) .9 These towns can be seen as peripheral on a national scale, and are also strongly dependent on local urban centers, being the suburbs of Szeged, Pécs and Miskolc (three major cities) respectively . However, compared to their immediate environments, these subur- ban towns are relatively prosperous . They can thus be seen as peripheries embed- ded in a multiscalar way, or – from a different perspective – externally dependent small-scale local cores . The volatility of their housing markets is a manifestation of their multiply dependent position .
In contrast, larger cities – which we see as regional cores on a national scale – and towns with a stable economic base (such as Paks – where Hungary’s only nuclear power plant is situated, or Balatonfüred – which is the high-end touristic center of the Lake Balaton) could maintain more stable house prices with less boom and less bust before and after 2008 . It is telling that the county seat with the most important real price hike between 2000 and 2008 was Miskolc (+91 .6%), which is one of the strongly declining industrial cities of Northeastern Hungary .
The contradictory spatial effects of pre-crisis overinclusive mortgage lending can also be traced in villages with a significant number of acquisitions by the National Asset Manager (NET) .10 Because of the very low number of rural house transactions, the activity of the NET could have a significant impact on locally
we argue that it is relevant to give an analysis of only urban housing markets . Furthermore, it is important to note that in this analysis of changes in house prices, we did not account for the number of transactions this data comes from (data on house prices is based on actual transactions) . Thus, it is possible that certain local markets show higher volatility due to a relatively low number of transactions . Nevertheless, we claim that the observations made on the issue of volatility are valid .
9 On this map we indicate the change in price levels in percentage points between the beginning and the end of the given period . Thus 2008 average prices are compared to prices in 2000, and 2013 prices to 2008 prices . We have selected cities and towns to be represented on the map which had the most volatile housing markets in terms of price level increases and drops in these two periods . Apart from the most volatile markets, some more important cities are also included, as well as a few that have more stable housing markets .
10 The National Asset Manager is a state agency dedicated to buying up the property of defaulting forex-mortgage debtors. It has been active since 2012 and negotiates the acquisition of housing units registered as collateral for defaulting mortgages at around half of their book value .
Fig . 6 . Volatility of house prices in relation to purchasing power parity Source: data GfK Hungary 2015 and Central Statistical Office 2016, ed. G. Dudás
peripheral housing markets, further depreciating house prices in these localities . The most affected counties are those of Northeastern Hungary – which are also among the economically most disadvantaged on a national scale . Peripheral hous- ing markets are thus more vulnerable to crisis on various scales – from the suburbs of nationally peripheral urban centers to the regional scale .
5.3. Conjuncture Increases Spatial Inequalities, Crisis Conserves them – along Stable Patterns
In the years preceding the crisis – in a general period of conjuncture – there was an important increase in housing market activity, which increased spatial inequalities, due to the more rapid growth of core areas . Following the crisis these inequalities were stabilized and in some cases accentuated, reflecting long-standing patterns of spatial unevenness: Budapest is always extremely dominant in all indicators; the urban-rural divide is very strong; and western regions systematically have better indicators than their eastern counterparts . As a result of the crisis these inequalities have been conserved and in some cases deepened .
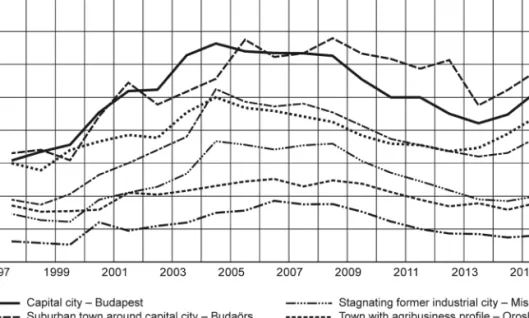
Cities concentrate the vast majority of housing market activity, but their price levels show very important and persistent disparities according to their socioeco- nomic profile and geographical position. These disparities can be demonstrated through the example of a few selected cities. For instance, the price levels of a wealthy suburb of Budapest (Budaörs) were more than seven times higher than those of Ózd, a peripheral postindustrial city in 2015, and these ‘positions’ in the hierarchy of real estate value do not change significantly over time, while also having a tendency to accentuate (see Fig . 7) .11
Fig . 7 . Changes in house prices of selected cities, based on 1997 price level (HUF/sqm) Source: authors’ own calculation based on Hungarian Central Statistical Office – Settlement level
data source, 2016
These relatively stable inequalities of the housing market can also be recog- nized on the national scale . In the following section we give an overview of how housing market size (understood as a combination of price levels and transac- tion numbers) was affected by the crisis throughout the country. Housing markets shrank everywhere, but this shrinkage was clearly stronger in eastern regions of the country, while western cities such as Györ or Sopron were much less affected
11 In this graph we show seven selected cities, which have been selected according to their cha- racteristic and diverse geographical and socioeconomic positions . They are not representatives of specific typologies, but nevertheless draw a characteristic image of patterns of polarization on the Hungarian housing market .
(see Fig . 8) .12 The largest cities continue to strongly dominate housing market activity following the crisis (regardless of their geographical position), and the housing markets of smaller cities were generally more strongly affected (apart from a few exceptions such as Paks).
Fig . 8 . Size of local housing markets in 2008 and 2013 in selected cities based on transaction numbers and average prices, corrected by inflation
Source: Hungarian Central Statistical Office – Settlement level data source, 2016, ed. G. Dudás
A different analysis combining price levels and transaction numbers shows the drastic increase in areas with low price levels and low housing market activity in the wake of the crisis (see Fig . 9) .13 The spatial patterns of the changing hous- ing market in crisis years are very apparent: the housing markets of local urban centers declined, while two new strongly differentiated housing markets emerged.
The suburban ring of Budapest maintained high prices in spite of a drop in the number of transactions, and housing markets of smaller cities in eastern Hungary
12 For this indicator we have multiplied the number of transactions and average price levels for selected cities .
13 For these maps we have included settlements with at least 3 transactions in every year between 2008 and 2013, and with at least 20 transactions in 2008 . This meant that altogether 324 settlements were included in the analysis (which had the most ‘active’ housing markets in the years following the crisis) . Thresholds of categories: For price levels: Low: under 60 .000 HU/sqm; Medium: 60 to 100 .000 HU/
sqm; High: Over 100 .000 HU/sqm . For transaction levels: Low: Less than 10 transactions/1000 housing units; Medium: 10 to 20 transactions/1000 housing units; High: Over 20 transactions/1000 housing units . The names of county seats falling into one of the colored categories appear on the map .
Fig . 9 . The shifting geography of core and peripheral housing markets in Hungary, 2008 and 2013 Source: Hungarian Central Statistical Office – Settlement level data source, 2016, ed. G. Dudás
(especially the Great Plains region) froze . Furthermore, certain marginal areas became completely immobile in terms of housing market activity, also leading to blocked channels of household mobility .
Altogether, our statistical analysis of the Hungarian housing market has shown how processes of homogenization and differentiation inherent to uneven spatial development A) are mutually dependent on each other and B) unfold in a varie- gated way on different spatial scales. We cannot determine a linear direction of peripheralisation, or a geographically limited category of a peripheral housing market . At the same time, the instance of crisis sheds light on how spatial inequal- ities persist and are continuously reinforced by cycles of capitalist development .
6. CONCLUSIONS
In our paper we have argued that the boom on the Hungarian housing market between 2000 and 2008 has to be understood in the broader context of economic conjuncture and of a Europe-wide increase of housing crediting . This was a pe- riod when, due to certain macroeconomic circumstances surplus capital was in- creasingly invested in housing; including new social and spatial segments in an indebtedness-based housing regime . This model consequently increased social and spatial inequalities on the housing market . On a European scale this meant a certain homogenization between cores and peripheries, with house prices and loan-to-GDP ratios increasing more rapidly on peripheries, resulting in an ‘equal- ization’ of these indicators . Within the Hungarian national economy this process also produced a social and spatial expansion of housing finance and thus of hous- ing market activity, but produced increasing spatial inequalities in terms of hous- ing market-related indicators (such as house prices or construction numbers) . We can thus establish that this period of capital expansion produced different pat- terns of homogenization and differentiation on different scales. Patterns of uneven development on the Hungarian housing market in the years preceding the crisis support the claim put forward by new studies in economic geography; that the growth of the periphery in terms of gross outputs necessarily relies on the internal fragmentation/ differentiation of these peripheral countries (Hürtgen, 2015). The rapid growth of local cores (national capitals) in the CEE region was the basis for optimistic investment perspectives in these countries – resulting in deepening spatial inequalities in the aftermath of the economic and financial crisis of 2008.
After 2008 credit flows towards the housing markets of the European periphery were rapidly blocked and capital was reoriented towards the more stable housing markets of the European core, where this lead to new waves of housing financial- ization . In Hungary, the post-crisis period brought the freeze of housing market activity on the national scale and inequalities produced during the boom period
were stiffened and in many cases gradually deepened. This can be understood as a period of homogenization in the sense that rapid house price increases of the capital city and other urban centers slowed down . However, this was a period when it became clear on all scales that peripheries are more vulnerable to crisis . On a European scale the housing markets of Southern and Eastern Europe were strongly affected, leading to various forms of housing crisis in these countries.
On a national scale in Hungary, the economically better-faring cities (mainly Bu- dapest and a few cities in the western part of the country) were the only ones to maintain any housing market activity in the years between 2008 and 2014 . On a local scale we argued that multiply dependent (but not the most marginalized) second-tier and suburban cities were most affected by a wave of overinclusive mortgage lending and by the post-crisis crash of housing markets .
Currently, in a macroeconomic environment of very low interest rates and sta- bilizing economic growth on the European peripheries, surplus capital is yet again starting to flow towards housing markets of these countries. This produces new forms of housing financialization and of predatory overinclusion – such as the ap- pearance of new transnational landlords capitalizing on housing stock left behind by a wave of defaulting mortgages in Southern European countries (Fields and Uffer, 2016) . In Hungary, this new wave of investment in housing manifests itself through rapidly increasing housing construction activity and (with heavy state support) new- ly expanding mortgage lending.14 This ‘relaunch’ is, however, extremely selective and projects a new period of strongly increasing socio-spatial disparities .
REFERENCES
AALBERS, M. B. (2008), ‘The financialization of home and the mortgage market crisis’, Compe- tition & Change, 12, pp . 148–166 .
AALBERS, M . B . (2011), Place, Exclusion and Mortgage Markets, Hoboken, NJ: Wiley-Blackwell . AALBERS, M . B . (2012), Subprime Cities: The Political Economy of Mortgage Markets, Ho-
boken, NJ: Wiley-Blackwell .
AALBERS, M . B . and CHRISTOPHERS, B . (2014), ‘Centering housing in political economy”, Housing, Theory and Society, 31, p. 373‒394.
ARRIGHI, G . (1990), ‘The Developmentalist Illusion: A Reconceptualization of the Semiperiph- ery’, [in:] MARTIN, W . G . (ed .), Semiperipheral States in the World-Economy, Westport, CT:
Greenwood Press, pp . 11–42 .
BECKER, J ., JAGER, J ., and WEISSENBACHER, R . (2015), ‘Uneven and dependent develop- ment in Europe – the crisis and its implications’, [in:] JAGER, J . and SPRINGLER, E . (eds .), Asymmetric crisis in Europe and possible futures, New York: Routledge, pp. 81‒93.
14 In 2015 mortgages were used for 39% of all transactions (KSH 2015, 2016) – and currently the number of new household mortgages for buying existing housing units is rapidly increasing (MNB 2016). Furthermore, the loan-to-value ratios which had declined significantly in the aftermath of the crisis are currently slowly increasing again (standing at average 55% now – MNB 2016) . Thus, increasing housing market activity is yet again being financed by expanding household crediting.
BOHLE, D. (2013), ‘Post-socialist housing meets transnational finance: Foreign banks, mortgage lending, and the privatization of welfare in Hungary and Estonia’, Review of International Po- litical Economy, 21 (4), pp . 913–948 .
DANCSIK, B ., FÁBIÁN, G ., FELLNER, Z ., HORVÁTH, G ., LANG, P ., NAGY, G ., OLÁH, Zs . and WINKLER, S . (2015), ‘Comprehensive analysis of the nonperforming household mortgage portfolio using micro-level data’, MNB Occasional Papers Special Issue.
DUNFORD, M . and LIU, W . (2017), ‘Uneven and combined development’, Regional Studies, 51(1), pp . 69–85 .
DYMSKI, G. (2009), ‘The Global Financial Customer and the Spatiality of Exclusion after the end of Geography’, Cambridge Journal of Regions, Economy and Society, 2, pp . 267–285 .
ENGELEN, E . (2012), ‘Crisis in Space: Ruminations on the Unevenness of Financialization and its Geographical Implications’, [in:] BARNES, T . J ., PECK, J . and SHEPPARD, E . (eds .), The Wiley-Blackwell Companion to Economic Geography, Hoboken, NJ: Blackwell, pp . 242–257 .
European Mortgage Federation (2015), Hypostat 2015. A Review of Europe’s Mortgage and Hous- ing Markets .
FERNANDEZ, R . and AALBERS, M . B . (2016), ‘Financialization and Housing: Between Glo- balization and Varieties of Capitalism’, Competition and Change, 20 (2), pp . 71–88 .
FIELDS, D . and UFFER, S. (2016), ‘The financialisation of rental housing: A comparative analysis of New York City and Berlin’, Urban Studies, 53 (7), pp . 1486–1502 .
GOWAN, P . (2000), ‘Peripheralisation of Central and Eastern Europe in the 1990s’, Labour Focus on Eastern Europe, 65, pp. 43‒73.
HARVEY, D . (2014), Seventeen Contradictions and the End of Capitalism, Oxford: Oxford Uni- versity Press .
HEGEDÜS, J . and SOMOGYI, E . (2016), ‘Moving from an Authoritarian State System to an Au- thoritarian Market System: Housing Finance Milestones in Hungary between 1979 and 2014’, [in:] LUNDE, J . and WHITEHEAD, CH . (eds .), Milestones in European Housing Finance, Hoboken, NJ: Wiley, pp . 201–218 .
HUDSON, R . (2016), ‘Rising powers and the drivers of uneven global development’, Area Devel- opment and Policy, 1 (3), pp . 279–294 .
HUDSON, R . and HADJIMICHALIS, C . (2014), ‘Contemporary crisis across Europe and the crisis of regional development theories’, Regional Studies, 48, pp . 208–218 .
HÜRTGEN, S . (2015), ‘Das Konzept der strukturellen Heterogenität und die Analyse fragmentiert- er Wachstumsgesellschaften in Europa’, Working Paper der DFG-Kollegforscher Innengruppe Postwachstumsgesellschaften, No . 2, Jena: Friedrich-Schiller-Universität .
JESSOP, B . (2014), ‘Variegated Capitalism, das Modell Deutschland, and the Eurozone Crisis’, Journal of Contemporary European Studies, 22 (3), pp . 248–260 .
LANG, T . (2015), ‘Socio-economic and political responses to regional polarisation and socio-spa- tial peripheralisation in Central and Eastern Europe: a research agenda’, Hungarian Geograph- ical Bulletin, 64 (3), pp . 171–185 .
MacLEOD, G ., and GOODWIN, M . (1999), ‘Space, scale and state strategy: rethinking urban and regional governance’, Progress in Human Geography, 23 (4), pp . 503–527 .
PECK, J . and THEODORE, N . (2007), ‘Variegated capitalism’, Progress in Human Geography, 31 (6), pp . 731–772 .
PECK, J . (2016), ‘Macroeconomic geographies’, Area Development and Policy, 1 (3), pp. 305‒322.
RAVIV, O. (2008), ‘Chasing the dragon east: exploring the frontiers of Western European finance’, Contemporary Politics, 14 (3), pp . 297–314 .
SMITH, N . (1984), Uneven Development: Nature, Capital, and the Production of Space . Athens, GA:University of Georgia Press .
SMITH, N . (2003), ‘Remaking Scale: Competition and Cooperation in Pre-National and Post-Na- tional Europe’, [in:] BRENNER, N ., JESSOP, B ., JONES, M . and MacLEOD, G . (eds .), State/
Space – A Reader, Hoboken, NJ: Blackwell, pp. 227‒238 .
SMITH, A . and SWAIN, A . (2010), ‘The global economic crisis, Eastern Europe, and the Former Soviet Union: models of development and the contradictions of internationalization’, Eurasian Geography and Economics, 51, pp . 1–34 .
SOKOL, M. (2013), ‘Towards a ‘newer’ economic geography? Injecting finance and financiali- sation into economic geographies’, Cambridge Journal of Regions, Economy and Society, 6, pp . 501–515 .
VLIEGENTHART, A . (2010), ‘Bringing Dependency Back in: The Economic Crisis in Post-So- cialist Europe and the Continued Relevance of Dependent Development’, Historical Social Re- search / Historische Sozialforschung, 2 (132), pp . 242–265 .
WIEGAND, F ., PETZOLD, T ., MULLIS, D . and BELINA, B . (2016), ‘Durch Athen auf Frankfurt blicken Austerity Urbanism. Uneven Development und Alltäglichkeit – Reflektionen aus zwei Workshops’, Sub\Urban. Zeitschrift für Kritische Stadtforschung, 4 (2/3), pp . 303–312 .
SOURCES FOR STATISTICAL DATA
European Mortgage Federation (EMF) (2015): statistics compiled by the EMF on mortgages, inter- est rates and house prices on a European scale (25 .11 .2015) .
Eurostat (2016): statistics of housing construction indices on a European scale (Production in con- struction – quarterly data), http://ec .europa .eu/eurostat/web/short-term-business-statistics/data/
database (23 .05 .2016) .
Központi Statisztikai Hivatal (KSH – Central Statistical Office) (2015): Lakásstatisztikai Évkönyv (Yearbook of housing statistics) (6 .12 .2016) .
Központi Statisztikai Hivatal (KSH – Central Statistical Office) (2016): statistics on housing con- struction, transactions and house prices compiled on individual request (16 .06 .2016) .
Magyar Nemzeti Bank (MNB – Hungarian National Bank) (2016a): statistics on household mort- gages, http://www.mnb.hu/statisztika/statisztikai-adatok-informa-ciok/adatok-idosorok/x-mon- etaris-es-egyeb-merlegstatisztikak (19 .02 .2015) .
Magyar Nemzeti Bank (MNB – Hungarian National Bank) (2016b): aggregated house price in- dex, http://www.mnb.hu/statisztika/statisztikai-adatok-informaciok/adatok-idosorok/vi-arak/
mnb-lakasarindex (6.12.2016).