dOi: 10.1556/168.2018.19.2.5
Introduction
Gap formation is part of the natural regeneration pro- cesses in temperate forests (Pickett and White 1985, Runkle 1989, Brokaw and Busing 2000, Schnitzer and Carson 2000).
Artificial gaps created by modelling these processes can be essential in close-to-natural forest management techniques and achieving continuous forest cover (Klimaszewski et al.
2005, Goßner et al. 2006, Matveinen-Huju and Koivula 2008, Siira-Pietikäinen and Haimi 2009, Debnár et al. 2016), which could mitigate the artificial disturbances and increase the naturalness of the managed forests (Bengston et al. 2000).
Since the application of these techniques has relatively short history in Hungary (Gálhidy 2016), their effects on the for- est ecosystems and on forest floor arthropods are less known (Matveinen-Huju and Koivula 2008, Elek et al. 2016).
In natural as well as artificial gaps, the drastically changed vegetation structure and coverage may cause the formation of edge zones (Elek et al. 2016). This term refers to boundaries between different adjacent habitats (Murcia 1995, Burgess et al. 2001), where there are significant changes in the vegeta- tion structure, species richness and/or microclimate (Zólyomi 1987). The edge effect may influence the abundance and dis-
tribution of populations and thus the structure of assemblages (Fergusson 2004).
In gaps and in close-to-natural forests, a higher amount of deadwood is expected to be present (Gálhidy 2016). The deadwood brings about possible changes in the microclimate, additional potential micro- and macrohabitats and more com- plex habitat structures, which all can have impact on the ar- thropod assemblages (Castro and Wise 2009, 2010, Ulyshen and Hanula 2009).
This study focused on the effects of gap opening and the presence of deadwood on Araneae and Carabidae assem- blages, and on determining the presence of edge effect in the gaps. Both spiders and ground beetles are suitable subjects for such studies as species of both groups are abundant, gen- eralist predators in forest ecosystems (Wise 1993, Lövei and Sunderland 1996). These taxa are also well-known indicator organisms (Kremen et al. 1993, Szél and Kutasi 2005, Elek et al. 2016). They react sensitively to changes in environmental parameters, and vegetation structure (Wise 1993, Lövei and Sunderland 1996, Maelfait and Hendrickx 1998, Cardoso et al. 2004, Scott et al. 2006, Horváth et al. 2009), as well as anthropogenic disturbances (Klimes 1987) and abundance of
Comparative study of ground beetle and ground-dwelling spider assemblages of artificial gap openings
D. Andrési
1, 2, L. Bali
2, 4, K. Tuba
2and Cs. Szinetár
31KEFAG Ltd; Kecskemét, Hungary
2Institute of Sylviculture and Forest Protection, Faculty of Forestry, University of Sopron; Sopron, Hungary
3Institute of Biology, Faculty of Natural Sciences, Eötvös Loránd University; Szombathely, Hungary
4Corresponding author: bali.laszlo@uni-sopron.hu
Keywords: Araneae, Carabidae, Deadwood, Gap, Pitfall trapping.
Abstract: Artificial gap openings cause significant changes in vegetation structure (in every forest level), thereby greatly in- fluencing arthropod communities. Our study compared the data of two common forest floor arthropod groups, ground beetles (Coleoptera: Carabidae) and ground-dwelling spiders (Araneae) from two artificial gaps situated in a turkey oak forest. Our surveys were carried out in the Gyöngyös-plain, in Hungary. Sampling of the arthropod communities was done with pitfall traps arranged in two 70 m long transects, along the longitudinal axis of the gaps, with 15 traps in each transect, 5 m from each other.
We measured the quantity and quality of the deadwood lying around within a radius of 2.5 m of each trap. We observed that the species and numbers of spider specimens were higher in the inner parts of the transects (in the gaps), while the numbers of ground beetle specimens declined in the same traps. Furthermore, the Shannon and Simpson diversity values of the ground bee- tles were generally lower than those of the spiders. The ordinations showed a distinct influence of the gaps on the communities.
The numbers of specimens of exclusively edge-associated species were also higher in the gaps. The correlation analysis indicat- ed significant positive correlations between the number of ground beetles and spiders and the quantity of deadwood. In addition, there were significant negative correlations between the numbers of species of both groups and the rate of decay of deadwood.
Abbrevations: Gb – Ground beetles; Sp – Spiders, BC – Bray-Curtis, SE – Standard Error, SD – Standard Deviation, H’ – Shannon diversity, D1 – Simpson diversity.
Nomenclature: Platnick (2018) for spiders, Müller-Motzfeld (2004) for ground beetles, Simon (2000) for plants.
deadwood (Castro and Wise 2009, 2010, Ulyshen and Hanula 2009).
Since both spiders and carabids are generalist ground- dwelling arthropod predators, we presume they will react in similar ways to gap opening. A gap opening could most likely cause the formation of an edge zone, which we also consider probable in our case. Finally, more deadwood – by increas- ing the available habitats and the structural diversity – should have a positive impact on both arthropod communities.
In order to test these ideas, we compared the survey transects’ ground-dwelling spider and ground beetle assem- blages by specimen and species numbers and diversity in- dices. We examined the changes in numbers of species and specimens throughout the transects, evaluated the situation of the habitat indicator species and did the ordination analysis of the traps. Lastly, we also conducted a correlation analysis regarding presence of deadwood.
Materials and methods Study sites and sampling
Our study was carried out in West Hungary, near the town of Vép in the Gyöngyös-plain, in the Vép 32/D forest sub- compartment (N 47°13’39”, E 16°47’21”). The mosaic-like landscape structure of the region consists mainly of agricul- tural fi elds, anthropogenic infl uenced grasslands, and for- est patches. The studied subcompartment was homogenous turkey oak (Quercus cerris) aged 69 years. Only the gaps had understory, which was densely populated by turkey oak saplings and Rubus patches. Everywhere else, the forest fl oor was covered with threads of Poa species and thin leaf litter.
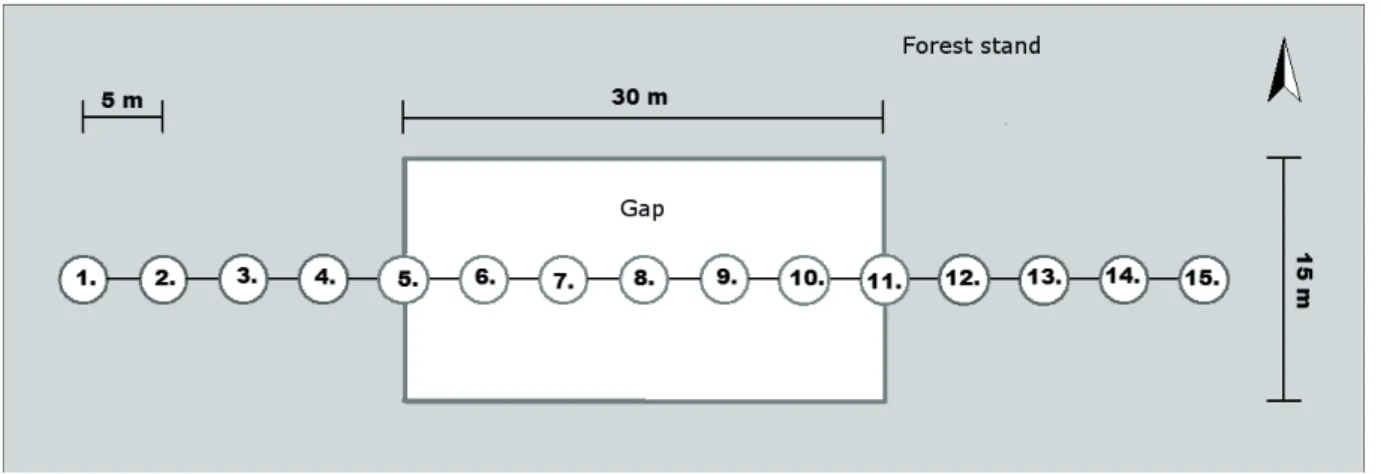
We surveyed two of the artifi cial gaps of the subcompart- ment opened in 2010 (approximately 15 m × 30 m , oriented N-S and E-W), and their surroundings using double cupped Barber-type pitfall traps (Barber 1931, Woodcock 2005) (diameter 90 mm, fi lled with 10% acetic acid solution as a preservative). In each gap, the traps were arranged in 70 m long transects along the longitudinal axis of the gaps, with
15 traps in each transect, 5 m from each other. Traps #5 and
#11 were at the approximate edges of the gaps (Fig. 1). The traps were installed in April 2013. They were active during 2 years (for 414 days). In each year, we collected the samples fortnightly, from April to November. The quantity and qual- ity of the deadwood lying around were measured within 2.5 m of each trap, using the Ódor method: around each trap, we measured the decay rate and diameter of those deadwood elements, which were intersected by at least one of six 2.5 m long transects, oriented 60° from each other (Fig. 2).
To determine the habitat preferences of the species we found and to choose habitat indicator species from the com- munities, we mostly relied on literature data, such as the works of Hänggi et al. (1995), Buchar and Růžička (2002), Netwig et al. (2018) for spiders; plus Nagy et al. (2004) and Merkl and Vig (2009) for beetles. We specifi ed three habitat preference categories: forest stand, open habitat, and edge preferring species. (Please note that we found no edge prefer- ring beetle species and with spiders some overlap is possible between the categories.) Moreover, an ‘N/A’ category for the species with no preference or no literary data.
Data analysis
To observe the changes in the communities along the transects, we compared the numbers of species and speci- mens, as well as the Shannon and Simpson diversity values by summarizing the measurements of the two transects, by adding the data of the traps of the same position, and by add- ing the data of the two years. We also calculated the means and the standard deviation values.
Shannon diversity is known to be sensitive to undersam- pling (May 1975, Beck and Schwanghart 2010), but we con- sider the surveyed communities well explored. On the other hand, Simpson diversity is unbiased in this regard, but is strongly dependent on the most common species of the com- munities (Lande 1996, Beck and Schwanghart 2010). In addi- tion, since both compound indices are suitable to differentiate samples (Wilsey et al. 2005, Heino et al. 2008, Morris et al.
2014), we decided to use them complementarily. Moreover,
Figure 1. The arrangement of pitfall traps at each gap (top view).
both indices are well established and commonly used in com- munity ecology (Beck and Schwanghart 2010), which makes evaluating and comparing our results more straightforward.
We did the ordination analysis using the PAST program (Hammer et al. 2001). We summarized the data of the two transects, by adding the data of the traps in the same posi- tion, and by pooling the data of the two years. We applied non-metric multidimensional scaling (NMDS). Dissimilarity matrices were based on the Bray-Curtis measure (Bray and Curtis 1957, Anderson and Willis 2003). BC ordina- tion works well on zoological data sets consisting of a large number of relatively heterogeneous samples (Beals 1984, Legendre and Legendre 1998, Borcard et al. 2011). Several studies have also shown that BC similarity outperforms most other measures with real community data (Beals 1984, Clarke et al. 2006). This method is widely employed in ecological studies as well (Clarke 1993, Clarke et al. 2006, Legendre and Legendre 1998), thus also making our results more com- parable.
We performed this analysis on both spider and ground beetle communities.
Correlation analysis was conducted in order to gain in- sight into how the assemblages respond to the presence of deadwood on the ground. We used Spearman rank correla- tion in the STATISTICA program, by separately examining data from each year. We included the following data: quan- tity of deadwood, and the quality (decay rate) of deadwood, numbers of spider species and specimens, and the number of ground beetle species and specimens. We considered correla- tions significant at p < 0.015 values (Franklin 1987).
It should also be mentioned, that gap orientation may influence how surveyed communities respond to certain changes (Ries et al. 2004). However, we did not find nota- ble differences between the communities in the two gaps, so we decided to present our results summarized in most of the analyses.
Results
In our two-year survey, we collected 12,858 individual arthropods (11,393 spiders and 1,465 ground beetles), rep- resenting 157 species (115 spiders and 42 ground beetles).
There were 3,932 juvenile spider specimens. In the further analyses these data were disregarded. Pardosa alacris and Calosoma inquisitor were the most abundant species of their taxa. Both groups were most abundant in May and June.
We observed that the species and the numbers of speci- mens of spiders were higher in the inner parts of the transects, regardless of habitat preference. Means and SD values also followed this trend. On the other hand, the number of speci- mens of ground beetles showed a clear decline around the same part of the transects, while the number of species did not seem to follow any trend. In this case, the means were also higher in the inner parts of the transects, while the SD numbers showed an opposite trend. The numbers of species of the spiders, which are exclusively edge associated (e.g.
Aulona albimana), were the highest in the gaps; while the beetle species, which prefer stands (e.g. Calosoma inquisi- tor), were much less abundant in the gaps than in the stand.
In both communities, the abundance of species preferring open habitats showed the least amount of changes through the transects (Table 1).
The Shannon and Simpson diversity values were gener- ally high, close to their maximum that can be observed in nat- ural environments (Shannon 1948, Simpson 1949, McDonald 2003). Diversity of the ground beetles was generally lower than that of the spiders. The indices showed the highest val- ues in the inner parts of the transects, inside the gaps in both taxa (Table 1).
The corresponding stress (ST) values of the ordination analyses were 0.13 (for spiders) and 0.14 (for beetles). Both were inside the acceptance interval (Podani 1997). The su- perimposed minimum spanning trees indicate fairly good 2D solutions. There were two groupings in both cases. For the Figure 2. Lying deadwood survey using the Ódor method (example, top view, not to scale).
spiders, one of the groups consisted of traps #6-11, and the other one of traps #1-5 plus #12-15, and the overall similarity between the two clusters traps was approximately the same magnitude. For the beetles, one of the groups consisted of traps #6-10, and the other one of traps #1-5 plus #11-15, and the overall similarity was much higher between the traps in the stands than between the traps in the gaps. The formation of two distinct groups (in both cases) can be interpreted as community differentiation between the habitats (forest stand, and gaps). Also, higher dissimilarities between the traps in the gaps in case of the beetles can be interpreted as a sign of a higher community diversity inside the gaps (Fig. 3).
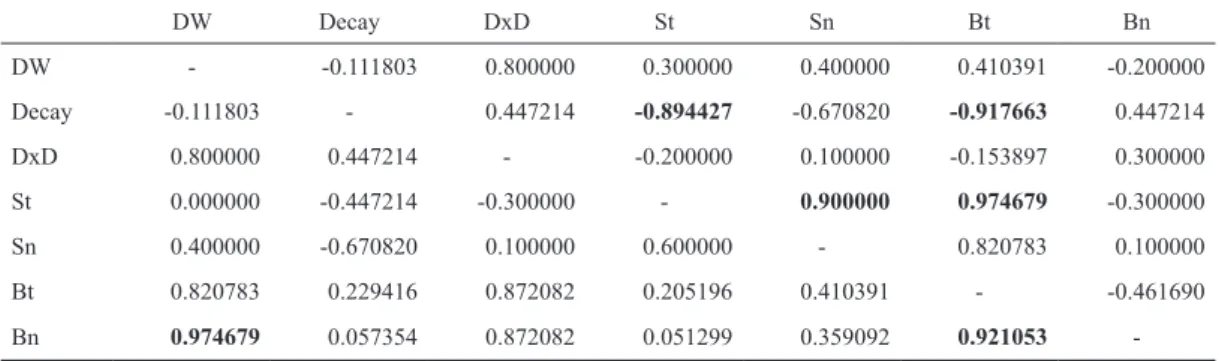
The correlation analysis showed a significant positive relationship between the numbers of ground beetles and the quantity of deadwood, because more deadwood increases the area’s structural diversity, and creates more habitats preferred by ground beetles. There was also another significantly posi- tive relationship between the number of species of spiders and ground beetles.
Furthermore, there were significant negative correla- tions between the number of species in both groups and the rate of decay of deadwood. This can be because a higher decay rate reduces the structural integrity of deadwood,
making it less and less suitable for forming macro- and mi- crohabitats (Table 2).
Discussion
Preliminary data of the first year of this survey have been partially published and is in correspondence with our most recent findings (Bali et al. 2016, 2017). The communities of ground beetles and ground-dwelling spiders in the survey area were thoroughly investigated. We do not expect that similar sampling methods would produce a notable increase in the number of species. Overall, we found that the commu- nities of ground-dwelling spiders in the survey area seemed richer and more diverse than the communities of ground bee- tles, which is in line with the finding of Siira-Pietikäinen and Haimi (2009).
Several previous studies have shown that edge zones be- tween forest stands and open habitats have the highest spe- cies numbers and diversity values of the three (Horváth et al. 2000, Molnár et al. 2001, Magura 2002, Gallé and Fehér 2006, Máthé 2006). In our case however, those values were at their highest around the middle of the gaps, not their edg- es. This can suggest that the gaps we studied were not big enough to form a stand-edge-opening complex.
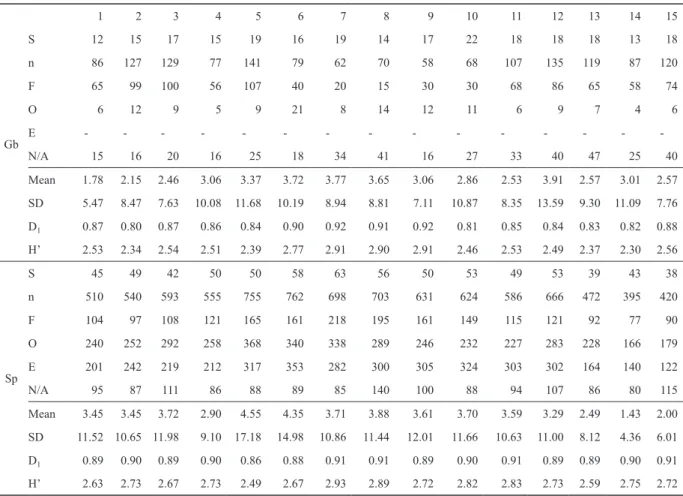
Table 1. Sampling results and diversity indices by traps summarized by years and by transects (S – species numbers, n – specimen num- bers, F – forest preferring, O – open habitat preferring, E – edge preferring, N/A – no preference or preference unknown).
1 2 3 4 5 6 7 8 9 10 11 12 13 14 15
Gb
S 12 15 17 15 19 16 19 14 17 22 18 18 18 13 18
n 86 127 129 77 141 79 62 70 58 68 107 135 119 87 120
F 65 99 100 56 107 40 20 15 30 30 68 86 65 58 74
O 6 12 9 5 9 21 8 14 12 11 6 9 7 4 6
E - - - -
N/A 15 16 20 16 25 18 34 41 16 27 33 40 47 25 40
Mean 1.78 2.15 2.46 3.06 3.37 3.72 3.77 3.65 3.06 2.86 2.53 3.91 2.57 3.01 2.57
SD 5.47 8.47 7.63 10.08 11.68 10.19 8.94 8.81 7.11 10.87 8.35 13.59 9.30 11.09 7.76
D1 0.87 0.80 0.87 0.86 0.84 0.90 0.92 0.91 0.92 0.81 0.85 0.84 0.83 0.82 0.88
H’ 2.53 2.34 2.54 2.51 2.39 2.77 2.91 2.90 2.91 2.46 2.53 2.49 2.37 2.30 2.56
Sp
S 45 49 42 50 50 58 63 56 50 53 49 53 39 43 38
n 510 540 593 555 755 762 698 703 631 624 586 666 472 395 420
F 104 97 108 121 165 161 218 195 161 149 115 121 92 77 90
O 240 252 292 258 368 340 338 289 246 232 227 283 228 166 179
E 201 242 219 212 317 353 282 300 305 324 303 302 164 140 122
N/A 95 87 111 86 88 89 85 140 100 88 94 107 86 80 115
Mean 3.45 3.45 3.72 2.90 4.55 4.35 3.71 3.88 3.61 3.70 3.59 3.29 2.49 1.43 2.00
SD 11.52 10.65 11.98 9.10 17.18 14.98 10.86 11.44 12.01 11.66 10.63 11.00 8.12 4.36 6.01
D1 0.89 0.90 0.89 0.90 0.86 0.88 0.91 0.91 0.89 0.90 0.91 0.89 0.89 0.90 0.91
H’ 2.63 2.73 2.67 2.73 2.49 2.67 2.93 2.89 2.72 2.82 2.83 2.73 2.59 2.75 2.72
Also, in both communities, the abundance of the species preferring open habitats showed the least amount of change through the transect. This is mostly in line with previous fi nd- ings of Matveinen-Huju’s study (2007), which showed that gaps would be at least approximately 0.16 ha (40 m × 40 m) in order for species preferring open habitats to successfully colonize them. Goßner (2006) showed that gaps were domi- nated by forest arthropod species (including spiders), which was only partially true in our case. While forest preferring spider species had a higher abundance in the gaps, the domi- nating group clearly was of the edge preferring spiders.
The lack of edge preferring beetle species and the defi - nite decline of the abundance of the forest preferring species has also been shown by previous studies (Koivula és Niemelä 2003, Klimaszewski et al. 2005, Niemelä et al 2007).
It seems that the examined gap felling method does not affect harmfully the surrounding habitats, which is in line with the fi ndings of Debnár et al. (2016). In addition, in our
case the richness and the diversity of the communities in the gaps showed an increase.
Conclusion
According our data, both taxa showed somewhat higher diversity indices inside the gaps, and the ordination analysis revealed some level of differentiation between their commu- nities in the traps in the stands and in the traps in the gaps.
However, the trends of the numbers of specimens of the two taxa were almost exactly opposite. Therefore, we can- not state that the gap opening had truly similar effects on the examined communities. There can be multiple reasons for this phenomenon. We consider two (possibly interconnected) explanations to be the most likely. Firstly, only approximate- ly 20% of the species of the spider community were stand preferring, while this number is almost 66% in case of the beetles. Secondly, during our sampling, there was a geometer caterpillar (Lepidoptera: Geometridae) outbreak, which was Table 2. Spearman rank correlations. Upper diagonal shows data of 2013; lower diagonal shows data of 2014. Signifi cant correlations (p < 0.015) are bold. (DW: lying deadwood quantity, Decay: average decay rate, DxD: deadwood quantity weighted by decay rate, S:
spider, t: taxa, n: specimens, B: ground beetles).
DW Decay DxD St Sn Bt Bn
DW - -0.111803 0.800000 0.300000 0.400000 0.410391 -0.200000
Decay -0.111803 - 0.447214 -0.894427 -0.670820 -0.917663 0.447214
DxD 0.800000 0.447214 - -0.200000 0.100000 -0.153897 0.300000
St 0.000000 -0.447214 -0.300000 - 0.900000 0.974679 -0.300000
Sn 0.400000 -0.670820 0.100000 0.600000 - 0.820783 0.100000
Bt 0.820783 0.229416 0.872082 0.205196 0.410391 - -0.461690
Bn 0.974679 0.057354 0.872082 0.051299 0.359092 0.921053 -
Figure 3. Non-metric multidimensional scalings (NMDS) based on Bray-Curtis dissimilarity. Dots represent the traps in the transects, lines represent the minimum spanning tree. Data are summarized by years and transects.
concentrated to the forest stand. This increase in prey num- bers most certainly had great effect on the beetle community.
Furthermore, we can also suppose, that the lack of leaf litter inside the gaps, or the fact that the two studied groups have a somewhat overlapping sets of prey (which causes competi- tion), also had a negative impact on the beetle community.
All things considered, it seems that the procedure was more favorable to the ground-dwelling spider assemblages.
We cannot confirm either the formation of an edge zone following the gap openings, at least not in the usual sense.
Based on our findings, it seems that the size of the gaps (15 m
× 30 m) was not big enough for a stand-edge-opening com- plex to form. Instead, according to the habitat preference of the species, the entirety of the gaps appeared to be an edge- like semi-open habitat, which may also be caused by the ob- vious lack of canopy cover, and the existence of dense under- story. According to the ordinations, the boundaries of these two habitats formed around traps #6 and #10.
We also suggest that the communities of the surrounding stand will be able to recolonize the gaps as their reforestation progresses. This may be possible mostly because of the rela- tive small size of the gaps.
Finally, the correlation analysis has shown that an in- crease in the amount of lying deadwood indeed can have a positive effect on the ground dwelling arthropod communi- ties. Furthermore, it also indicated that younger (i.e. less de- cayed) deadwood is more preferable for these assemblages.
To confirm our findings, in the future we plan to compare these data with our analogous survey conducted in a differ- ent forest. We would also like to supplement our findings by collaborating other researchers, who have different data sets (e.g. soil humidity, illumination, leaf litter cover, etc.) from this study area. This way we could form a much more detailed picture regarding the effects of gap openings on ground- dwelling arthropod communities.
Acknowledgements: We are thankful for the assistance of the colleagues of NAIK ERTI. This study was carried out in the programs of ‘TÁMOP-4.2.2.A-11/1/KONV-2012-0004’
& ’VKSZ_12-1-2013-0034 - Agrárklíma.2’.
References
Anderson, M.K. and Willis, T.J. 2003. Canonical analysis of principal coordinates: a useful method of constrained ordination for ecol- ogy. Ecology 82:511–525.
Bali, L., Szinetár, Cs., Andrési, D., Kámpel, J. and Tuba, K. 2016.
Mesterségesen kialakított lékek talajközelben élő pókfaunájának (Araneae) vizsgálata. Növényvédelem 52:287–297.
Bali, L., Andrési, D., Szinetár, Cs. and Tuba, K. 2017. Léknyitás ha- tása talajközelben élő pókközösségre. In: Szabó P. (ed.), Kutatás- fejlesztés-innováció az agrárium szolgálatában. Mezőgazda lap- és könyvkiadó, Budapest. pp. 119–128. [in Hungarian]
Barber, H.S. 1931. Traps for cave-inhabiting insects. J. Elisha Mitchell Scientific Soc. 46:259–266.
Beals, E.W. 1984. Bray-Curtis ordination: an effective strategy for analysis of multivariate ecological data. Adv. Ecol. Res. 14:1–55.
Beck, J. and Schwanghart, W. 2010. Comparing measures of species diversity from incomplete inventories: an update. Meth. Ecol.
Evol. 1:38–44.
Bengtsson, J., Nilsson, S.G., Franc, A. and Menozzi, P. 2000.
Biodiversity, disturbances, ecosystem function and management of European forests. Forest Ecol. Manage. 132:39–50.
Bray, J.R. and Curtis, J.T. 1957. An ordination of upland forest com- munities of southern Wisconsin. Ecol. Monogr. 27:325–349.
Borcard, D., Gillet, F. and Legendre, P. 2011. Numerical Ecology with R. Springer-Verlag New York. pp. 31–53.
Brokaw, N.V.L. and Busing, R.T. 2000. Niche versus chance and tree diversity in forest gaps. Trends Ecol. Evol. 15:183–188.
Buchar, J. and Růžička, V. 2002. Catalogue of Spiders of the Czech Republic. Peres Publishers, Praha.
Burgess, V.J., Kelly, D., Robertson, A.W. and Ladley, J.J. 2001.
Positive effects of forest edges on plant reproduction: literature review and a case study of bee visitation to flowers Peraxilla tetrapetala (Loranthaceae). Plant Ecol. 153:347–359.
Cardoso, P., Silva, I., Oliveirade, N.G. and Serrano, A.R.M. 2004.
Indicator taxa of spider (Araneae) diversity and their efficiency in conservation. Biol. Conserv. 120:517–524.
Castro, A., Wise, D.H., 2009. Influence of fine woody debris on spi- der diversity and community structure in forest leaf litter. Biol.
Conserv. 18:3705–3731.
Castro, A., Wise, D.H., 2010. Influence of fallen coarse woody debris on the diversity and community structure of forest-floor spiders (Arachnida: Araneae). Forest Ecol. Manage. 260:2088–2101.
Clarke, K.R. 1993. Non-parametric multivariate analyses of changes in community structure. Austr. J. Ecol. 18:117–143.
Clarke, K.R. Sommerfield, P.J. and Chapman, M.G. 2006. On re- semblance measures for ecological studies, including taxonomic dissimilarities and a zero-adjusted Bray–Curtis coefficient for denuded assemblages. J. Exp. Mar. Biol. Ecol. 330:55–80.
Debnár, Zs, Magura T., Horváth, R., Nagy, D.D., Mizser, Sz., Demkó, A., Tajthi, B. and Tóthmérész, B. 2016. Group selection har- vesting supports diversity of forest specialist epigaeic arthro- pods (Coleoptera: Carabidae; Arachnida: Araneae; Isopoda:
Oniscidae). Periodicum Biologorum 118:311–314.
Elek, Z., Bérces, S., Szalkovszki, O. and Ódor, P. 2016. Hogyan segíthet az erdészeti gyakorlat megőrizni a talajfelszíni raga- dozó ízeltlábúak diverzitását? In: Az erdőgazdálkodás hatása az erdők biológiai sokféleségére. Tanulmánygyűjtemény. Duna–
Ipoly Nemzeti Park Igazgatóság, Budapest. pp. 203–215. [in Hungarian]
Fergusson, S.H. 2004. Influence of edge on predator-prey distribution and abundance. Acta Oecol. 25:111–117.
Franklin, L.A. 1987. The complete exact null distribution of Spearman’s rho for n = 12 to 16. Proceedings of the 19th Symposium on the Interface between Computer Science and Statistics. pp. 337–342.
Gallé, R and Fehér, B. 2006. Edge effect on spider assemblages.
Tiscia 35:37–40.
Gálhidy, L. 2016. A lékek szerepe az erdőgazdálkodásban és az erdők természetvédelmi kezelésében. In: Korda, M. (ed.), Az erdőgazdálkodás hatása az erdők biológiai sokféleségére.
Tanulmánygyűjtemény. Duna–Ipoly Nemzeti Park Igazgatóság, Budapest. pp. 421–458. [in Hungarian]
Goßner, M., Engel, K. and Ammer, U. 2006. Effects of selection felling and gap felling on forest arthropod communities: a case study in a spruce-beech stand of southern Bavaria. Eur. J. Forest Res. 125:345–360.
Hänggi, A., Stöckli, E. and Nentwig, W. 1995. Habitats of central european spiders. Miscellanea Faunistica Helvetica 4; 459 pp.
Hammer, Ø., Harper, D.A.T. and Ryan, P.D. 2001. PAST:
Paleontological statistics software package for education and data analysis. Palaeontologia Electronica. 4(1): 9. http://palaeo- electronica.org/2001_1/past/issue1_01.htm
Heino, J., Mykrä, H. and Kotanen, J. 2008. Weak relationships be- tween landscape characteristics and multiple facets of stream macroinvertebrate biodiversity in a boreal drainage basin.
Landsc. Ecol. 23:417–426.
Horváth, R., Magura, T., Péter, G. and Bayar, K. 2000. Edge effect on weevil and spider communities at the Bükk National Park in Hungary. Acta Zool. Acad. Sci. Hung. 46(4):275–290.
Horváth, R., Magura, T., Szinetár, Cs. and Tóthmérész, B. 2009.
Spiders are not less diverse in small and isolated grasslands, but less diverse in overgrazed grasslands; a field study (East Hungary, Nyírség). Agric. Ecosyst. Environ. 130:16–22.
Klimaszewski, J., Langor, D.W., Work, T.T., Pelletier, G., Hammond, H.E.J. and Geramin, C. 2005. The effects of patch harvesting and site preparation on ground beetles (Coleoptera, Carabidae) in yellow birch dominated forests of southeastern Quebec. Can.
J. Forest Res. 35:2616–2628.
Klimes, L. 1987. Comparison of bioindicative value of vascular plants and spiders in the classification of ecosystems. Ekologia (CSSR) 6:165–178.
Koivula, M. and Niemelä, J. 2003. Gap felling as a forest harvest- ing method in boreal forests – responses of carabid beetles (Coleoptera, Carabidae). Ecography 26:179–187.
Kremen, C., Colwell, R.K., Erwin, T.L., Murphy, D.D., Noss, R.F.
and Sanjayan, M.A. 1993. Terrestrial arthropod assemblages:
their use in conservation planning. Conserv. Biol. 7:796–808.
Lande, R. 1996. Statistics and partitioning of species diversity, and similarity among multiple communities. Oikos 76:5–13.
Legendre, P. and Legendre, L. 1998. Numerical Ecology. Second English Edition. Elsevier Science, Amsterdam.
Lövei, G.L. and Sunderland, K.D. 1996. Ecology and behavior of ground beetles (Coleoptera: Carabidae). Annu. Rev. Entomol.
41:231–256.
Maelfait, J.-P. and Hendrickx, F. 1998. Spiders as bioindicators of anthropogenic stress in natural and semi-natural habitats in Flanders (Belgium): some recent developments. In: Selden, P.
A. (ed.), Proceedings 17th European Colloquium Arachnology.
pp. 293–300.
Magura, T. 2002. Carabids and forest edge: spatial pattern and edge effect. Forest Ecol. Manage. 157:23–37.
Máthé, I. 2006. Forest edge and carabid diversity in a Carpathian beech forest. Community Ecol. 7:91–97.
Matveinen–Huju, K. 2007. Short-term effects of variable retention on epigaeic spiders and carabid beetles in Finland. Academic dis- sertation. University of Helsinki. pp. 39.
Matveinen-Huju, K. and Koivula, M. 2008. Effects of alternative harvesting methods on boreal forest spider assemblages. Can. J.
Forest Res. 38:782.794.
May, R.M. 1975. Patterns of species abundance and distribution.
In: Cody, ML & Diamond JM (eds.) Ecology and Evolution of Communities. Harvard University Press, Cambridge Massachusetts, USA. pp. 81–120.
McDonald, G. 2003. Biogeography: Space, Time and Life. John Wiley & Sons, New York.
Merkl, O. and Vig, K. 2009. Bogarak a Pannon Régióban. Vas Megyei Múzeumok Igazgatósága. B. K. L. Kiadó és a Magyar
Természettudományi Múzeum. Szombathely. 87–113. [in Hungarian]
Molnár, T., Magura, T., Tóthmérész, B. and Elek, Z. 2001. Ground beetles (Carabidae) and edge effect in oak-hornbeam forest and grassland transects. Eur. J. Soil Biol. 37:297–300.
Morris, E.K., Caruso, T., Buscot, F., Fischer, M., Hancock, C., Maier, T.S., Meiners, T., Müller, C., Obermaier, E., Prati, D., Socher, S.A., Sonnemann, I., Wäschke, N., Wubet, T., Wurst, S. and Rillig, M.C. 2014. Choosing and using diversity indices: in- sights for ecological applications from the German Biodiversity Exploratories. Ecol. Evol. 4:3514–3524
Murcia, C. 1995. Edge effect in fragmented forests: implications for conservation. Trends Ecol. Evol. 10:58–62.
Müller-Motzfeld, G. (ed.) 2004. Band 2. Adephaga 1: Carabidae (Laufkäfer). 2. Auflage. In: Freude, H., Harde, K.W., Lohse, G.A. and Klausnitzer, B. (eds.), Die Käfer Mitteleuropas.
Elsevier GMBH, Spektrum Akademischer Verlag, Heidelberg- Berlin. 521 pp.
Nagy, F., Szél, Gy. and Vig, K. 2004. Vas megye futóbogár faunája (Coleoptera: Carabidae). Praenorica, Folia historico-naturalia 7:235 pp.
Nentwig ,W., Blick. T., Gloor, D., Hänggi, A., and Kropf, C. 2018.
Spiders of Europe. www.araneae.unibe.ch. 2018.04.06.
Niemelä, J., Koivula, M. and Kotze, J.D. 2007. The effects of forestry on carabid beetles (Coleoptera: Carabidae) in boreal forests. J.
Insect Conserv. 11:5–18.
Pickett, S.T.A. and White, P.S. 1985. Patch dynamics: A synthesis.
In: Pickett, S.T.A. and White, P.S. (eds.), The Ecology of Natural Disturbance and Patch Dynamics. Academic Press, Orlando, Florida. pp. 17–33.
Platnick, N.I. 2018. The World Spider Catalog, Version 19.0. URL http://wsc.nmbe.ch
Podani, J. 1997. Bevezetés a többváltozós biológiai adatfeltárás rej- telmeibe. Scientia kiadó, Budapest. 252–257. [in Hungarian]
Ries, L., Feltcher, R.J. Jr., Battin, J. and Sisk, T.D. 2004. Ecological responses to habitat edges: Mechanisms, models, and variability explained. Ann. Rev. Ecol. Evol. Syst. 35:491–522.
Runkle, J.R. 1989. Synchrony of regeneration, gaps, and latitudinal differences in tree species diversity. Ecology 70:546–547.
Schnitzer, S.A. and Carson, W.P. 2000. Have we forgotten the forest because of the trees? Trends Ecol. Evol. 15:376.
Scott, A.G., Oxford, G.S. and Selden, P.A. 2006. Epigeic spiders as ecological indicators of conservation value forpeat bogs. Biol.
Conserv. 12:420–428.
Shannon, C.E. 1948. A mathematical theory of communication. Bell System Tech. J. 27:379–423 and 623–656.
Siira-Pietikäinen, A. and Haimi, J. 2009. Changes in soil fauna 10 years after forest harvestings: Comparison between clear fell- ing and green-tree retention methods. Forest Ecol. Manage.
258:332–338.
Simon, T. 2000. A magyarországi edényes flóra határozója (Guide to the Hungarian Vascular Flora). Nemzeti Tankönyvkiadó, Budapest. [in Hungarian]
Simpson, E.H. 1949. Measurement of diversity. Nature 163:68.
Szél, Gy. and Kutasi, Cs. 2005. Influence of land use intensity on the ground beetle assemblages (Coleoptera: Carabidae) in Central Hungary. In: Lövei, G. and Toft, S. (eds.), European Carabidology 2003. Proceedings of the 11th European Carabidologist Meeting. DIAS Reports Plant Production 114.
pp. 305–311.
Ulyshen, M.D. and Hanula, J.L., 2009. Responses of arthropods to large scale manipulations of dead wood in loblolly pine stands in the Southeastern United States. Environ. Entomol. 38:1005–
1012.
Wilsey, B.J., Chalcraft, D.R., Bowles, C.M. and Willig, M.R. 2005.
Relationships among indices suggest that richness is an incom- plete surrogate for grassland biodiversity. Ecology 86:1178–
1184.
Wise, D.H. 1993. Spiders in Ecological Webs. Cambridge Studies in Ecology. Cambridge University Press, Cambridge.
Woodcock, B.A. 2005. Pitfall trapping in ecological studies.
In: Leather, S. (ed.), Insect Sampling in Forest Ecosystems.
Blackwell, Oxford. pp. 37–57.
Zólyomi, B. 1987. Coenotone, ecoton and their role of preserving relic species. Acta Bot. Hung. 33:3–18.
Received December 1, 2017 Revised April 20, May 7, 2018 Accepted May 30, 2018