and Permissioned Blockchains
Laszlo Janoky
1Janos Levendovszky
2Peter Ekler
3Department of Automation and Applied Informatics1,3 Department of Networked Systems and Services2 Budapest University of Technology and Economics {laszlo.janoky1,peter.ekler3}@aut.bme.hu, levendov@hit.bme.hu2
Abstract. Blockchain technology is regarded to have wide future use in financing, commerce, administration and bookkeeping after the the rise of public interest in crypto currencies. However, these applications give rise to further challenges, which needs novel approaches for the design of blockchains. One main field of research is focusing on private and permissioned Blockchains (PBCs) as they allow a much wider range of applications. In this paper, we introduce novel methods for capacity planning and performance predictions for this field, and outline some further research directions.
Keywords: Private Blockchain, Permissioned Blockchain, Capacity planning, Perfor- mance prediction
1 Introduction
Blockchain technology promises immutable and undeniable data storage at scale.
These promises first led to the proliferation of crypto-currencies and later to the rise of interest in alternate uses of the technology.
A key factor in achieving these desired characteristics is the presence of a self- organizing nature of clients. In a public Blockchain – such as the ones serving crypto currencies like Bitcoin [1] – these clients work toward a common goal, motivated by a direct economic interest. Each client can read and write to the chain and their state changes are usually validated by each participant until a consensus is reached. This process is driven by a consensus protocol, which can vary among implementations, as there are several competing solutions available at the time of writing this paper [2].
In a subclass of Blockchains named as Private or Permissioned Blockchains (PBCs or sometimes also refereed to as distributed ledgers [3]) the operations on the chain are limited to a certain subset of clients. This allows for a much wider range of applications, while bringing in new problems to solve.
In an application like this, the number of clients is typically lower by several orders of magnitude than in case of a public chains. This is mainly due to the different use-cases and the restrictions imposed on the participants. Simply put; there is no motivation for outside parties to use a private chain which they
cannot write to, and the organization(s) which can write the chain usually lack the necessary computational resources to do it effectively.
As a consequence, the usual methods for optimizing performance – such as block difficulty target for the Proof-of-Work algorithms [4] – which relies on the statistical behaviour of a large number of nodes, may prove to be inefficient in this case. With the approach described in this paper, a more fine-grained control can be achieved for smaller private blockchains, paving the way for their faster adaptation.
The paper is structured as follows:
• In Section 2 the problem statement is defined and formalized, the goal of the paper is outlined.
• In Section 3 the possible approaches are discussed and formally introduced.
• In Section 4, we deal with the validation of these approaches by applying them to a concrete case and drawing conclusions from the measured data.
• In Section 5, we wrap up the discussion by providing a short summary of the work done and outlining some future research directions.
2 Problem Statement
As was mentioned before, the goal is to provide accurate performance predictions for private Blockchains. In order to do this, first we must formalize the workings of the chain and the environment it operates in.
A Blockchain is made up of linked blocks, each containing a certain amount of data (the amount is specified by the implementation). In the most widespread scheme, a new block is appended to the chain, when a cryptographic riddle, the so-called Proof-of-Work [4] is solved by a node. On the average, solving this riddle takes the same amount of computational power for each new block, which is denoted byhfor hardness (proportional to the required capacity). In the most widely used Proof-of-Work algorithm, HashCash [5] and its derivatives this value is proportional to the number of hash functions it takes to find an acceptable block.
The solving capacity, denoted as u (capacity / sec) is the total available computational power in the chain to solve the proof-of-work tasks. Asudepends on the number of nodes connected to the system at any given time, it can be considered as a function of time, denoted asu(k), where kdenotes the current time instant.
It can be seen, that in order to determine the capacity of the system defined as the block creation rate denotedrb, it is required to know both the hardness hand the currently available computational power. Since hardness is based on a predetermined value or algorithm, the task can be reduced to the prediction of available computational power.
In the formal model, each node j belongs to a class l, which denotes its typical contribution characteristics (i.e. enterprise grade server or a mobile
device). The process describing the offered capacity by node j in class l has memory and its time dependence on time is denoted byXj(l)(k).
The aim of this paper is to estimate the block creation rate rb in any given time for a given Blockchain based on its clients behaviour. This allows for both better capacity planning and admission control in these systems, both of which helps with the adaptation of the technology in larger scale.
By having accurate predictions of a chain’s long and short-term performance, based on easily measurable data, further optimizations can be made. One such example would be the allocation of writing resources among participants, based on their contribution and future trends in available total capacity.
3 Client Performance Prediction
We have examined several approaches to the problem stated before. Previously we experimented with a purely statistical approach, described in our paper on the application of statistical modeling for private blockchains [6], but now we intend to provide a solution based on client performance prediction.
3.1 Using Linear Predictors
Due to the time dependence and memory of the process defining the offered computational capacity by nodej, one can use a linear predictor to predict the value ofXj(l)(k), based on its past values
Xj(l)(k−1), Xj(l)(k−2), ..., Xj(l)(k−V)
in the form of
Xej(l)(k) =
V
X
u=1
w(lj)Xj(l)(k−u)
With the predictor implemented, the offered computational capacity by the nodes can be modelled as a time series in the following way:
Xj(l)(k) =
V
X
u=1
w(lj)u Xj(l)(k−u) +ε(l,j)(k)
where
w(l,j)opt : min
w(l,j) E Xj(l)(k)−
V
X
u=1
w(lj)Xj(l)(k−u)
!2
The optimal weight vector can be found by running the Robbins-Monroe type of stochastic approximations [7]. As a result,
E ε(l,j)2
E Xj(l)2
due to the fact, that the predictor minimized the mean square error. With the capacity predicted on each node, the total system capacity can be easily found by summarizing as follows:
Y(k) =
L
X
i=1
n(1)j +...+n(M)j
X
j=1
Xj(i)(k)
3.2 Finding the optimal weights
Finding the optimal weights can be done in several ways. As was mentioned above, using the Robbins-Monroe algorithm [7] proved to be the most advanta- geous based on the preliminary measurements. Thus the basic working of the proposed algorithm is the following:
1. An initial weightwu(l,j)(0)for nodej of classlis chosen. The initial values could either be based on historical measurements (describing the typical characteristics of the class) or chosen as a vector taking all previous values with equal weights.
2. In each time step k, when new data is available, the weights are updated using the following formula:
w(l,j)u (k+ 1) =w(l,j)u (k)−∆ (
Xj(l,j)(k)−
V
X
v=1
w(l,j)Xj(l)(k−v) )
3. The predicted value is calculated using the linear predictor.
In some real-world scenarios, individual node level predictions and perfor- mance measurements may prove to be ineffective or downright unfeasible. In that case measurements and predictions can be done on client class level, at the sacrifice of some accuracy.
This working model requires only a slight modification of the algorithm.
Omitting class l and replacing each client j with their respective group, the formula remains the same.
4 Evaluation and performance analysis
The validation of the approach is done by simulating an environment in which a system (described earlier) would operate in. As the main focus of our current work is providing client performance predictions, factors like network charac- teristics, failures and such can be disregarded in this case.
Nevertheless, this simulated approach is a first step in the validation of the solution. With the affirmative results, the work can continue to a real-world implementation, on which actual experience and feedback can be learned.
4.1 Measurement setup
For the validation of the approach, we created an environment simulating a real- world implementation of a private Blockchain network and its clients. In the measurement setup, we run a synthetic benchmark on several different clients.
The benchmark measured how many SHA-256 Hash [8] operations can the client execute in a second, the results were saved as a time series. The choice of algorithm is irrelevant from the perspective of the measurement, as long as the execution time of each step remains the same.
After measuring several sessions, with several simulated clients, the results were consolidated and run through a simulation framework. The simulation replayed the previously collected time-series as if it were happening in real time and fed the data to the predictor. Based on this data the algorithm outputted a prediction, which could be immediately compared to the actual data from the data sets. To evaluate the measurement, we used two different metrics.
• For the overall evaluation of the algorithm and as a basis for comparison, we used the Root Mean Square Error (RMSE) of the predicted and the actual values.
• Prediction performance can be evaluated with the analysis of the distri- bution of errors.
– A lower expected value indicates smaller average errors.
– The lower the variance of the error distribution, the better the pre- diction is.
4.2 Numerical results
For the results presented in this section, data sets about the performance of 20 clients were collected of 2 different classes. The unit of measurement isSHA256 Hash operation/seconds, and the main parameters of the measured data can be seen in Table 1.
Table 1: Basic parameters of the measured data.
Data points Min Max Average Standard Deviation
2000 40016 23639 37751 1737
The results are compared to a baseline, which is a value predicted based on our previous, purely statistical algorithm described in the previously men- tioned paper [6]. The baseline prediction was using a simple statistical method, based on historically measured characteristics of the client population’s perfor- mance contribution distribution, without any dynamic adaptation to the actual incoming data.
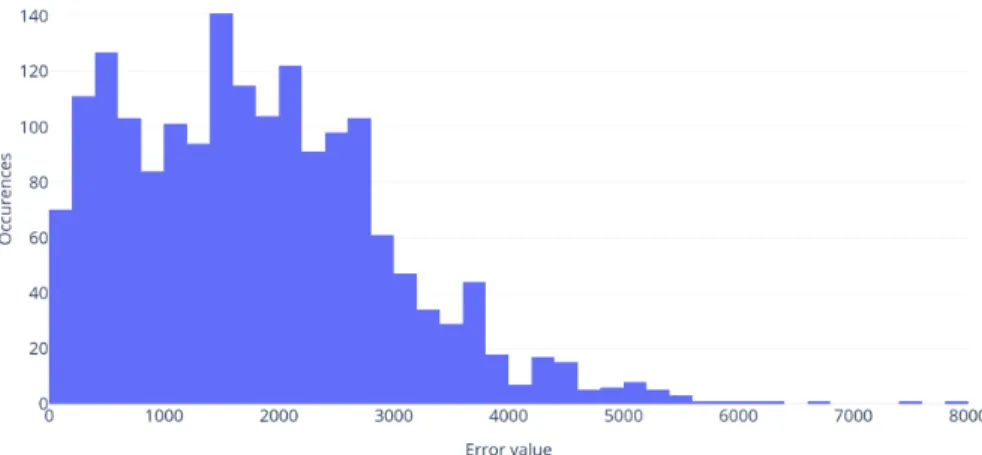
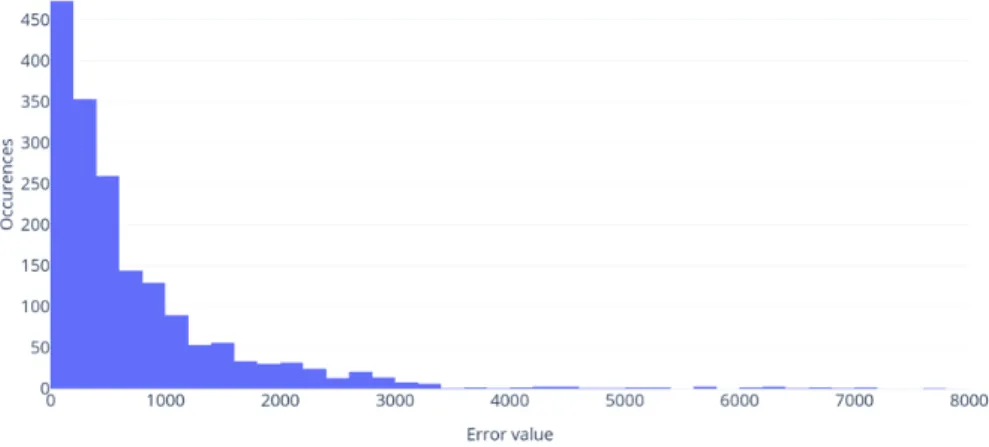
As mentioned in Section 3.2, individual client level predictions are not al- ways feasible, in that case prediction can also work on client group level, albeit with worse accuracy. In our measurements, we used both approaches. Table 2 describes the results in case of individual client level predictions, while Figure 1 and Figure 2 shows the error distributions of the different methods respectively.
Table 2: Results of client level prediction.
Metric Baseline Proposed method
Root Mean Square Error 1850 792
Standard Deviation of the Error 1300 1136
Figure 1: Baseline error distribution (client level)
Figure 2: Proposed method error distribution (client level)
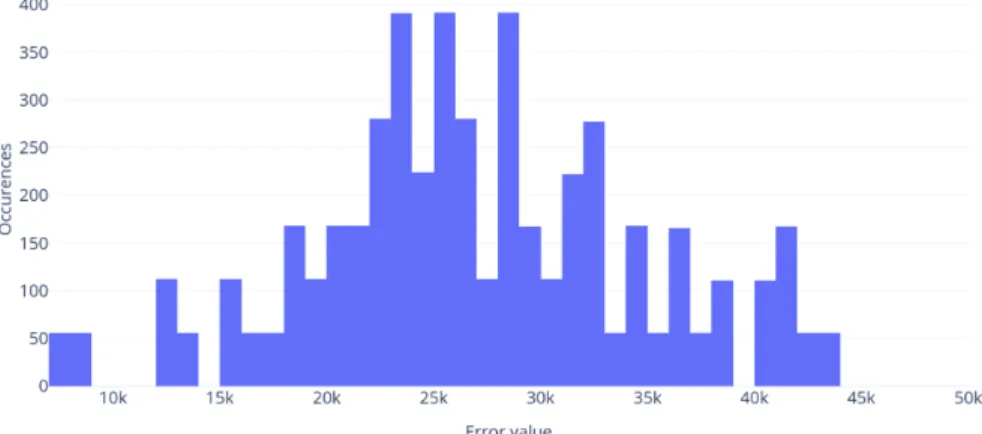
In case of client level prediction, it can be seen that the proposed method did offer some improvements, but the associated costs with increased accuracy could narrow the real-world applications of that approach. On the other hand, looking at group level predictions described in Table 3, Figures 3 and 4, we can see how group level prediction compares.
Table 3: Results of group level prediction.
Metric Baseline Proposed method
Root Mean Square Error 27032 4424
Standard Deviation of the Error 7755 3484
Figure 3: Baseline error distribution (group level)
Figure 4: Proposed method error distribution (group level)
In the case of group level predictions, the performance overhead is signifi- cantly lower, while the advantage over the baseline of the proposed method is further increased.
4.3 Evaluating the Results
Based on the observed data, our solution of using a linear predictor based on the Robbins-Monroe algorithm proves to be advantageous in both client level and group level prediction cases.
As the real-world usage of client level prediction is limited, the focus should be on group level predictions. In the former case the improvement is even more
considerable, while having significantly lower performance costs as compared to the individual client level approach.
With these tools available, one can make performance predictions when de- signing a PBC, based on the measured client behaviour. Also, with the data available during operation, the monitoring of available capacity is possible, fur- ther ensuring the reliable operation of the PBC.
5 Conclusion and Future Work
In the first part of the paper, the open problems of private and permissioned blockchains (PBCs) are elaborated. We set out to find a solution to a class of these problems related to capacity planning and performance predictions.
We continued by formalizing the problem and introducing the basic concept of our solution. In the second part, we investigated this solution in a simulated environment based on real, measured data and drew some conclusions regarding the observed outcome.
We proved that our proposed solution is more accurate in both measured cases and could lead to better capacity planning, admission control and moni- toring tools for PBCs. With that result we achieved the goals we set up for this current work.
A possible next step in our research is to refine the method even further by introducing more advanced predictors, such as neural networks. Another direction worth pursuing is the implementation of this approach in a real-world application and the gathering of first hand experience regarding its operation.
Acknowledgments
This work was performed in the frame of FIEK_16-1-2016-0007 project, imple- mented with the support provided from the National Research, Development and Innovation Fund of Hungary, financed under the FIEK_16 funding scheme.
It was also supported by the BME-Artificial Intelligence FIKP grant of EMMI (BME FIKP-MI/SC) and by the Janos Bolyai Research Fellowship of the Hun- garian Academy of Sciences.
References
[1] S. Nakamoto, “Bitcoin: A peer-to-peer electronic cash system,”
[2] C. Cachin and M. Vukolic, “Blockchain consensus protocols in the wild,”
[3] “Distributed ledger technology: Blackett review.”
[4] M. Jakobsson and A. Juels, “Proofs of work and bread pudding protocols,”
in Secure Information Networks, pp. 258–272, Springer.
[5] A. Back, “Hashcash-a denial of service counter-measure,”
[6] L. V. JĂĄnoky, J. Levendovszky, and P. Ekler, “Application of statisti- cal modeling and participatory computing for private blockchains,” vol. 18, pp. 149–156.
[7] H. Robbins and S. Monro, “A stochastic approximation method,” vol. 22, no. 3, pp. 400–407.
[8] N. I. o. S. a. Technology, “Secure hash standard (SHS).”