Video Mining in Basketball Shot and Game Analysis
Laszlo Ratgeber*, Zdravko Ivankovic**, Zoran Gojkovic***, Zoran Milosevic****, Branko Markoski *****
(*), Anja Kostic – Zobenica ******
*University of Pécs, - Faculty of Health Sciences, Ret u. 4, 7623 Pécs, Hungary
** Preschool Teacher Training and Business Informatics College of Applied Studies "Sirmium", Zmaj Jovina 29, 22000 Sremska Mitrovica, Serbia
*** University of Novi Sad, Faculty of Medicine, Clinical center of Vojvodina, Clinic for orthopedic surgery and traumatology Novi Sad, Hajduk Veljkova 3, 21137 Novi Sad, Serbia
**** University of Novi Sad, Faculty of Sport and Physical Education, Lovcenksa 16, Novi Sad, Serbia
*****University of Novi Sad, Technical faculty "Mihajlo Pupin", Djure Djakovica BB, 23000 Zrenjanin, Serbia, markoni@uns.ac.rs
****** University of Novi Sad, Faculty of Techical siences, Trg Dositeja Obradovica 6, Novi Sad, Serbia
(*) corresponding author
Abstract: The aim of this study is to analyze the footage of basketball games presented to viewers on television. It includes a wide range of activities from identifying players, determining their position, recognizing the ball, hoops, as well as analyzing the shots and determining shot efficacy. The player detection is based on mixture of non-oriented pictorial structures. The detection of body parts is performed by the Support Vector Machines (SVM) algorithm. This paper contains algorithms for detecting player positions of the court, ball position detection and determination of shot. It is achieved by detecting court position and applying spatial transformation. It also includes detection of shot, detection weather shot was successful and position from which shot was taken. All algorithms are tested in large number of frames from different basketball games.
Keywords: video mining; basketball; shot recognition
1 Introduction
The digital analysis of multimedia content is a steady growing technology, constantly progressing in recent years. The aim of this study is to analyze the footage of basketball games viewed through television stations. It includes a wide range of activities from identifying players, determining their position, recognizing the ball and hoops, as well as analyzing the shot and determining its efficacy.
The analysis process starts with the footage of a basketball game. Frames are extracted from the footage, where, according to the standard, there are thirty frames per second. During the analysis, it was concluded that it was not necessary to process every single frame. In this paper, every third frame, or ten frames per second, is used. In this way, the time of execution is significantly reduced without losing the accuracy, since no event does happens so fast that it was not recorded within the reduced set of frames. Such set represents the starting point for the application of algorithms that will allow analysis of the match and the collection of basic basketball parameters.
The identification of the hoops and the ball is done on the basis of the dominant color. The image is translated into HSV color model. Then, areas that have color in a given range are determined, based on the mean value for the color of the ball, or the hoops, from several frames. The areas created in this way are further analyzed in relation to the size (number of pixels) and the position, in order to introduce restrictions that will allow them to be more accurately identified.
An analysis of the position of the hoop and ball allows a further reduction of the set of images that will be further processed. The goal is to extract the shots to the basket, precisely from the moment of sending the ball to the moment when the ball passes through the hoop or until it bounces from it after an unsuccessful shot.
Determining the position of the shot means to recognize the position of the player shooting the ball to the basket. In this research, identifying players and determining their position is done only at this single moment. In such a way, this process, which is the most time-consuming, is executed in a relatively small number of frames.
All the players on one team wear the same shirts, which represents a mitigating factor, from a detection point of view. However, there is a question which level of detection is needed. Basketball players can be treated as rectangular areas in the image where the head, torso, and limbs enter the observed rectangle.
Understanding their behavior is reduced to the pure tracking of the rectangle as it moves through the image. This kind of approach in basketball can be interesting, because it enables us to monitor the actions of the team plays, in offence, as well as, the individual moves of the players depending on whether they play an offence or defense, and depending on the type of offence/defense they are playing. The disadvantage of this kind of display is the fact that a large number of data is
ignored. Players play defense in different ways (with lowered or raised arms), have different techniques of shooting, dribbling a ball, approaching the basket, etc.
This work is focused on a kinematic detection in which the positions of the limbs are modeled at all times. A practically applicable algorithm should fulfill a certain set of requirements. It should simultaneously recognize several people, be resistant to partial blocking of the view and be efficient in computing. It is also necessary, not to be based on any backdrop-reducing techniques, since it is often necessary to watch a basketball player standing still, while the camera is moving.
In this paper, the aim is to detect players in basketball games, where broadcasting is mostly done in HD format. The algorithm of the mixture of non-oriented picture structures is applied over the pyramid of characteristics obtained by scaling and applying the HOG algorithm over the base image. By analyzing the games, we have come to the conclusion that only a part of the set of the scales used in the work by [1-2] is sufficient. This led to a time savings of almost 30%, without reducing the accuracy of the detection.
After identifying players, they need to be attributed to their associated teams. This is done by using the k-means clustering technique whose input is the shirt color saturation histograms, where each cluster is representing one team. In our case, a trained algorithm (trained for the color of the shirts of referees) can be used in all matches within the league, which is a significant reduction in the time required to prepare the algorithm for a new match.
In addition to detecting the players, this work also includes the collection of basic statistical parameters during the game itself. These parameters include shots to the basket, with differentiation of shots from different positions. The court itself is divided into eleven positions, which is the most common division in basketball, with wide application in a large number of competitions. In order to determine the positions from which the shot is made, the recognition of the court boundaries is expanded by determining the restricted zone (colored area under the basket).
Analyzing the position of the ball in the adjacent frames is performed, providing information about the shot attempt and whether the shot was successful or not.
Determining the position from which the shot was sent is done by means of a spatial transformation determined on the basis of detected court boundaries and actual court dimensions. The applied solution is quite robust and efficient, as shown by the experimental results obtained by applying the algorithm over the actual footage of basketball games.
2 Review of Relevant Research
Extracting information from video content is a very important current field of scientific research, especially in sporting events. The aim is to automatically harvest information from the recordings of sports matches concerning the actions
played, the successful and unsuccessful shots, the positions from which they were shot, the performance of individual players, etc. These topics are dealt with in a large number of scientific papers [3-7].
Through the development of technology, sports events have become available in digital form. By using a large number of tools that have been previously developed for text search, video and multimedia content search is becoming more and more common in sports. Automated game review methods are used to parse video content and translate it into a searchable form [8-9].
According to [8] the application of data mining in sports will face a number of challenges and obstacles over the next few years. The biggest obstacle will be overcoming the long-standing opposition, by certain sports organizations members, who are advocating the traditional way of acquiring knowledge. The same authors state that the application of data mining in sport is at a turning point and that a large number of possibilities are just waiting to be used. Some of these options will quickly lead to the desired results; while others it will take years or even decades. They also point out that the basic task is not to find the right way to collect data, but to determine which data should be collected and how to use them in the best way possible.
Piatetsky-Shapiro [10] points out that although statistical techniques are at the heart of data mining, they are used to distinguish between templates and other objects of interest such as the movements and tendencies of opponent players, in contrast to the noisy and useless data, enabling researchers and sports organizations to test hypotheses and make predictions based on the results obtained. Statistics by itself, does not explain relations; this is the purpose of data mining. Within a statistical research project, data mining evolved as a method for finding the reasons behind the relations. Using statistics, it is possible to find and measure of the strength of relations between variables. However, this statistical measure is not able to explain why the relation itself exists or what impact it may have in the future. Data mining provides tools for testing data and gathering further knowledge about cause and consequence relations. This is possible through interactive, iterative and /or research data analysis.
While the use of statistics in the decision-making process is definitely an improvement over the use of the instincts of a coach, manager or scout, statistics alone can easily go in the wrong direction without knowing the domain of the problem. The first part of the problem is determining the performance metric. A large number of existing sports metrics can be very easily used in an unsuitable way. A typical example of inaccuracy in data collection in basketball was given by [11] and cites an example of a rebound that represents how many times the player on defense acquired the ball after an unsuccessful opponent's shot. In order to record a rebound, teammates must block the opponent's players and keep them away from the basket. When blocking opponents, those basketball players are usually not able to catch the ball. However, their defense game makes them
equally important, in order to capture the ball. Regarding the way in which rebounds are recorded, it is clear that only a player who takes the ball is
"rewarded" by rebound. The second part of the problem is finding interesting templates within the data. These templates can include the movements and tendencies of the opponent's team/player, detecting the start of the injury by monitoring the quality of the training, or predicting outcomes based on previous matches.
Data mining includes procedures for detecting hidden templates and creating new information from data storage. The storage may include well-structured and defined databases, such as statistical reports, or unstructured data in the form of video footage of whole games or some typical segments. Data mining activities, tools, technologies and human control are the essence of an area called
"knowledge management" [12]. Knowledge management can give an organization an advantage over competition [13], and in particular a method for maintaining the continuity of knowledge in the organization. However, before raw data comes to the state of useful knowledge, it is necessary to examine all the levels among the data and knowledge as required by the DIKW (Data - Information – Knowledge - Wisdom) hierarchy [14]. DIKW hierarchy is a widely accepted concept on knowledge management stages. Every next level: data, information, knowledge and wisdom, builds on previous levels and provides increased awareness of the environment in which one can find meaning [15-16]. The DIKW principle contains a phase that serves to differentiate data from knowledge and to set the final limits that determine what are data, information, and knowledge.
2.1.2 General Approaches in Analyzing Sports Events
In object recognition and analysis of sporting events discrimination methods are dominating. Discriminatory training methods determine the model's parameters in order to minimize detection of algorithm errors over a set of training images. Such approaches directly optimize the decision-making limit between positive and negative examples. This is one of the reasons for the success of simple models trained by discriminating methods, such as Viola-Jones [17] and Dalal-Triggs [18]
detectors. It is quite harder to train discrimination in partial modeling, although there are certain approaches [19-22].
One of the first solutions, that were successfully implemented in the detection and monitoring of players in sports games, was the BPF (Boosted Particle Filter).
Okuma et al. [23] have used BPF to track players in hockey games. Cai et al. [24]
have expanded BPF by introducing a two-part matching in order to link detection to target objects.
Our approach is very similar to [7], as they also deal with identifying basketball players from video material broadcasted via television. The difference is that they deal with the identification of players on the ground using the CRF (Conditional Random Fields) algorithm. After identifying objects that represent players, they
are trying to recognize who the player is, while our goal is to identify the position at which the player currently is. [6] are also committed to identifying basketball players with footage intended for TV viewers, but their principle is mainly based on the detection of the dominant color representing the court, while players are detected as objects of the different color on the court. The aim of their research is to recognize the situation when the player in the attack got an open position for a shot because no good defense was played against him. Lifang et al. [25] have created an algorithm by which it is possible to recognize on the footage from a basketball game whether the observed frame represents a shot from the default camera (a camera that records the side of the court at which the game is currently played) or whether it is a frame from one of auxiliary cameras (camera under the basket, on the backboard itself, etc.). Huang et al. [26] applied a SVT (Support Vector Tracking) algorithm in the analysis of basketball games in order to track the ball, players and mesh of the hoops. SVT integrates the SVM classifier along with optical stream-based monitoring. By using these detections, they are able to determine what is currently happening on the ground using BBN (Bayesian Belief Network). Different types of shots (close range, intermediate distance and long distance) are recognized, as well as the event of scoring. Zhu et al. [3] use an audio signal in addition to video one in the detection of events at basketball games. They analyze the applause of the audience and the referees’ whistle to correlate some semantic clues.
Alahi et al. [5] deal with detecting and tracking players in basketball matches using a large number of synchronized cameras covering each part of the court.
The player is monitored with each camera in particular, but also in the 3D environment. The presented algorithm is based on the spatial approximation of the points representing the player's locations. This research has a similar goal as ours, but the principle of research itself is different because of additional cameras that significantly facilitate the determination of the player's position. Daniyal et al.
[27] also use multiple synchronized cameras to define the characteristics at both the object and frame level. Objects are detected using an algorithm that monitors color change, while information about the paths for each object is generated using a multi-frame matching technique. At the frame level, the total activity is considered, as well as, the probability that it is one of the defined events, the number of objects and the total score for all objects. These characteristics are used to obtain the total result using a multivariate Gaussian distribution. The best view camera is selected using the DBN (Dynamic Bayesian Network) algorithm. Perše et al. [28] use two cameras attached to the ceiling of the hall where the basketball match analysis is carried out. With these cameras they identify players and their trajectories. Based on the trajectory, they distinguish three types of game: defense, offence and time-out. After that, they are trying to do an analysis of what is currently happening on the floor, using elements such as starting formations, blocks and gestures.
Theron and Casares [29] also deal with analyzing the movements of basketball players in the court. For the purpose of monitoring, GPS (Global Positioning System) devices are used, which give the right position of the player in the near real time. The main goal of their work is the statistical and kinematic monitoring of the players due to physical activity during the match.
Wu et al. [30] examined the process of image reduction in the example of basketball, so it could successfully be displayed on devices such as mobile phones or tablets. The goal is to determine which parts of the image are important (such as the court) in order to display them in the highest resolution, while the less important parts (such as the audience) are rejected. The determination of the court is based on the dominant color principle.
3 Shots Analysis
As part of our previous research [31], the process of separating frames representing a shot to the basket and recognizing all players is explained. This paper presents algorithms that allow the completion of the process of collecting the basic statistical parameters. For recognized players, the exact position on the court is determined. Among them one player stands out who is shooting the ball to the basket and his exact position is given as the position of the shot. All players are attributed to their teams depending on the color of the shirt, in order to have statistics in relation to the team. The final stage is to determine the accuracy of the shot, i.e. whether the ball has passed through the hoop or not.
3.1 Determination of the Player's Position
When all players are detected, it is necessary to determine their current position on the court. The effect of shots from different positions on the team game was described in our previous research [32].
The division of the court into positions can be done in several ways. In professional literature related to basketball, it can be noted that there is no general solution to this problem. The reason can be found in the fact that the effectiveness of a player is generally observed in relation to their position. For this reason, a different division of court should be created for the canter, guard, forward, etc.
Perše et al. [28] have created their own division of court in 14 areas using k-means clustering over recorded player positions. In our study we used a division that is used in most competitions: the court itself is divided into 11 areas.
3.2 Determination of Spatial Transformation
Taking into account the actual dimensions of the court in the NBA basketball league and five points recognized on the court (four points on the paint corners and one point in the visible court corner), we can determine a function that represents a spatial transformation. This spatial transformation performs the projection of the point p = (x, y, 1)T from the image coordinates to the point p’ = (x', y', 1)T which is located within the real court coordinates. A pair of points (p, p') has the relation p' = Hp where H represents a 3x3 transformation matrix having the following form:
2
1
1
2 4 3
1 2 1
c c
b a a
b a a
H
(1)The previous equation has the following elements:
•
4 3
2 1
a a
a a
represents a matrix determining the type of transformation to be applied: scaling, rotation, etc.
•
2 1
b
b
represents a translation vector which simply moves the points•
c1 c
2
represents the projection vector.
The transformation of a point with x, y coordinates into a point with x’, y’
coordinates may be noted as follows:
1 ' '
1
2
1
1
2 4 3
1 2 1
y x y x
c c
b a a
b a a
(2)
Transformation by projection shows how the object changes when the angle of view is changed. This transformation allows the creation of a perspective distortion. To determine the parameters in the matrix, reference points were used in the corners of the restricted area and in cross-sections of the horizontal and vertical court boundaries of the terrain, as well as actual court measurements.
By determining the spatial transformation, we have actually set a function that will enable us to determine the exact position on the court at any point in the image. In this way we also determine the position of basketball players. In [28], observation of the court is performed with special cameras placed on the ceiling of the facility.
Their use does not require any mapping, as the position of players on the court can be directly determined. More cameras are also used in [5], [27], while GPS coordinates are used in [29]. All of this greatly facilitates the process of determining the position of players in relation to our research topic.
Before determining the position of players in the court, it is necessary to determine the position of the players in the picture. In the work [31], we explained how to detect players. However, we now need one point per player that will represent the place where he is located on the court. The X coordinate of this point is determined using the rectangle that marks the entire player. Our X coordinate is located in the middle between the two X coordinates representing the left and right edges of the rectangle. The Y coordinate should represent the feet of the basketball player, because the required point is actually the place where the basketball player is standing on the court. For this reason, we took into account the rectangles representing the ankles of basketball players (areas 14 and 26) to determine this value. The requested Y coordinate is the mean Y-coordinate of the lower edges of these rectangles. Player detection and position determination is shown in Figure 1.
Figure 1
Determining positions of detected players
3.3 Recognizing the Position at the Moment of the Shot
The first step is to determine the position of the ball. By analyzing the video as explained in the previous chapters, frames are selected from the moment of sending the ball to the basket until the moment when ball passes through the hoop or bounces off the hoop. The moment of the shot represents the first frame in this
series, so it is necessary to determine in it the position of the player who sends the shot. The requested player is the player who is the closest to the ball and the analysis starts from determining the position of the ball.
To locate the ball, the image is first transferred to the HSV color model. After that, the area on the image containing the color in the required range is determined. If several areas contain the required color, their analysis is made in relation to the position and size, on the basis of which the ball is located.
The next step is to determine the size of the area within which players will be recognized. In this study, the size of the area is 225 × 425 pixels, with the starting point being 75 pixels left (right) and upwards relative to the ball position. Within these areas, several players can be identified. The goal is to determine one player, who is shooting the ball to the basket. In order to determine it, an algorithm consisting of two steps is used:
1) All objects whose head is located between the ball and the hoop are rejected 2) The object sought is the object whose head is the closest to the ball
Figure 2
Recognition of a player shooting the ball
An example of the execution of this algorithm is shown in Figure 2. From the pictures it can be seen that from a large number of potential detections, the algorithm determines one based on the previous limitations.
After identifying a player, it is necessary to determine his location in relation to the court. The point that represents his location is between his feet. By applying spatial transformation, this point is transferred to the coordinates of the court.
3.4 Attribution of Players to Teams
After the completion of the detection and removal process of the unattainable objects, all recognized objects represent basketball players. Among them are the players of both teams and in order for further processing, it is necessary to detect which player belongs to which team.
The first step is the selection of the clustering area. This is actually the selection of those parts that are covered by the shirt and shorts. Based on these parts, one area that contains them is created and it will be used in further processing.
After creating the area, it is translated into HSV color space for two reasons.
Firstly, because of the fact that the H (hue) component of this color system represents a color. By determining the range that represents the parquet and player's skin, these pixels can be removed from further processing. The other reason is that each team in the championship has two sets of shirts. One set is
"light" and the other is "dark". Both sets are created according to the colors of the club, but also in accordance with the aforementioned rule. In any match, the teams are in different types of shirts (one is in a light set and the other in a dark one). If the S (saturation) component from the HSV model is observed, it can be noted that the light set has a low level of saturation, while the dark set has a high level of saturation.
A 100-bit histogram is calculated, from which the five peaks with the highest value are then selected. A similar principle, in determining the color of the court, was used by Wu, et al. (2012), but in this case, the H component was used and one or two of the most influential peaks.
Five peaks from the histogram of each player enter the process of clustering by the k-means principle. Objects belonging to the first cluster represent the players of one team, and objects belonging to the other cluster represent the players of the other team. By applying this approach, it is not necessary to re-train the algorithm for each new team and the new color of the shirts. An example of the separation of players by teams is shown in Figure 3.
Figure 3
Separation of players in teams
4 Experimental Results
Testing was done over a quarter of a basketball game. During a quarter, the algorithm takes into account over 10,000 frames, so this period is quite sufficient to evaluate the performance of algorithms, such as determining the frames representing the court, the game under the basket, or the shot to the basket. The algorithm for frame extraction is trained specifically for each new game, and the results obtained over one quarter can be expected in other matches too. The identification of the ball and the hoop is based on their color, which is identical in all matches. Determining the accuracy of the shot depends only on the recognition of the ball and the hoop, so here again, the same results can be expected in other matches.
Some algorithms, such as those for identifying the court boundaries, identifying players, separating players by teams and determining their position, are not trained specifically for each new match. The color of the court and the marking line, as well as the color of the player's shirts, vary in different matches. For the purpose of realistic assessment of these algorithms, their testing was carried out on a special set consisting of ten different games. Each game had ten frames selected, which means that the algorithms have been tested over a set of hundred frames.
Within the set, a total of 973 players were shown, so 973 players needed to be identified and their position determined, as well as the team they are playing for.
During the determination of the court boundaries, a total of five lines were determined (horizontal and vertical court boundaries, as well as two horizontal and one vertical restriction zone boundaries), so in this set it was necessary to recognize total of 500 lines.
Test sets used one quarter of a basketball game and a hundred frames from ten different games which are sufficient to evaluate the actual capabilities of the created algorithms, so there should not be any significant deviations in the results obtained if the algorithm was applied over the new matches.
4.1 Identification of the Hoop and the Ball
Identification of the hoop and ball is done based on their color. The hoop is recognized as a red area located near the point that represents the intersection of the horizontal and vertical court boundaries. The accuracy of hoop identification on all frames representing the game under the basket is shown in Table 1.
Table 1
Accuracy of hoop identification (frames representing the game under the basket)
Number of frames Correct Incorrect Percent
5605 5194 411 92.67
Regarding the hoop recognition, in 411 frames hoop was not properly recognized.
This was mostly in frames when the camera shows players leaving the given side of the court after an unsuccessful shot, so the hoop is located at the very corner of the image. In such situations, the position of the basket is not of great importance, and thus relatively large number of incorrect identifications can be ignored.
During the game, we are especially interested in frames that represent a shot to the basket. These are frames from sending the ball to the basket, up to five frames after the ball leaves the area above the basket. The accuracy of hoop recognition is particularly important in these frames and is shown in Table 2.
Table 2
Accuracy of hoop recognition (frames representing a shot to the basket)
Number of frames Correct Incorrect Percent
883 880 3 99.66
The ball is recognized as an area of color orange, and it can be found at almost any location in the frame. Exceptions are areas beyond the basket that surely represent the audience and where the ball cannot be during the game. When recognizing a ball, it may happen that it is obstructed by a player who holds it, and therefore it is not visible. The accuracy of the ball recognition in frames representing a shot to the basket is shown in Table 3.
Table 3
Accuracy of ball recognition Number of
frames
Correct Incorrect Not recognized Visibility percent
883 809 7 67 91.62
From the table it can be seen that from 883 frames, the ball is not visible in 67 frames, and it is not accurately recognized at 7 more, i.e. the visibility percent is 91.62%. Regarding the accuracy of recognition, the algorithm correctly recognized the ball at 809 frames, while the ball is incorrectly recognized in 7 frames. Thus the percentage of accuracy is 99.14%.
4.2 Allocation of Players per Teams
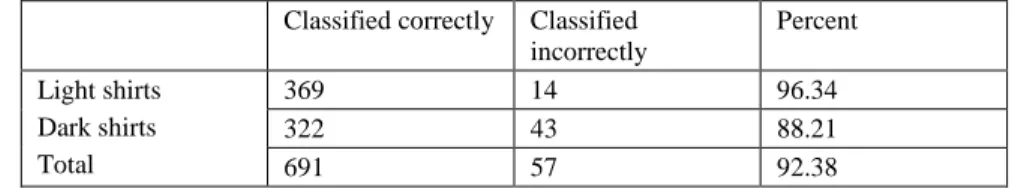
When the player identification process is completed, the goal is to separate them into teams based on the color of their shirt. For this the saturation component of the color of the shirts applied in histograms was used. Such principle of separation of players is applicable in most basketball games and in most leagues. One of its biggest advantages is that the algorithm does not have to be re-trained for every new match and a new color of shirts. The algorithm was tested on the same test set that was also used in player recognition, consisting of 100 frames from ten different NBA basketball games. The results of the players' separation based on the color of the shirts are shown in Table 4. From the total of 748 recognized players, the algorithm correctly classified 691 players, which is an accuracy of 92.38%. The algorithm showed more accuracy for players wearing light shirts (96.34%), compared to players in dark shirts (88.21%). The reason for this difference lies in the fact that dark shirts often have a light area on the side.
Table 4 Separating players by teams Classified correctly Classified
incorrectly
Percent Light shirts
Dark shirts Total
369 14 96.34
322 43 88.21
691 57 92.38
4.3 Determining the Player’s Position
Once the boundaries of the court and players are identified, it is possible to determine their court position. During the game there are many borderline cases.
For example, if a player is between two positions, the decision of the algorithm to assign one of them to a player can be considered both correct and incorrect. Also, if a player is on the three-point line, the algorithm is not sufficiently accurate to
recognize whether the foot is "pinching" the line or not. In this paper, the position is considered correct if the algorithm has allocated the player to any of the two areas between which he is located.
Determining the player's position has been tested over a set of one hundred frames from ten different matches. The results of determining the positions of players are shown in Table 5. From 748 players, the correct position is determined for 724 ones, which is an accuracy of 96.79%. There are two reasons for 24 incorrectly determined positions. The first is in defining the boundaries of the restricted area.
If the boundary is not correctly defined, the starting points for the transformation matrix are also incorrect. As a consequence, points in the frames representing player positions are not correctly mapped to real positions on the court. Another reason is the accuracy of the recognition of the player’s ankles. In some cases, the joints are recognized above or below their actual positions. Then the mapping is done in accordance with the recognized positions of the ankles, which can lead to the allocation of the player to an incorrect area on the court.
Table 5
Accuracy of allocating player’s position on court areas
Area Correct Incorrect Percent
Area 1-3 60 0 100
Area 1-2 60 6 90.91
Area 2-3 42 0 100
Area 2-2 148 7 95.48
Area 3-3 58 0 100
Area 3-2 62 2 96.87
Area 4-3 13 0 100
Area 4-2 74 1 98.67
Area 5-2 102 6 94.44
Area 6-3 14 0 100
Area 6-2 91 2 97.85
Total 724 24 96.79
4.4 Determination of the Shot Position
In the process of testing the algorithm for determination of the shot position, one quarter of the basketball game was used, within which the algorithm recognized a total of 43 shots to the basket. By analyzing the first frames, the data presented in Table 6 were obtained. The table shows that the location is correctly recognized for 36 shots, which is 83.72% accuracy. Examples of accurate determinations are shown in Figure 4. The position of the player at the moment of the shot is shown by a green square, while the position of the ball is shown as a red square.
Table 6
Accuracy of determination of the shot position
Total number of shots Correct Incorrect Percent
43 36 7 83.72
Figure 4
Player shooting position detections
During the analysis, the algorithm failed to detect the player's position in seven frames. This has mostly happened in situations where a player who does not shoot the ball to the basket is recognized, and therefore the correct shot position on the court could not be determined. Due to the resolution of the images, the algorithm is sometimes not able to recognize which of the two players, located near the ball, sends a shot. It also happened that the court boundaries are not correctly recognized so the algorithm does not map the recognized position to the correct location on the court.
4.5 Determining the Accuracy of the Shot
The accuracy of the shot is determined based on whether the ball has passed through the area under the basket after it has been found in the area above the basket. Testing was carried out over 43 recognized shots. Determining the accuracy is given in Table 7. The table shows that testing was done with a different number of frames that are being considered after the ball is found in the area under the basket.
Testing showed that the optimal number of frames is five, when an accuracy of 88.37% is obtained. A smaller number of frames have a greater number of
incorrect recognitions in situations where the points are scored; in some situations, the ball is still not visible in the area under the basket, so the algorithm describes the shot as unsuccessful. When more than five frames are used, the algorithm has a higher number of incorrect identifications in situations where no points are scored. This happens because the player who catches the ball after a failed shot, comes in the area under the basket, and the algorithm recognizes the ball in the required area and describes the shot as successful.
Table 6
Accuracy determining of the shot outcome depending on the number of frames Three frames after the exit of ball from the basket area
Score No score Total
Correct Incorrect % Correct Incorrect % Correct Incorrect %
13 6 68.1 20 4 83.33 33 10 76.74
Four frames after the exit of ball from the basket area
Score No score Total
Correct Incorrect % Correct Incorrect % Correct Incorrect %
15 4 78.95 20 4 83.33 38 5 81.4
Five frames after the exit of ball from the basket area
Score No score Total
Correct Incorrect % Correct Incorrect % Correct Incorrect %
18 1 94.74 20 4 83.33 38 5 88.37
Six frames after the exit of ball from the basket area
Score No score Total
Correct Incorrect % Correct Incorrect % Correct Incorrect %
18 1 94.74 18 6 75 36 7 83.72
Conclusion
The automatic keeping of basketball statistics is the ultimate goal of this research.
It would allow a completely objective recording of the event, as there is a danger that different statisticians will characterize the same event differently (for example, after a missed shot, if the ball first touches the floor, and then one of the players takes it, whether it is a rebound or turnover?). In addition, during a game, numerous activities are taking place that are omitted by classical statistics.
Creating such a system, would potentially allow all of these events to be recorded.
The presented algorithms are the first step in creating automatic statistics management. Their basic contribution is robustness and applicability over large samples of footage, from basketball games. The research brings new approaches in the court determination process (using the Canny algorithm), the separation of players by teams (based on the saturation component calculated over areas covered by their shirts) and determining the exact position of players (using spatial transformations). A player-part-based player identification approach has
also been modified, and the search area has been reduced based on part size analysis performed over complete training and testing sets.
Automated determination of the player’s position in the court is done using the footage broadcasted to viewers through television stations. This type of footage provides a look from just one camera, at any moment of observation, making the detection process more difficult. The first step involves decomposing the image to frames. An analysis is performed on frames in order to separate the game itself and discard the frames that display audience images, interviews with celebrities, announcements of events, etc. In this research, the goal is to collect data on shots as one of the basic statistical parameters.
In addition to the reduced set of frames (which represents approximately a half of the starting set), an algorithm for the separation of shots is applied. Shot is represented as a group of frames from the moment of sending the ball to the basket, up to five frames after the ball leaves the area above the basket. Therefore, it is necessary to implement the recognition of the hoop and ball. This recognition is based on their color within the HSV color model.
The first frame in each group of frames representing the shot is used to determine the position from which the shot is sent. In order to do that, it is necessary to recognize the player who shoots the ball to the basket and determine his position on the court.
For the purpose of detecting a player, a model based on an unoriented mix of parts was used. This approach provides a general framework for modeling the relations between occurrences among mixes of parts, as well as for spatial relations between part locations. In this way, players are detected in the court, as well as the positions of their body parts (arms, legs, head, and torso). Determining the position of arms and legs, in a very dynamic sport such as basketball, is of great importance.
During the detection process, a number of incorrect positive recognitions occurred. These were mostly people in the audience and referees. The paper presents solutions to remove these objects, so that only players are selected, because determining their position is precisely the purpose of this research. Using the Canny algorithm for determining the edges, the court boundaries were defined as well as the area that represents the restriction zone. By mapping points from these areas into real coordinates, a spatial transformation function is obtained that allows us to determine where the player is in relation to the court. The position of the player who sends the shot to the basket represents the location from which the shot was sent.
The accuracy of the shot is determined on the basis of a simple algorithm that checks whether the ball, after the area above the hoop, was also present in the area under the hoop. If it is, we understand that a shot is successful; otherwise we say that the shot was unsuccessful.
The space for further research is wide. Here we present only the first step in creating a system for automatic keeping of basketball statistics. Its advantage in comparison to other systems is that it uses images from just one camera. When analyzing the opposing team and preparing for new matches, coaches most often have exactly this kind of footage. In order to create a practically applicable solution, it is necessary to record other statistical parameters such as rebounds, assists, turnovers, blocks, etc.
It would be particularly useful to further develop the research itself in the direction of qualitative analysis of the game and recognizing the templates in the game of a particular team. Such research should include the movement of players, and their recognition in each frame would be done. In this way, a player base could be created based on their characteristics, which are determined automatically by the created algorithm. Such a system would be very useful to coaches and scouts, as they could quickly find the profile of the players that fit their team.
References
[1] Felzenszwalb, P., Girshick, R., McAllester, D. & Ramanan, D., 2010.
Object detection with discriminatively trained part based models. IEEE Transactions on Pattern Analysis and Machine Intelligence, 32(9), pp.
1627-1645
[2] Yang, Y. & Ramanan, D., 2011. Articulated pose estimation with flexible mixture of parts. Computer Vision and Pattern Recognition
[3] Zhu, X. et al., 2005. Video data mining: Semantic indexing and event detection from the association perspective. IEEE Transactions on Knowledge and Data Engineering, 17(5), pp. 665-677
[4] Huang, C., Shih, H. & Chen, C., 2006. Shot and scoring events identification of basketball videos. s.l., s.n., pp. 1885-1888
[5] Alahi, A., Boursier, Y., Jacques, L. & Vandergheynst, P., 2009. Sport players detection and tracking with a mixed network of planar and omnidirectional cameras. s.l., s.n., pp. 1-8
[6] Chang, M., Tien, M. & Wu, J., 2009. WOW: wild open warning for broadcast basketball video based on player trajectory. s.l., s.n., pp. 821-824 [7] Lu, W., Ting, J., Murphy, K. & Little, J., 2011. Identifying Players in
Broadcast Sports Videos using Conditional Random Fields. s.l., s.n., pp.
3249-3256
[8] Schumaker, R., Soliman, O. & Chen, H., 2010. Sports data mining.
s.l.:Springer
[9] Lewis, M., 2003. Moneyball. New York: W.W.Norton & Company
[10] Piatetsky-Shapiro, G., 2011. [Online] Available at:
http://www.kdnuggets.com/faq/difference-data-mining-statistics.htm
[11] Ballard, C., 2005. Measure of success. Sports Illustrated
[12] Devenport, T. & Prusak, L., 1998. Working knowledge. s.l.:Harvard Business School Press
[13] Lahti, R. & Bayerlein, M., 2000. Knowledge transfer and management consulting: a look at the firm. Business Horizonts, 43(1), pp. 65-74
[14] Ackoff, R., 1989. From data to wisdom. Journal of applied systems analysis, Volume 16, pp. 3-9
[15] Carlisle, J., 2006. Escaping the veil of Maya - widsdom and the organization. Koloa Kauai, HI, s.n
[16] Chen, H., 2006. Intelligence and security informatics for international security: information sharing and data mining. s.l.:Springer
[17] Viola, P. & Jones, M., 2004. Robust real-time face detection. International Journal of Computer Vision, 57(2), pp. 137-154
[18] Dalal, N. & Triggs, B., 2005. Histograms of oriented gradients for human detection. s.l., s.n., pp. 886-893
[19] Bar-Hillel, A. & Weinshall, D., 2008. Efficient learning of relational object class models. International Journal of Computer Vision, 77(1), pp. 175-198 [20] Holub, A. & Perona, P., 2005. A discriminative framework for modeling
object classes. s.l., s.n
[21] Quattoni, A. et al., 2007. Hidden conditional random fields. IEEE Transactions on Pattern Analysis and Machine Intelligence, 29(10), pp.
1848-1852
[22] Ramanan, D. & Sminchisescu, C., 2006. Training deformable models for localization. Computer Vision and Pattern Recognition, Volume 1, pp. 206- 213
[23] Okuma, K. et al., 2004. A boosted particle filter: Multitarget detectionand tracking. s.l., s.n
[24] Cai, Y., de Freitas, N. & Little, J., 2006. Robust visual tracking for multiple targets. s.l., s.n
[25] Lifang, W., Xiuli, H., Hao, C. & Wei, S., 2007. Shot segmentation and classification in basketball videos. s.l., s.n., pp. 539-542
[26] Huang, C., Shih, H. & Chen, C., 2006. Shot and scoring events identification of basketball videos. s.l., s.n., pp. 1885-1888
[27] Daniyal, F., Taj, M. & Cavallaro, A., 2010. Content and task-based view selection from multiple video streams. Multimedia Tools and Applications, Volume 46, pp. 235-258
[28] Perše, M. et al., 2009. A trajectory-based analysis of coordinated team activity in a basketball game. Computer Vision and Image Understanding, 113(5), pp. 612-621
[29] Theron, R. & Casares, L., 2010. Visual Analysis of Time-Motion in Basketball Games. s.l., s.n., pp. 196-207
[30] Wu, L. et al., 2012. Semantic aware sport image resizing jointly using seam carving and warping. Multimedia Tools and Applications
[31] Ivankovic. Z. Rackovic M. Ivkovic M. 2014. Automatic player position detection in basketball games, Multimedia Tools and Applications, 72(3), pp. 2741-2767
[32] Ivankovic, Z. et al., 2010. Appliance of Neural Networks in Basketball Scouting. Acta Polytechnica Hungarica, 7(4), pp. 167-180