VARIOUS METHODS OF ANALYSIS OF GAS MIXTURES
22. QUALITATIVE AND SEMIQUANTITATIVE ANALYSIS OF GAS MIXTURES*
To start with, the light source and a discharge tube of a p - propriate design must be selected on the basis of considerations set forth in Section 1 6 .
The discharge tube is sealed to a vacuum unit of the type described in Section 7. This is followed by a period of "condition- ing" of the tube. This procedure is used because air is strongly adsorbed on the electrodes and the walls of the discharge tube, a s are gases present in the tube before the introduction of the sample. If not removed, these gases evolve during the discharge, with the result that lines of foreign elements will appear in the sample spectrum. To avoid this, the discharge tube is filled with s o m e gas known to be present in the sample (usually, the primary component). The discharge is then switched on for a few minutes.
Its c o l o r , as well as the characteristic bands or lines in the
*See also general handbooks on spectral analysis [25, 317, 375].
173
spectrum, immediately indicates whether such impurities as nitro- gen, oxygen, hydrogen, carbon monoxide, C2$ OH, CH or CN are present in the tube.
The current used in the conditioning of the tube is somewhat higher than is required under the analytical conditions. The gas p r e s s u r e is maintained at a level approximating that required during the analysis. After this conditioning, the unit is evacuated (5-10 min) and a new portion of the conditioning gas is introduced.
At first, no lines or bands indicating impurities may appear in the spectrum, but as such impurities continue to evolve from the electrodes and walls of the tube, both lines and bands will gradually be seen. The discharge is again maintained for several minutes and then the tube is reevacuated. Tube conditioning is continued until all of the lines excited by adsorbed impurities disappear completely from the spectrum. The conditioning time varies with the type of discharge. When internal electrodes are used in a glow discharge, the conditioning may require several days, but the tube, once free of impurities need not be subjected to another such long conditioning during subsequent u s e . On the other hand, use of a high frequency discharge tube with external electrodes requires only that the gas in the tube be replaced a few t i m e s , after which the tube is ready for use either in qualitative or in quantitative analysis.
In c a s e s where large quantities of the sample are available, it is convenient to use the flow method of analysis. The optimum gas pressure in the discharge tube and the flow rate must be d e - termined experimentally. The recording of the spectrum can start a few minutes after the current has been switched on, and one obtains several spectrograms in succession. The spectrogram which does not show any lines of stray impurities is used in analysis. If one uses short current bursts produced by a discharge
of a capacitor, the tube need not be conditioned since neither the walls nor the electrodes heat up sufficiently to evolve adsorbed g a s e s .
Interpretation of spectrograms consists in identifying every one of the spectral lines visible in the photograph. To speed up a qualitative analysis it is necessary to have on hand a set of photo- graphs showing the spectra of most of the common g a s e s , obtained on the same spectrograph that will be used in the analysis, and if possible, with the s a m e light source. By superposing the analytical and reference s p e c t r o g r a m s , one can identify at once a number of lines. Verifying the presence of hydrogen in a gaseous mixture is a most difficult problem, since this gas evolves not only from the walls of the tube but also from the greases and sealing compounds.
This is especially true during the first few days after regreasing of stopcocks when the persistent hydrogen line, Ha, can be d e - tected in virtually all spectrograms. Rigorous precautionary m e a s - ures are therefore necessary when determining traces of hydrogen;
specifically, it is advisable to work with weak currents. The spectrum of the gas sample is photographed along with the spectrum of its primary component. The presence of hydrogen cannot be unequivocally established unless the analytical spectrogram displays greater intensity of the hydrogen lines than the reference photograph.
Historically, the first paper on qualitative analysis of gas mixtures, which dates back to 1 8 9 6 , described the determination of hydrogen in air [ 4 0 3 ] . Then Moureu and Lepape [404] determined the krypton and xenon concentrations in argon by visual photom- etry. They adjusted the p r e s s u r e s so a s to obtain a match between the intensities of the krypton and xenon lines and those of the argon lines at various concentrations of krypton and xenon in argon. Tables of homologous line pairs were then compiled for the concentration range of 0.05 to 0.5%. Pentcheff [405] used the
Sample Concentration
range, % Analytical method Nitrogen in hydrogen
Hydrogen in nitrogen Nitrogen in oxygen Oxygen in nitrogen
0.037-7.8 1-20 0.057-12.5
1.25-12.5
Persistent lines and homologous pairs Homologous pairs Both methods Both methods
The intensities of nitrogen lines were compared with those of iron lines, since the electrodes contained iron as an impurity. However, this procedure is not too good, because the intensity of lines of the electrode material varies (with the discharge conditions). A s seen from the table, the sensitivity was poorest in the case of deter- minations of impurities in nitrogen. The sensitivity of hydrogen determinations in nitrogen is improved if helium is added. This sharply increases the intensity of the Ha lines. Thus, the intensity of the Ha line at a concentration of 1.75% H2 in N2 is the s a m e as when 10% H2 is present in the absence of He. The Heyes method is still extensively used in spectral analysis of gas mixtures, Moureu-Lepape technique for the analysis of gas from water originating from various natural sources and improved the sen- sitivity of the method, achieving a limit of detectability of 0.01%.
Heyes [406] worked with condenser spark discharges between metal electrodes at atmospheric p r e s s u r e . The gas mixture was introduced by suction into a discharge tube in which aluminum electrodes were mounted 8 m m apart. An induction coil (this was the excitation source in many early experiments) with the breakdown gap of 15 cm supplied the current. A capacitance C = 8260 μ F and an inductance L = 2.3 . 10~5 henry were connected in the circuit of the secondary, with a 7 A current flowing through the primary.
Analysis, carried out by the method of persistent lines as well as by the method of homologous pairs (internal standard), yielded the following results:
*The optimum quantities of helium added to the mixture were selected by experiment.
It would appear that it is undesirable to dilute the mixture more than by a factor of 10.
because addition of large quantities of an element with a high excitation potential increases the electron temperature in the d i s - charge gap and, consequently, the analytical sensitivity for the difficult-to-excite components.*
Somewhat e a r l i e r , interesting results were reported by Paneth and Petters [407] during analysis of helium and neon in a i r . They used an induction coil connected in parallel to a spark gap. The discharge tube was a narrow capillary. The thin wire electrodes could be moved in the capillary, thus materially altering the discharge conditions.
In later experiments, Paneth and Günther [408] abandoned the induction coil, because the method failed to produce spectral lines of sufficient intensity. They then worked with high frequency electrodeless discharges from a Tesla transformer and deter- mined small quantities of hydrogen and neon in helium. The gases were excited in 0 . 1 - 0 . 4 m m capillaries. Hydrogen was detected in helium in concentrations as low as 0.1%, with the appearance of H lines being strongly dependent on p r e s s u r e . Best results were obtained at pressures ranging from 2 - 4 m m Hg. In deter- mining neon in helium, the pressure range of 2 - 4 m m Hg was again used, and the limit of detection was 0.002%.
Qualitative analysis of inert gases in helium is described by Karlik [ 3 5 8 ] . An h-f tube oscillator was used for spectrum e x - citation [ 4 0 9 ] . The quartz discharge tube, 1 - 1 . 5 m m in diameter, carried external electrodes set 3 . 5 c m apart. The range of p r e s - sures investigated was 0.01 to 0.1 m m Hg. The tube was connected to the remainder of the unit by means of a mercury seal so that it could be rotated alternately toward one of two spectrographs, one
Gas
Spectral region
Absolute quantity cm 3 Gas Ultraviolet Visible
Absolute quantity cm 3
Argon 5·1(Γ2 3-10"2 6 . 1 0 -9
Krypton 3 1 0 "3 2-10"3 4-10"10
Xenon 3-10"3 3 1 0 ~3 6-10"10
Neon 2—610"3 2_3· 10~3 5.10"10
T r a c e s of a difficult-to-excite impurity of a gas mixture can be detected in the cathode regions of a glow discharge. Thus, Frisch and Konovalov [366] were able to detect a few tenths of one percent of argon in nitrogen.
To determine argon in nitrogen, Van Liempt and V i s s e r [410]
photographed radiation emitted by the positive column of a glow discharge and studied the argon line Ar λ 4159 Ä . When the glow is photographed in the vicinity of an internal electrode, the sen- sitivity for the difficult-to-excite component in a high-frequency discharge is no higher than in analysis confined to the positive column of a glow discharge. However, with external electrodes the sensitivity can be improved to a point where argon can be detected in nitrogen at concentrations of a few tenths of one percent.
Monfils and Posen [411] developed a method for determining traces of nitrogen in argon. The analysis was carried out in a of which was used for the visible and the other the UV spectrum.
Long low pressure discharge was associated with a fatigue effect, which was apparent from the fact that it became m o r e and m o r e difficult to start the discharge. The fatigue was removed upon introduction of air or oxygen into the tube. Prior to analysis the tube was conditioned in pure helium. Karlik tabulated the limits of detection (in %) for argon, krypton, xenon and neon in helium, both in the visible and the UV regions:
hollow cathode and in the anode portion of the discharge, using a pointed anode. In using the hollow cathode portion and p r e s s u r e s of the order of 1CT1 m m Hg, the authors were able to detect argon in concentrations of the order of 10~2%. The authors noted that, while the sensitivity for nitrogen increases with pressure in the tube, the discharge becomes unstable. In the anode region, the limit of detection was 0.01%. However, neigher in the anode region nor in the hollow cathode were the discharge conditions favorable for excitation of nitrogen in argon.
Duffendack and Wolfe [381] obtained high sensitivity for nitrogen and hydrogen in helium. In the positive column of a glow d i s - charge, hydrogen was detectable in concentrations as low as 0.005%, and nitrogen in concentrations of about 0.02%. (In a high frequency discharge, the limit of detection was of the order of 10~4 %.)
In a pulse discharge [271], helium can be determined in nitrogen or argon, and neon in a i r , when present in concentrations of the order of 10"2%.
The above s u m m a r y shows that, given a judicious selection of the excitation source, discharge conditions and the discharge tube dimensions, the limit of detection for the difficult-to-excite component can reach 1 0- 1% , and in s o m e c a s e s even 1 0 '2% , whereas the same limit for the easily excited component of the mixture is of the order of 10"4 %.
Spectrograms for qualitative analysis can be obtained readily and speedily with the aid of a v e r y compact device described in [ 4 1 2 ] . This device consists of a pocket-size Z e i s s direct vision spectro- scope combined with a camera for recording the spectrum on film (see Fig. 6 8 ) . The excitation of the gas mixture is achieved by means of a standard 2450 M c , 1 0 - 1 0 0 W magnetron oscillator.
In many c a s e s , it is relatively simple to obtain a rough quanti- tative estimate of the composition of a mixture. This is done
FIG. 68. General view of a spectroscope camera for qualitative analysis.
semiquantitatively either on the basis of persistent lines or with homologous pairs. The accuracy of the method of persistent lines is not better than the order of magnitude, since the d i s - charge conditions must be very exactly reproduced. More accurate results are obtained via the method of homologous pairs. A s a preliminary step, one prepares a table of lines of equal intensities at various concentrations in the mixture. This is done at strictly specified discharge conditions which are then maintained constant.
This method can be used both with photographic recording or visual examination of the spectrum. At the present time, it is used mainly in semiquantitative analysis performed with the aid of a styloscope.
When checking the purity of a g a s , it is often sufficient to establish only the upper or lower cncentration limits for such impurities present. This amounts to, in effect, to a visual s e m i - quantitative evaluation of the impurity content, an evaluation which can be successfully accomplished by means of a styloscope or s o m e other type of visual spectroscope. The visual methods of
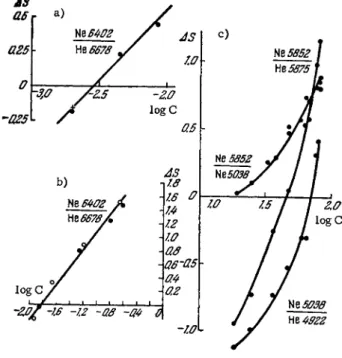
semiquantitative metal and alloy determinations by means of a styloscope or stylometer are well developed [413] and are widely used in the industry. Styloscopic determinations of gas mixtures are, in fact, l e s s complicated than those of alloys because gas spectra show fewer lines. Thus, in an actual case of gas mixture analysis with the aid of a styloscope, minute quantities of neon were determined in helium [ 4 1 4 ] . A high-frequency oscillator was used to generate the discharge. The discharge tube (8 m m I.D.) was made of quartz and contained the sample at a pressure of 8 m m Hg. The light emerging from the discharge capillary was allowed to fall directly upon the styloscope slit, obviating a condenser lens. The most sensitive neon line in the visible spectrum was t h ej λ 6402 A line. The only helium line displayed in this region ( λ 6678 A) was used as the comparison line. When neon is added to pure helium, its line λ 6402 A begins to ap- pear in the spectrum only at concentrations of 0.001% or greater.
When neon is present in a concentration of 0.08%, the neon and helium lines show equal intensity. Helium spectra are characterized by the scarcity of lines, hence it is extremely difficult to find helium and neon lines of equal intensity at low neon concentrations in the sample. For this reason, the relative line intensities of neon and helium were compared by viewing the spectrum through an optical step attenuator, set up in front of the styloscope slit and at s o m e distance from it. If the attenuator is placed directly on the slit, then the astigmatism of the instrument causes the vertical spectral lines and the horizontal steps of the filter to focus in dif- ferent planes, so that it is impossible to see clearly and s i m u l - taneously both the spectrum and the individual steps of the at- tenuator. By placing the attenuator in front of the styloscope slit, it is possible to focus in one plane the individual steps of the at- tenuator and the spectral lines. Comparison of neon and helium
Neon concentrations, %
Steps of the optical attenuator (on the left, Ne λ 6402 Â;
on the right, He λ 6678 A) 0.001
0.009 0.014 0.030 0.050 0.070 0.080 0.095 0.150 0.220 0.470 0.940
Logarithms of the trar steps are: 2 . 0 ; 1.86; 1.7'
The 6402 A line becomes visible 1 = 2
1 = 3 1 = 4 1 = 5-6 1 = 7 1 = 1 8 = 1 7 = 1 5 = 1 3 = 1 2 = 1
ismission values for the attenuator t; 1.64; 1.51; 1.38; 1.24; 1.12.
The concentration range of 0.001-0.01% can be calibrated if a step attenuator of greater optical density is available. Styloscopic determination of neon in helium thus becomes possible at concen- trations ranging from 0.001 to 1%. However, other analytical line pairs must be used to determine higher neon concentrations, since at those concentrations the neon line λ 6678.28 Ä superposes on the helium line λ 6678.15 Ä . When neon is present in low concentra- tions, this neon line is weak and cannot affect the results. At neon concentrations of 1% and higher, the analysis should be based on the line pair He λ 5876 Ä - Ne λ 5852 Α .
The determination of the composition of other gas mixtures by the visual semiquantitative technique is also relatively simple.
23. QUANTITATIVE ANALYSIS OF BINARY GAS MIXTURES The analysis of binary gas mixtures can be divided into the following groups:
I. Determination of molecular gases in inert gases.
line intensities gave the following results for different degrees of attenuation:
II. Analysis of mixtures of inert g a s e s .
III. Determination of inert gases in molecular g a s e s .
IV. Analysis of mixtures consisting of two molecular g a s e s . The first group of analysis can be classified as determina- tion of an easily excited component in a difficult-to-excite p r i - m a r y constituent, while the third group, is the opposite, that i s , determination of a difficult-to-excite minor component in an easily excited primary constitutent. In groups II and I V , the primary constituent can be either an easily or a difficult-to- excite g a s .
We shall discuss a few typical c a s e s which illustrate the analyt- ical approach to each of the above groups. The gas mixtures as well a s the analytical pairs used a r e listed in Appendix Π.
I. Determining nitrogen, oxygen, hydrogen and hydrocarbon impurities in inert gases
This is the simplest case of analysis of an easily excited c o m - ponent in a difficult-to-excite gas, and there are no major difficulties in achieving relatively high sensitivity. The light source is the positive column of a DC or a high-frequency discharge. The most reproducible results are achieved with a high frequency discharge in a tube with external electrodes. In the determina- tions of nitrogen, oxygen and hydrogen in inert g a s e s , the maximum relative sensitivity (of the order of 10"3-10-5%) can be obtained only when the gas pressure in the discharge tube is high. Increas- ing the pressure in large-diameter discharge tubes causes a c o m - pression of the positive column, which results in a significant decrease in the brightness of the radiation. Therefore, there is nothing to be gained by operating at pressures higher than 20 m m Hg, because the relative sensitivity under these conditions does not exceed a few hundredths of one percent. On the other hand, in narrow capillaries ( 0 . 5 - 1 m m bore), p r e s s u r e s of several
hundred m m Hg do not reduce the brightness of the emitted radia- tion, so that one can determine impurities in concentrations of 1 0 - * - 1 0 -5% [415].
Nitrogen determination in helium
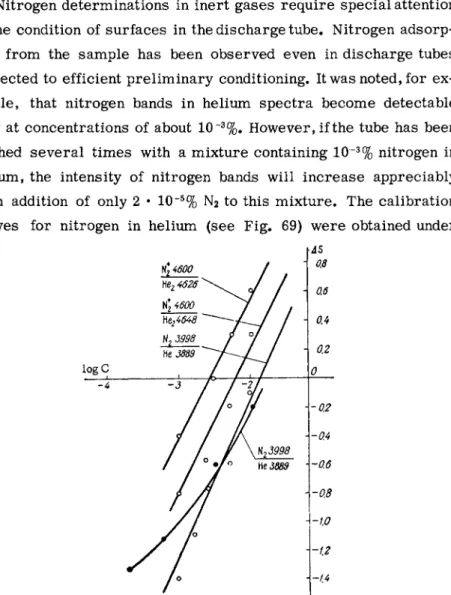
Nitrogen determinations in inert gases require special attention to the condition of surfaces in the discharge tube. Nitrogen adsorp- tion from the sample has been observed even in discharge tubes subjected to efficient preliminary conditioning. It was noted, for e x - ample, that nitrogen bands in helium spectra become detectable only at concentrations of about 10 ~3%. However, if the tube has been flushed several times with a mixture containing 10~3% nitrogen in helium, the intensity of nitrogen bands will increase appreciably upon addition of only 2 · 10~5% N2 to this mixture. The calibration curves for nitrogen in helium (see Fig. 69) were obtained under
AS 0.8
logC
FIG. 69. Calibration curves for determina- tion of nitrogen in helium. The curves were obtained under several discharge conditions.
the following conditions. The mixture was excited by a high f r e - quency discharge (/ = 6 Mc) in a 1 m m I.D. capillary, at a pressure of 600 m m Hg and a current of 300 m A . Under these conditions the visible spectrum of the mixture (see spectrum X in Appendix VI) displays lines of atomic helium as well as bands of molecules He2, N2 and NÎ. Analytical pairs such as Ηε2λ 4648 A— N / 4 6 0 0 A, He2 λ 4626 A - N2 4 λ4278 A , N2 λ 3998 A- H e l 3889 A may then be used.
P r e s s u r e variations of 100 m m Hg do not affect the variation in the relative intensities of the He2 and NÎ bands. Analytical results are reproducible to within 5%.
Nitrogen determination in neon
Over the concentration range of 10~4-10*2%, nitrogen admixtures in neon are determined from the bands of the second positive nitrogen system C3n- Β3Π lying in the 3500 A region (see Appendix VI, spectrum XI). At nitrogen concentrations in the sample of the order of one tenth of one percent, the first positive system of nitrogen bands Β3Π — Α3Σ can likewise be used for nitrogen deter- mination.
If the nitrogen-containing sample also containing small quantities of carbon dioxide and hydrocarbons, the nitrogen can be determined in neon from the CN bands, whose intensity varies linearly with changes in nitrogen concentration. The analytic conditions are the s a m e as in the case of nitrogen in helium or argon. The mixture is excited at a pressure of the order of 100 m m Hg, using a high frequency discharge and a 0 . 5 - 1 m m I.D. capillary. An appropriate interference filter can be used to separate the neon bands.
Nitrogen determination in argon
The analytical procedure for determination of nitrogen in argon with a high frequency discharge as an excitation source is d e - scribed in Section 2 6 .
If the sample is flowing through the discharge tube, the nitrogen- argon mixture can be excited not only in a high frequency discharge, but also in the positive column of an A C discharge [416] or in a hollow cathode [366]. However, the order of magnitude of the relative sensitivity of nitrogen determination in these sources does not exceed 0.01%, with the average analytical e r r o r amounting to about 20%.
When traces of nitrogen are determined in a hollow cathode it is advisable to base the analysis on the λ 4236 À. band. At nitrogen contents ranging upward from 0.1%, the λ 4709 Â. band can be conveniently employed. The use of analytical pairs Ar λ 3949 A — Ν2λ 3943 A or Ar λ 4044.42 Α — Ν2 λ 4059.4 A is recommended by one experimenter [ 4 1 6 ] .
It was shown [417-420] that the determinations of traces of nitrogen in argon can be conveniently based on the total intensity of bands II of the positive nitrogen system. These bands are located in the 3 9 0 0 - 3 6 0 0 A region, which is easily separated by means of filters. This technique has been employed by a number of authors in developing automatic gas analyzers [ 3 5 8 , 3 5 9 , 4 2 1 , 422]. A description of such analyzers was given in Section 1 4 .
Oxygen determination in inert gases
Oxygen concentrations of 10~4 % and higher can be determined in neon and helium if the sample is excited by means of a high f r e - quency discharge in 0 . 5 - 1 m m I.D. capillary at a pressure of
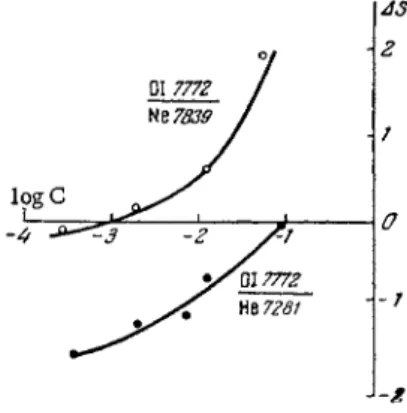
~ 600 m m Hg. The analysis is based on the lines of atomic oxygen in the infrared spectrum. When neon or helium are the principal constituents, the analytical line pairs are OI7772 A—Nel 7839 A and OI 7772 A - H e l 7281 A, respectively.
Again, the discharge tube should be flushed with the sample prior to analysis, since oxygen is adsorbed on the discharge tube to an even greater extent than nitrogen.
ο
-7
-M FIG. 70. Calibration curves for determination of oxygen in neon
and helium.
The sensitivity of oxygen determinations can be improved by using equipment of high dispersion. The above results were o b - tained with an ISP-51 spectrograph, / = 270 m m (see Appendix I V ) . Simplified analytical techniques can be used provided one also employs a monochromatic filter with a v e r y narrow passband for the Ο Ι λ 7772 A line.
Hydrogen determination in inert gases
In this case, both the vacuum unit and discharge tube should be thoroughly outgassed, and all water vapor should be removed. Out-
gassing the equipment does not remove all the water: over 1 8 - 2 5 The limit of detection of oxygen in argon is lower than in helium or neon, it being no higher than 0.01%. The analysis should be based on the analytical pair ΟΙ λ 7772 A—Ar λ 7624 Α.
Figure 70 shows the calibration curves for oxygen in inert g a s e s . The shallow slope of the curves and their deviations from linearity over the range of low concentrations can be attributed to the presence of a background as well as traces of oxygen which remain adsorbed on the walls of the tube even after flushing with pure inert g a s .
JS 2
hours, the amount of water vapor evolving from the walls of even a carefully outgassed tube is sufficient to increase the hydrogen con- tent of the sample by several hundredths of one percent (the d i s - charge dissociates the water). In addition, the release of water vapor from the walls is accelerated by the discharge, and the rate of evolution increases with the discharge current. To add to the dif- ficulties, the tube adsorbs hydrogen from the sample. Thus, if the sample in the tube is replaced by a pure gas, the latter will show traces of hydrogen. The latter cannot be completely removed unless the tube is heated by means of a gas burner. These complications are encountered with all mixtures containing hydrogen.
Hydrogen analysis in helium is described in [ 3 8 4 , 4 1 9 , 4 2 3 , 424], A helium-hydrogen mixture is excited by a high frequency discharge in a 1-2 m m I.D. capillary, the maximum working p r e s - sure being —20 m m Hg. The limit of detection can be as low as 10"3% [384], Hydrogen determinations in helium can be carried out both in sealed and open discharge tubes, under conditions of con- tinuous passage of the gas [ 3 8 4 , 4 2 3 ] , The analtyical line pairs used are Ηβλ 4861 Α - Η θ λ 4922 Α , Ηβλ 4861 A - H e λ 5047 A . The red hydrogen line Ηαλ 6562 A. can also be used. In the concentra- tion range of 1 0 -3- 1 0_ 2% , the analytical e r r o r s amounted to about 25% and to 10% for concentrations ranging from 10"2 to 1 0_ I %.
To obtain reproducible results, especially at low hydrogen con- centrations, the discharge tube should be thoroughly conditioned by heating with a gas burner after each analysis [ 3 8 4 ] . When working in a stream of g a s , the conditioning of the tube is done with the sample during preliminary firing.
According to [ 4 1 9 ] , an alternative method of hydrogen deter- mination in helium consists of isolating the analytical lines by means of monochromatic interference filters. The limit of detection is in this case determined by the quality of the filter used to separate the hydrogen line. Filters with Xm = 486 millimicrons, Δλ = 1 0
millimicrons at Tr/Tm of the order of several percent, allow the determination of hydrogen in helium when the former is present in amounts of not l e s s than a few hundredths of one percent.
The methods of hydrogen determination in argon and neon a r e the s a m e a s those used in analyzing helium for its hydrogen content.
Determination of total hydrocarbon content in inert gases
Emission spectroscopy can only determine the total hydrocarbons in an inert g a s , without identifying the compounds. Analysis is based on the CH λ 4 3 1 5 A or C2 5165 A bands, which are easily excited in any type of discharge.* The limit of detection range s from 1 0_ 4t o 10~5%.
However, if the hydrocarbon content is greater than 0.01%, the anal- y s i s becomes virtually impossible, because the spectrum of the sample shows nothing but C2 and CH bands whose intensities do not vary with concentration of the hydrocarbon. If the inert gas also in- cludes hydrogen, the hydrocarbon analysis becomes ambiguous, since the intensities of C2 and CH bands become greater a s the concentra- tion of the hydrogen impurities in the sample i n c r e a s e s . In such c a s e s , one can establish only the range of the hydrocarbon content in the sample, and eventhat, m o r e often than not, will involve large e r r o r s . In these paragraphs we discussed only the determination of single minor components of samples consisting mainly of an inert gas. Such analyses are seldom encountered in practice, because what is generally required is the simultaneous determination of several components.
Various techniques for simultaneous determination of several components of a sample are described in Sections 1 8 , 25 and 2 6 .
II. Analysis of mixtures of inert gases
Analyses involving binary mixtures of inert gases are required in the manufacture of these g a s e s . For instance, helium of spectral
•The vapors of the sealing compound (grease) interfere in this analysis because they are decomposed in the discharge, producing high-intensity CH bands.
purity is known to invariably contain traces of neon which cannot be removed by the usual methods. Conversely, neon always contains s o m e helium. It is also very difficult to separate krypton and xenon. Furthermore, a krypton-xenon mixture invariably contains traces of argon.
Determination of neon in helium
Neon can be quantitatively determined in a helium-neon mixture when present in concentrations ranging from 0.001 to 99.9%. The standard deviation of a single analysis varies between 3 . 5 and 7.5%, depending on the concentration. Figures 71 a and b show calibration
AS
as,
c)-025
-2.0 logC
as
b) JS
-xia
Ne 5552 Ue505â US
o\
logC
zo
14 12 ΙΟ
\06'05\
as
logC 04
« J *—I 1 1 1 • ' ' 02
-ZO/ -IS -12 -GS -04 5
FIG. 71. Calibration curves for determining the neon concentration in a neon-helium mixture.
curves for determination of neon in helium when the former is p r e s - ent in low concentrations (0.002 to 0.01%). The spectra were o b - tained in a high-frequency discharge using an 8 m m I.D. capillary,
a p r e s s u r e of 10 m m Hg, and a discharge current of 200 m A . The analytical line pair used was Νθλ 6402 Â — He λ 6678 A . Figure 71c shows calibration curves plotted on the basis of various an- alytical pairs for neon concentrations in helium ranging from 18 to 75%. It is evident from this graph that electron temperature variations associated with changes in the composition of the mixture alter the ratios of intensities of different lines of one of the c o m - ponents. Thus, when neon is present in helium at a concentration of 18%, lines Νβλ 5852 A and Νελ 5038 A have about the same intensity, while at a concentration of 75%, the first line is far m o r e intense. Because of this, there is no need for using the lines of a second element as a reference, and the analysis of a mixture can be based on calibration curves plotted from the relative in- tensities of different lines of the s a m e element, which are changed to a different extent by variations in the discharge conditions. The m o s t conspicuous variation of intensity ratios is noted in the arc and spark lines of one and the s a m e element.
The relative sensitivity of quantitative analysis of helium-neon mixtures is lower than that for helium in nitrogen. This is because an increase in the total pressure in the discharge tube to 600 m m Hg drastically alters the spectral pattern of helium. Thus, at p r e s s u r e s of 100 m m Hg and higher, the spectrum shows, in addition to atomic lines, high intensity He2 bands (6399, 6 3 1 0 , 5 8 6 2 , 4 6 4 9 , 4626 A) slightly shaded to the red region of the spec- trum. The He2X 6399 A band becomes superimposed on the s e n - sitive line Νβλ 6402 A . For this reason, the pressure in the d i s - charge tube should not exceed 100 m m Hg for neon determina- tions in helium. The limit of detection for neon in this case is 1 0_ 3% .
The procedure of neon determination in helium is readily s i m p l i - fied if the neon lines are separated by means of monochromatic filters with a broad passband for 200 A and λ™ 6400 A [419].
The limit of detection of helium in neon is 0.1% or l e s s . The 5876 A analytical line for helium is very close to the neon line 5882 A . For this reason, the simplified analytical procedure based on the use of filters is not very sensitive. For direct deter- mination of neon in helium in gas discharges, see Section 2 7 .
Xenon determination in krypton
This analysis involves no particular difficulties. Limits of d e - tection of about Ι Ο- 2 - 1 0_ 3% can be attained, if the sample is excited in the positive column of a high frequency discharge ( 1 - 5 m m I.D.
capillaries and pressures of 5 - 1 0 m m Hg).
The determination of traces of krypton in xenon is considerably m o r e complicated. The limit of detect ion, even with a high frequency discharge produced in 0.5 m m I.D. capillary at p r e s s u r e s of 0 . 4 - 0 . 5 mm Hg, does not exceed a few tenths of one percent. The analysis is based on the analytical line pairs Kr 5871 A—Xe 5875 A, Kr 5871 A—
X e 5976 A , K r 5571 A—Xe 5419 Â , e t c Calibration curves for krypton determination in xenon are shown in Fig. 7 2 .
Krypton detemination in xenon can be based on the electrode regions of the discharge, or the glow inside the external electrode
(which is an analog of a hollow cathode in a high frequency d i s - charge). Both arc and spark krypton and xenon lines in the 4 0 0 0 - 4 8 0 0 A region can be used as the analytical pairs (see Appendix V , spectrum V ) .
Argon determination in a krypton-xenon mixture
Determination of traces of argon in a krypton-xenon mixture, as well as of traces of krypton in xenon, are typical examples of anal- y s i s for a difficult-to-excite component in an easily excited primary constituent. There is little difference between the excitation poten- tials of Kr and X e lines, but argon lines require considerably higher excitation potentials. A further difficulty associated with the
FIG. 72. Calibration curves for krypton determination in xenon.
determination of argon in krypton-xenon mixtures lies in the fact that the sensitive argon lines which appear during transitions to m e t a - stable levels 3P2a n d3P0a r e located in the infrared region. Neverthe- l e s s , a high frequency discharge, using a 0.5 m m I.D. capillary and p r e s s u r e s of 0 . 3 - 0 . 5 m m Hg, allows determination of argon in con- centrations of a few tenths of one percent. The analytical line pairs used a r e Ar 6965 Ä—Kr 6905 A , Ar 7 0 6 7 - K r 6905 Â . In the concentration range of 0.3-0.1%, the calibration curves have slopes close to unity, while for concentrations ranging between 1-20%, the slopes are greater than 2 . * The e r r o r of a single d e - termination does not exceed 10%.
III. Determination of inert gases in molecular gases.
Determination of argon in nitrogen
F r i s c h and Konovalov [366] were the first to attempt the analysis of a nitrogen-argon mixture. They used a discharge tube with a hollow cathode (see Fig. 25b).
•The large slope is apparently due to the fact that the intensity of lines of the primary constituent also varies with the concentration of the minor component.
N2 £0 40 60 60 700Q%
Ar 80 60 40 20 Ο FIG. 73. Calibration curve for analyzing argon-nitrogen mix-
tures.
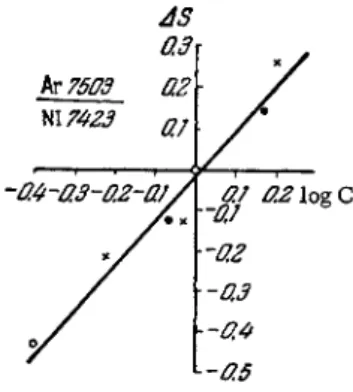
Traces of argon in nitrogen can also be detected if the mixture is excited in a high frequency discharge, using the positive column region. For high analytical sensitivity, it is necessary to use s m a l l - diameter capillaries (0.4 mm) and low p r e s s u r e s (0.2 m m Hg). In a s m a l l - b o r e capillary the nitrogen molecule dissociates into atoms, and a line spectrum is excited as a result. The calibration curve for argon concentrations in nitrogen ranging from 0.2 to 1.5% is A s we pointed out earlier (Section 4 ) , a tube with a hollow cathode tends to confine the entire glow region to the interior of the cathode, where both the bands of the molecular nitrogen and the spark lines of argon are excited simultaneously. Frish and Konovalov compared lines ArlU 4765 A and ArIΙλ 4736 A with a line in the band λ 4709 A. in the rotational structure of nitrogen.
The ratio of intensity of the nitrogen band to these argon lines was shown in special experiments to be practically independent of both the current and p r e s s u r e . Figure 73 shows the calibration curve for argon concentrations in nitrogen ranging from 2 to 96%.
The spectra were recorded at 0.65 m m Hg and 65 m A . The an- alytical sensitivity is very high at low concentrations, where the curve is steep, but it is not so high in the middle region where the slope is shallow. When using a hollow-cathode tube, one can d e - tect argon in nitrogen at concentrations of the order of 0.1%.
shown in Fig. 7 4 . For a single determination, the standard devia- tion is 6%. The intensity of the glow d e c r e a s e s sharply at low p r e s s u r e s . Thus, to increase the intensity of light falling upon the spectrograph slit, the discharge tube was not set up parallel to the slit, but was mounted at right angles to it (the end facing the slit). The tube end consisted of a flat quartz window, and a sharply enlarged image of the capillary was projected upon the slit. This permitted reduction of the exposure to 1/3 or 1 / 4 of what would have been otherwise necessary.
AS
kv75Q3 Nl 7423
FIG. 74. Calibration curve for determining argon (concentra- tions ranging from 0.2 to 1.5%)
in argon-nitrogen mixtures.
The nature of the glow produced by a high-frequency discharge is similar to the glow in a hollow cathode [ 3 6 7 ] . To observe this high frequency discharge we used a 12 m m diameter tube (Fig. 25a).
The spectra were photographed in the middle and lower portions of the tube (as indicated by the a r r o w s ) . When photographing the lower part of the tube, the light falling on the spectrograph came from the portion of the tube enclosed by the external electrode.
The spectra from the middle part differed markedly from those from the lower part of the tube. The former were identical with the normal positive column spectra, while the glow in the lower
section of the tube produced spectra similar to those obtained in hollow-cathode glow. Thus, in the c a s e of nitrogen, molecular spectra predominated in the middle, while atomic spectra were most frequent in the lower part. The high frequency 4'hollow cathode'* can be used in determining traces of a difficult-to-excite component in an easily excited primary constituent. Figure 75 shows the calibration curve for traces of argon in nitrogen. The curve was plotted at ρ - 6 · 10 ~2 m m Hg and i = 300 m A . The
4'hollow cathode' ' diameter was 12 m m . The slope of this calibra- tion curve is very s m a l l , but it is nevertheless convenient to work with a large-diameter tube.
Analysis of argon in air was described in [361, 3 6 6 , 382 and 4 1 5 ] . The results of these experiments are described in Section 2 5 .
Krypton determination in oxygen
The high frequency discharge is also suitable for this analysis.
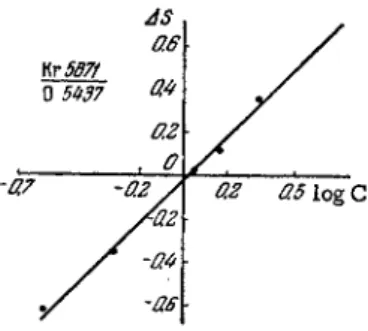
While developing methods for krypton determination in oxygen, we noticed that the first few photographs taken after the sample had been admitted to the discharge tube showed krypton lines of far greater intensity than any of the subsequent photographs. Thus, the differ- ence in optical density (blackening) AS for the analytical pair Κτλ 5870 Α - Ο Ι λ 5437 A in three consecutive photographs at 1.5% krypton
A3 Q4\
FIG. 75. Calibration curve for determin- ing traces of argon in argon-nitrogen
mixtures.
in oxygen was 0 . 2 8 , 0.11 and 0 . 1 2 , respectively. The respective values for 2.3% krypton in oxygen were 0 . 5 5 , 0 . 3 4 and 0 . 3 2 . The s e c - ond and third photographs gave results of excellent reproducibility, while the first photos yielded values with large scatter. It follows that s o m e time should be allowed to elapse after admission of the sample to the discharge tube before photography is started. In the above case the discharge should be maintained for not less than 5 min. An identical effect is observed in the analysis for low nitrogen concentrations in argon.
The calibration curve for determining traces of krypton in oxygen is shown in Fig. 76. The photographs were obtained at ρ = 0.60 m m Hg, i = 350 m A , capillary bore of 0.5 m m . The analysis was based on the atomic oxygen' line, since the emission spectrum of a neutral oxygen molecule is extremely difficult to obtain.
Helium determination in hydrogen
The limit of detection of helium in hydrogen in a high frequency discharge produced in a 0.5 m m I.D. capillary under a pressure of 1 m m Hg does not exceed 0.1%. Alongside the atomic hydrogen and helium lines, the spectrum shows a highly intense spectrum of the H2 molecule. A suitable pair of analytical lines is Ηβλ 4471 Α—Ηγ λ
αβ\
FIG. 76. Calibration curve for determining krypton concentra- tions in a krypton-oxygen mix-
ture.
4340 A. The slope of the calibration curve is flat over the low concentration section. The mean e r r o r of the analysis can be as high as 8%.
IV. Analyzing mixtures of two molecular gases
Emission spectra from a mixture of molecular gases produced by conventional light sources as a rule do not correspond at all to the composition of the sample. The electric discharge causes d i s - sociation of the majority of molecules into atoms or free radicals, with the result that even a single molecular gas will actually contain two components. Thus, the spectrum shows lines of atoms a s well as molecular bands corresponding to excited molecules or free radicals. In addition, the discharge may produce new compounds in the mixture; their spectra may then also appear [367, 4 2 5 ] .
All these factors greatly complicate the quantitative analysis of molecular gas mixtures by means of emission spectra. Thus, it is not possible to differentiate between CO and C 02, H20 and H2, to separate the individual gaseous hydrocarbons, etc. Nevertheless, aside from free radicals which may be present in the sample, e m i s - sion spectroscopy is capable of determining the components of a number of mixtures consisting of molecular gases with fairly high accuracy.
Determination of nitrogen in carbon dioxide
As an example, we shall discuss the analysis of a nitrogen-carbon dioxide mixture. Its high-frequency discharge spectrum will display N2, CO and CN bands. The CO is the result of dissociation of the C 02, while the CN is produced on reactions of CO with N*. An equi- librium is established a few minutes after the start of the discharge.
The nitrogen content in the carbon dioxide can be determined from both the nitrogen and the CN bands. Calibration curves are plotted from relative intensities of the molecular head band. The width of
the spectrograph slit must be kept strictly constant throughout the calibration and analysis, since the head band intensity is a function of this width (one records a group of overlapping lines in the rota- tional structure of the band).* Calibration curves for concentrations ranging from 0.5 to 25% are shown in Fig. 7 7 . The spectra were recorded at ρ = 3.5 m m Hg,** i - 350 m A , d = 5 m m , exposure 2 - 5 min [367]. An alternative illustration of analytical procedures used with mixtures of molecular gases is provided by the analysis of air samples taken near the ground (see Section 2 5 ) .
JS 02r
FIG. 77. Calibration curve for determining nitrogen in a nitrogen-carbon dioxide mixture.
24. QUANTITATIVE ANALYSIS OF MULTICOMPONENT MIXTURES
Analysis of multicomponent mixtures inevitably involves the ef- fect of the third and subsequent components. The third component effect is especially pronounced in cases where critical potentials of the minor constituents are lower than that of the primary component.
•It follows that in cases where the lines of the rotational structure are sufficiently intense for photometry, the analyst should use one of the components of the rotational structure rather than the head band.
**The pressure in this case was selected on the basis of incidental considerations.
A higher sensitivity of analysis could have been attained at greater pressures.
Such effects are also involved in analysis of alloys, ores and m i n - e r a l s , and were pointed out time and again by various researchers.
Spectral analysis of gases is usually m o r e affected by the third component factor than analysis of alloys and minerals which uses a spark or an arc discharge. In the case of gas samples, the third component effect may 1) alter the discharge conditions (i.e., produce an electron temperature drop) due to the presence of additional e l e - ments with low ionization potentials; 2) afford conditions conducive to chemical reactions in the discharge; 3) produce conditions favorable to collisions of the second kind.
Several methods have been developed for analyzing multicom- ponent mixtures. One such procedure, designed for analysis of ternary mixtures, may be used only when the line intensities are affected by only one of the components [371]. An example of this method is the case where helium is the primary component, while neon and argon, in concentrations ranging from 0.8 to 7%, are the minor constituents. The addition of neon does not appreciably alter the ratio of line intensities of argon and helium, whereas the addi- tion of argon causes a change in the corresponding ratio for helium and neon. This is because the critical potentials of helium and neon differ far l e s s than do the critical potentials of helium and argon, and thus the addition of neon to helium has little effect on the e l e c - tron temperature (this temperature is already sharply reduced by the presence of argon in the mixture).
In the actual analytical procedure, a calibration curve was established for determination of argon in helium (see Fig. 78a).
In constructing the curve, the absence of a neon effect on the ratio of line intensities of argon and helium was verified. The calibra- tion curve was plotted from photographed spectra taken under the following conditions: a high frequency discharge; ρ = 1.4 m m Hg;
i = 300 m A ; tube diameter = 5 m m . Next, the calibration curves
for neon in an argon-neon-helium mixture were plotted under the s a m e conditions but at varying argon concentrations (see Fig. 78b) [ 3 7 1 ] . Thus, the method boils down to the following: the argon concentration is determined from the first calibration curve, after which one knows which curve from the second family of graphs in Fig. 78b can be used to determine the concentration of neon.
FIG. 78. Calibration curves for determining argon (a) and neon (b) concentrations in argon-neon-helium.
The method of plotting a family of curves was also used to determine argon in air when argon and oxygen concentrations were variable [382] (see Section 2 5 ) . It was possible to analyze the mixture because changes in argon concentration did not affect the oxygen determination, and a change in oxygen concentration caused only a parallel displacement of the calibration curves for the argon- nitrogen mixture.
However, the third component effect does not always produce a m e r e parallel shift of the calibration curves: s o m e t i m e s , it also causes a change in the slope of the curves. Thus, Kr as nova and Schreyder observed such changes while developing an analytical
FIG. 7 9 . Calibration curves for determining nitrogen (a) and oxygen (b) in an oxygen-nitrogen-hydrogen mixture.
A s we stated earlier, this method for analyzing ternary m i x - tures has a limited application. In cases where both minor c o m - ponents affect each other, one should select another gas as the reference element. The line intensities of that gas should not vary with changes in concentration of the other components. Duf- fendack and Wolfe [381] used this technique in analyzing mixtures of nitrogen, carbon monoxide, hydrogen and oxygen. The discharge tube (a quartz capillary 3 m m I.D.) had internal nickel electrodes procedure for the determination of traces of oxygen and nitrogen in hydrogen. The discharge was excited by means of an h-f o s - cillator in a 5 m m capillary under a pressure of 1 m m Hg. The addition of oxygen (see Fig. 79a) did not shift the calibration curve for nitrogen in hydrogen. The addition of nitrogen, on the other hand, caused not only a shift of the calibration curves but also a change of slope (see Fig. 79b).
and the discharge current was 25 m A . T o reduce the adsorption of gas during the discharge, large amounts of helium were intro- duced (the helium pressure varied between 2 and 8 m m Hg in different experiments). Helium was used because it is adsorbed on the electrodes and walls of the tube to a l e s s e r extent than the other g a s e s , and its ionization potential is also higher. Hence, the addition of helium does not reduce the electron velocity. However, helium could not be used as an internal standard, since its line intensities vary sharply with the concentration of the other c o m - ponents. The best internal standard proved to be argon, which was used at partial pressures ranging from 0.01 to 0.07 m m Hg.
(Naturally, the immunity of the argon line to other components was prechecked.) The argon-helium mixture was admitted to the thor- oughly evacuated discharge tube through a trap cooled with liquid air.
The purity of the mixture was checked by photographic recording of the discharge. The first photographs displayed s o m e impurity lines, but a s the discharge continued these lines vanished.
To obtain a plot of the analytical c u r v e s , known quantities of hydrogen (partial p r e s s u r e s of 0.0001 to 0.0075 m m Hg), nitrogen (0.004 to 0.25 m m Hg), oxygen (0.002 to 0.12 m m Hg) and carbon monoxide (0.001 to 0.10 m m Hg) were introduced into the discharge tube. The calibration curve for small nitrogen concentrations in helium is shown in Fig. 8 0 . Similar curves were obtained for hydrogen, oxygen and carbon monoxide in helium.
To determine the composition of an unknown mixture, an a c - curately known quantity of the sample was introduced into the d i s - charge tube containing a helium-argon mixture (of the same c o m - position as used in plotting the calibration curve) and the spectrum was photographed. If the helium-argon spectrum showed no a d - ditional lines or if such lines were of low intensity, another portion of the unknown mixture was admitted the tube, and the
spectrum was rephotographed. The sequence was repeated until all the additional elements were determined from the calibration curves. The composition of the unknown mixture could then be determined using the known ratio of partial pressures of helium and the unknown sample.
FIG. 80. Calibration curve for deter- mination of low concentration of ni-
trogen in helium.
Helium dilution is also useful in microanalysis of air because such dilution circumvents the mutual interference of air c o m - ponents [419].
It would seem that if the primary component of a mixture is an inert gas with a high excitation potential and the minor c o m - ponents, which have lower excitation potentials, are present in relatively insignificant amounts, then the mutual interference of the components can be neglected, within the limits of experimental e r r o r . In this c a s e , the analysis of a multicomponent mixture involves, in effect, nothing m o r e than a simultaneous determination of several binary mixtures. The correctness of this hypothesis was confirmed by Bochkova and Chernysheva [384] in determining traces of nitrogen and hydrogen in helium. The mixtures were e x - cited by means of a high frequency discharge in a 1 - 1 . 5 m m I.D.
capillary, the hydrogen and nitrogen concentrations being in the 10~3 and 1 0_ 1 % range. The hydrogen was determined by means of
the Ηβλ 4861 A - HeX 5047 A line pair and the Ν2+λ 4278 A - Ηελ 5047 A pair was used for nitrogen. Line intensities were measured successively by means of an F E U - 1 7 photomultiplier installed in back of the exit slit of an ISP-51 spectrograph (see Appendixes ΠΙ and I V ) . The photomultiplier was powered by a stabilized rectifier, and the photocurrent was read off from a m i c r o a m m e t e r . The analytical procedure used three standards, with helium of spectral purity used in the preparation of standard mixtures. The residual nitrogen and hydrogen in helium was d e - termined by the method of additions. In preparing the calibration c u r v e s , the ratios of line intensity for hydrogen-helium and nitrogen-helium mixtures (proportional to the respective photo- current ratios) were plotted on the ordinate with the minor component concentrations on the abscissa. This procedure gave a s e r i e s of linear calibration plots at a given p r e s s u r e , each curve covering a range of minor component concentrations v a r y - ing by a factor of 1 0 . It was shown that if the nitrogen concentra- tion does not exceed 2 · 10"2%, this component does not affect the analysis of H2 in He.. When the nitrogen content is of the order of 0.1%, the e r r o r in determining hydrogen concentrations (in helium) of the order of 0.01% is within the limits of the a c - curacy of the procedure ( ~ 4 0 % ) . However, the e r r o r in deter- mining concentrations of the order of 0,001% hydrogen may be as high as 40-50%.
The limit of detection of hydrogen in helium i s l 0 ~3% ( a t a p r e s s u r e of 20 m m Hg). This limit is not, however, imposed by limitations of spectral analysis per s e , but by the hydrogen purity attained in the tube. The evolution of hydrogen and water vapor from the tube walls during discharge reduces the analytical sensitivity for traces of hydrogen, thus adversely affecting the accuracy of the method.
In testing for the effect of hydrogen on the determination of ni- trogen in a ternary helium-nitrogen-hydrogen mixture [384], it was found that the addiditon of 0.1% hydrogen to a helium-nitrogen m i x - ture has no effect on detection of nitrogen concentrations of the order of 0.01 to 0.1%. In the nitrogen concentration range of 1 0_ 2- 1 0 ~3% , hydrogen concentrations of the order of 10 ~2 % do not hinder the nitrogen detection. The limit of detection for nitrogen is 10~4%.
The percentages of nitrogen and hydrogen do not differ by m o r e than an order of magnitude, and therefore the mixture can be analyzed simultaneously for both components. Under industrial conditions the analysis is most conveniently carried out in a stream of g a s , using an arrangement of the type shown in Fig. 1 9 . The time r e - quired for simultaneous analysis for both components does not exceed 5 minutes.
In some instances the third component effect can be eliminated by a trick, as in analysis of the H e - N e - Ar-Kr and H e - N e - K r - X e mixtures [383]. The method resorted to was the familiar spectro- scopic technique of stabilizing the excitation conditions by intro- ducing known quantities of a component whose excitation potential is lower than that of any of the other components. This technique, while useful on many occasions, is not altogether advantageous since it lowers the sensitivity.
The problem of analyzing multicomponent gas mixtures has been successfully solved in many c a s e s . Some of these s u c c e s s e s were described in this section, and others will be discussed in Sections 25 and 2 6 .
2 5 . ANALYSIS OF AIR
Since air is a multicomponent gas mixture, its quantitative analysis is difficult. A i r consists of nitrogen and oxygen (basic constituents), as well as s o m e hydrogen, carbon dioxide, water
vapor and inert gases (total about 1%) of which argon is the most abundant (about 0.95%).
The composition of air near the ground is generally determined by chemical and physicochemical methods, which are fairly a c - curate in identifying the active components ( 02 ;, N2, H20 , H2 >C 02) . The chemical procedures a r e , however, not suitable for analyzing inert g a s e s . Fractional distillation with subsequent measurements of gas volumes is accurate only when relatively large gas samples are available [ 1 ] . The chemical and physicochemical methods become completely unsuitable for analyzing the composition of upper atmospheric a i r , a case where the samples a r e usually extremely s m a l l . In this c a s e , optical spectroscopy and m a s s - s p e c t r o m e t r y a r e the only available means of analysis.
Analysis of surface air. Determination of hydrogen and moisture in air
Hydrogen and water vapor in air are determined from the inten- sities of lines of atomic hydrogen (Balmer s e r i e s ) . These lines are produced in the discharge tube by atomic or molecular hydrogen, as well as water vapor. If the water is frozen out, then one can d e - termine the hydrogen content alone.
The direct analysis of hydrogen in air is capable of determining only concentrations not lower than ~ 1 % [ 3 7 0 , 4 0 3 ] . The limit of detection can be lowered by one order of magnitude by adding helium in quantities ranging from 10 to 50% of the sample [ 4 2 6 ] .
Microspectroscopic analysis of traces of moisture in air at reduced and at normal p r e s s u r e s was described by Garger [ 4 2 7 ] . The spectrum was excitated in a glow discharge produced in a F r i s c h all-purpose tube, using an induction coil generating 1 0 - 3 0 kV when combined with the Swenticki arc activator [315]. A condenser discharge can also be used, according to Garger. The discharge tube was filled with a mixture of air and water vapor. The partial pressure of the water was determined by measuring the temperature