1
Synthesis and characterization of multiwall carbon nanotube reinforced yttria stabilized zirconia
composites
Soukaina Lamnini
Ph. D. dissertation Supervisors:
Dr. Csaba Balázsi Dr. Katalin Balázsi
Budapest, 2020 Doctoral School of Materials
science and technology Óbuda University
Thin Film Physics Department
Institute of Technical Physics and Materials Science Centre for Energy Research
2
Acknowledgement
This work was performed with the support of numerous people i want to acknowledge hereby:
First and foremost, I would like to express my deepest gratitude to my dear supervisors: Dr.
Katalin Balázsi, Head of Thin Film Physics Department, and Dr. Csaba Balázsi, Scientific advisor in the Centre for Energy Research, for welcoming me in their laboratory and awarding me the great opportunity to work under their supervision. I greatly appreciate the freedom you have always given me to find my own path and the support you offered me when needed.
Thanks for your precious help, advices in attaining the established objectives, as well as for the fruitful discussions during my PhD work.
Many thanks goes to Dr. Judit Borsa, from the Doctoral School of Material Science and Technologies at Óbuda University for her remarkable kindness, human qualities and for facilitating all difficulties related to administrative works during my PhD studies.
I am thankful to the Director General of EK, Dr. Ákos Horváth and Director of MFA, Dr.
Béla Pécz for all the opportunities and support through these years.
My thanks also go to Viktor Varga, Andor Kovács, Tamás Zagyva, Levente Illés, Dr. Sára Tóth, Dr. Eszter Bódis, Dr. Zsolt Horváth Endre, Dr. Zoltán Károly, Dr. Zsolt Fogarassy and Dr. Radnóczi György Zoltán, for their valuable collaboration and technical assistance to perform the different characterization analysis and measurements.
I would further like to thank my pervious professors, Pr. Mohamed Regragui and Pr. Jamal Sebbani from University Mohammed V-Morocco, whom have taught me a lot in science which allowed me to develop myself as a researcher in the best possible way.
Finally, I am grateful to Ministry of Education and Culture of Hungary (Tempus Public Foundation) for the financial support.
3
Dedications
I dedicate this dissertation to my dear father and beloved mother who have always supported and encouraged me.
I undoubtedly could not have done this without you.
To my dear brothers and whole family members for all the blessed and cheerful moments we have spent together.
To my dear and lovely nephew Mohamed Majd.
To all my dear friends and all peoples who know me.
4
Table of Content
List of Acronymes... 7
1. INTRODUCTION ... 7
2. LITERATURE OVERVIEW ... 8
2.1 Ceramic Matrix Composites... 8
2.2 Zirconia based ceramics ... 11
2.2.1. Phase diagram of zirconia... 12
2.2.2 Transformation toughening zirconia ... 13
2.2.3. Ionic conductivity of yttria stabilized zirconia (YSZ) ... 15
2.3 Carbon nanotubes (CNT) ... 16
2.3.1 Synthesis of CNTs ... 19
2.4. Powders processing techniques ... 21
2.4.1 Dispersion of MWCNT into YSZ matrix using ball milling technique ... 21
2.4.2 Spark plasma sintering (SPS) ... 23
2.5 Mechanical behaviour of ceramic matrix composites (CMC) ... 27
2.5.1 Stress strain-curves of pure ceramics via CMC ... 27
2.5.2 Ceramic matrix composites: challenges ... 29
2.5.3 Fracture toughness of ceramic composites ... 30
2.5.4 Hardness of ceramic composites ... 30
2.5.5 Indentation fracture toughness of ceramic composites ... 32
2.5.6 Vickers indentation fracture toughness of ceramic composites ... 34
2.6 Tribological properties of ceramic matrix composites ... 36
2.7 Application of yttria stabilized zirconia in energy sector ... 38
2.8. Aim of PhD work ... 42
3. MATERIALS and EXPERIMENTS ... 44
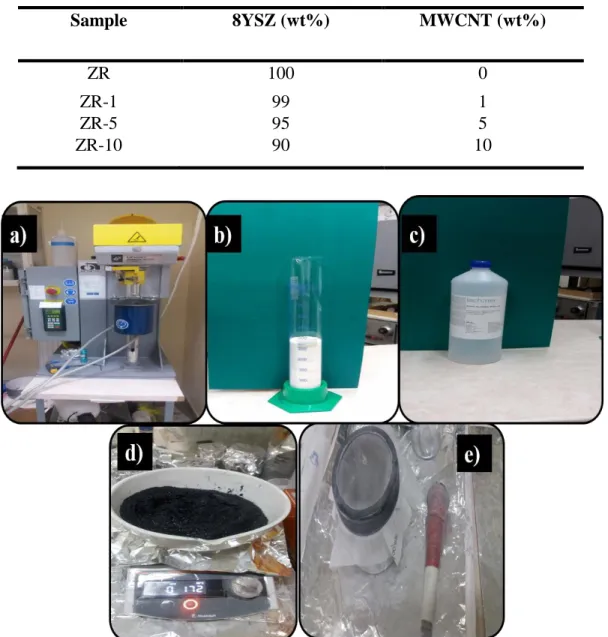
3.1 Materials ... 44
3.2 Powder milling and sintering ... 45
3.3 Microstructural analysis, density and porosity measurements ... 48
3.4 Mechanical and tribological testing methods ... 49
3.4.1 Vickers hardness and indentation fracture toughness ... 49
5
3.4.2 Bending strength ... 50
3.4.3 Wear test ... 52
3.5. Structural characterization of samples ... 53
3.5.1 Scanning electron microscopy ... 53
3.5.2 Transmission electron microscopy ... 55
3.5.3 Digital microscopy ... 56
3.6. Phase analysis of samples ... 57
3.6.1 X-Ray Diffraction ... 57
3.6.2 Raman spectroscopy ... 59
4. RESULTS ... 60
4.1 Structural properties of the milled 8YSZ / MWCNTs powders... 60
4.1.1 Structural study of the as-received 8YSZ powder before and after milling ... 60
4.1.2 Structural analysis of 8YSZ reinforced MWCNT powder after milling process .... 62
4.1.3 Phase analysis of 8YSZ / MWCNTs milled powders ... 66
4.2 Structural properties of the milled and sintered 8YSZ / MWCNTs composites ... 68
4.2.1. Density and microstructure of the sintered 8YSZ / MWCNTs composites ... 68
4.2.2. Phase analyses of 8YSZ / MWCNTs sintered composites ... 71
4.2.3. Stability of MWCNTs in 8YSZ sintered composites ... 72
4.2.4 Conclusion ... 74
4.3. Mechanical properties of the sintered 8YSZ / MWCNTs composites ... 76
4.3.1. Crack propagation modes and toughening mechanisms in the sintered 8YSZ/MWCNTs composites ... 76
4.3.2 Vickers hardness and indentation fracture toughness measurements of the sintered 8YSZ / MWCNTs composites ... 79
4.3.3 Microstructure and fractographic test of the sintered 8YSZ / MWCNTs composites ... 81
4.3.4 Conclusion ... 85
4.4 Wear mechanism of sintered MWCNTs reinforced zirconia composites under dry sliding conditions ... 86
4.4.1. Average friction coefficient and wear rate ... 86
4.4.2 Wear (W) damage mechanism ... 89
4.4.3 Elemental composition of wear track in 8YSZ / MWCNT composites ... 94
4.4.4 Conclusion ... 97
5. GENERAL CONCLUSION ... 98
6
6. THESIS ... 99
7. PUBLICATIONS ... 101
7.1 Publications related to the thesis ... 101
7.2 Other publications... 101
7.3 Conferences ... 101
8. REFERENCES ... 103
7
List of Acronyms
8YSZ 8 mol % yttria-stabilized zirconia
CNB Chevron notched beam
CNFs carbon nanofiber
CNPs graphene nanoplatelets CTE thermal expansion coefficient CVD chemical vapor deposition EDS energy-dispersive spectroscopy
FCC face centred cubic
FSZ fully stabilized zirconia IFT indentation fracture toughness MWCNTs multiwall carbon nanotubes PSZ partially stabilized zirconia
Ra average arithmetic roughness
RGO reduced graphene oxide
SEM scanning electron microscopy SENB single edge notched beam SEVNB single edge V-notched beam SOFC solid oxide fuel cells
SPS spark plasma sintering SWCNTs single wall carbon nanotubes TBCs thermal barrier coatings
TEM transmission electron microscopy
TPB triple phase boundary
TZP tetragonal zirconia polycrystal
VIFT Vickers indentation fracture toughness
vol.% volume percentage
wt.%
XRD
weight percentage X-ray diffraction
1. INTRODUCTION
8
Zirconia (ZrO2) based composites are one of the most promising ceramic materials with possible applications in diver fields related to energy sector (in solid oxide fuel cells, oxygen sensors, ceramic membrane oxygen separation technology i.e.) or in the field of tribology and mechanical engineering (cutting tools, bearings, nozzle, brakes, i.e.).
Nowadays, MWCNT reinforced ZrO2 composites are attracting growing interest, thanks to their ability of crack self-healing and the possibility to tailor the desired nanostructured properties. However, although the expansive interest in the research and development of ceramic composites with nano-fillers, only a very few new technologies and novel processing techniques have been discovered and properly implemented. Further, the clear understanding of the wear response and tribological features such as wear mechanism, friction and wear rates evaluation has been not yet achieved or well documented in the literature.
Therefore, to get a deep insight into their behaviour and to completely benefit from their outstanding properties a deep understanding of the material’s behaviour across length scales is required. Principally, the relationship between composition and preparation, and the composite’s microstructure and its mechanical and tribological properties should be thoroughly investigated.
2. LITERATURE OVERVIEW
2.1 Ceramic Matrix Composites
Due to their great potential and unique properties, ceramic matrix composites (CMCs) afford a new generation of technical applications with excellent efficiency. Typical applications are designed to withstand severe environment and to increase the worldwide clean energy demand. In fact, CMCs are extensively used for electrical energy generation either as an electrochemical power devices or as a thermal barrier coating in engines. In addition, CMCs are known to be robust, lightweight and highly wear resistant, which make them a proper material in automotive applications (oxygen sensors, brake systems), aerospace engineering (hot structures) and remarkable tribological applications [1–3] .
9
Ceramics and their composites have shown a great advance in most of tribological applications and have replaced metals and conventional materials such as grey cast iron or carbon/carbon composites used in the fabrication of brake systems. High wear resistance allied with a low friction coefficient are desirable for reducing the losses in moving of the rotating parts and increasing the lifetime of the components respectively. A wide range of factors influence the wear properties of ceramic composites namely applied load, sliding speed, time of contact, temperature, lubrication and surface characteristics such as: composition and
roughness.
Further, advanced ceramic composites are attractive because of their prominent properties namely: low density, chemical inertness, high stiffness, high strength, high hardness, and high-temperature stability [4,5]. However, although CMCs possess various interesting properties, they often present a brittle behaviour at the monolithic state, which constitutes a major issue [6]. To overcome this issue, several attempts have been developed to improve the fracture behaviour of CMCs and maintain all the other advantages of the monolithic ceramics. CMCs are produced from at least one nanophase embedded in a ceramic matrix as illustrated in Fig. 2.1 [7]. The nanophase can be one of the ceramic nanoparticles (SiC, Si3N4), nanotubes (carbon nanotubes (CNTs)), nanoplatelets (graphene) or hybrids of these materials.
Fig. 2.1. Schematic of CMC classifications, the orange background represents the matrix and the front colours indicate reinforcing materials [7].
10
Niihara et al. were the pioneers who introduced the concept of ceramic nanocomposites in 1991 [4,8,9]. Their work consisted on SiC nanoparticles incorporation as a second phase into (Al2O3, Si3N4, MgO) ceramic matrix. After reporting significant improvement, a series of research works have been succeeded with different nanoparticles including SiC, Si3N4, TiN, TiC, TiO2, ZrO2, Cr3C2b in various ceramic matrix, such as Al2O3, Si3N4, MgO, SiAlON, etc…).
With the introduction of nanotechnology, reinforcing ceramic matrix with CNT has gained much interest after its discovery by Iijima [10]. Thanks to their one-dimensional nanostructure, CNTs provides incredible mechanical, electrical (107 S/m) and thermal properties (1800–6000 W/mK) compared to nanoparticles [11].
Hence, CNT incorporation not only increased ceramic matrix toughness but also have added the advantage of improving their functional properties namely electrical and thermal properties.
In order to produce CMC / CNTs composites with improved mechanical and functional properties, appropriate interfacial bonding between ceramic matrix and CNTs, besides uniform CNTs dispersion along the grain boundaries is required.
However, due to their high aspect ratio, CNTs tend to agglomerate leading to stress concentration and thereby the overall properties of the composites are reduced. The preparation process and choosing the appropriate sintering technique, play an important role to define the final mechanical as well as tribological and functional properties of the composites [4,8].
YSZ nanocomposite is one representant of CMCs, which own an important interest during the last decades among all ceramic nanocomposite materials. In fact, YSZ nanocomposites are widely employed as a structural materials or functional materials as oxygen ion carriers mainly in power generation and environment protection. Besides its high thermal stability at high temperatures and proper mechanical properties, YSZ possess the advantage to present phase transformation from tetragonal to the monoclinic under applied stress, this mechanism is usually referred as transformation toughening zirconia. The resultant strain that is associated with the transformation relieves the stress field and therefore increases the intrinsic toughness [9].
11
2.2 Zirconia based ceramics
Zirconium dioxide (ZrO2) named also zirconia is the mineral of baddeleyite and chemically is inert. In its pure form zirconia (ZrO2) exhibits a polymorphic configuration and exists in three distinct phases at ambient pressure. Monoclinic phase is stable at room temperature to 1170 °C.
Tetragonal with distorted fluorite structure is stable at intermediate temperature between 1170 °C and 2370 °C while the cubic fluorite phase is stable at very high temperature from 2370 °C to its melting point (2750 °C)[12,13]. The crystal structures of these three zirconia phases are presented in Fig. 2.2, where the large red spheres correspond to oxygen and the small green ones refers to zirconium. The higher the temperature, the better is the symmetry. The ability of phase transition makes zirconia the most studied ceramics material over the last decades and an important candidate for diverse areas of structural applications [14].
Fig. 2.2. Crystal cell of pure zirconia phases [15] (Red – oxygen, green – zirconium).
The structure of the cubic zirconia can be represented by a face centered cubic (FCC) structure similar to fluorite. The eight oxygen ions occupy the tetrahedral (0:25, 0:25, 0:25) sites, and are surrounded by Zr4+ cations which occupy the summits of the cube and the centers of each faces (Fig. 2.2a). Tetragonal phase of zirconia is represented by a straight prism with rectangular sides (Fig. 2.2b). Similarly, to the cubic structure zirconium (Zr) ions are coordinated to eight oxygen atoms and the oxygen atoms are coordinated to four Zr ions. However, the distorted shape of the tetragonal phase is linked with the alternative oxygen ions displacement along the c-axis.
Resulting in the formation of two tetrahedron planes where one is elongated and rotated by 90°
due to different distance of each four oxygen ions from Zr4+ (2.065Å and 2.455Å respectively)[16].
12
In its natural form, zirconia exhibits the monoclinic phase at low temperature known as baddeleyite. Its contains about 2% of HfO2 (hafnium oxide) having high chemical and structural similarity to zirconia. In the monoclinic phase, Zr4+ ions are coordinated to seven oxygen ions residing in tetrahedral interstices (Fig. 2.2c). The Zr ions are coordinated to three and four oxygen at an average distance of 2.07 Å and 2.21 Å respectively. Therefore, one of the angles (134.3°) differs considerably from the tetrahedral value (109.5°) [17].
2.2.1. Phase diagram of zirconia
Processing pure ZrO2 is quite critical due to its polymorphic configuration. Indeed, during cooling, phase transformation from tetragonal to monoclinic occurs at temperature between 850 and 1000 °C. Consequently, a large volume expansion (5~7 vol%) is released which promotes the risk of brittle failure or generation of cracks and flaws within the ceramic matrix [18].
Therefore, the manufacturing of pure zirconia is not useful due to the impulsive failure. To retain the tetragonal form to room temperature after sintering, typical oxide dopants are added to pure zirconia, such as: yttria (Y2O3), calcium oxide (CaO) and ceria (CeO2). However, yttria is the most common stabilizing oxide employed since lower amount are needed [19]. The phase diagram of ZrO2 /Y2O3 presented in Fig. 2.3 illustrates the stability regions of different phases according to the amount of yttria added to stabilize pure zirconia. It’s shown that the reverse phase transition from monoclinic to tetragonal occurring at approximately 1170 °C decreased to <600°C with the addition of ~ 4.8 mol% yttria. The coexistence of a multiphase structure (cubic + tetragonal, cubic + monoclinic, cubic and tetragonal + monoclinic) is seen in the solid solution regions separated by the single phases. Hence, partially stabilized zirconia (PSZ) with cubic and tetragonal structures as major phase and monolithic precipitated in small amounts is produced [20]. These materials are stable at temperatures between 600 °C and 2000 °C with yttria content in the range of 3-8 mol%
and manifest exceptional resistance to high thermal shock [17,21].
13
Furthermore, retaining the tetragonal phase at room temperature in tetragonal zirconia polycrystals (TZP) formed by single phase metastable structure or fully stabilized zirconia (FSZ) with full cubic structure, stable at high temperature with higher yttria content (approximately +8 mol %) are the most useful state of zirconia [21]. Some studies claimed that the presence of small carbon fraction into cubic zirconia composite may boost its stability at room temperature [23]. In fact, TZP materials exhibit good comprehensive mechanical properties at both room and high temperatures, mainly attributed to the ferroelastic toughening mechanism, while FSZ are generally employed in electrochemical applications due to their high ionic conductivity [24,25].
2.2.2 Transformation toughening zirconia
The concept of stress-induced transformation from tetragonal to monoclinic is mostly occurred in TZP and PSZ ceramics, where the tetragonal phase is in its metastable state at room temperature. This concept based on change in grain shape accompanied with volume increase has been discovered at the first time in mid 1970s by Garvie et al. and led to considerable fracture toughness enhancement of zirconia composites as pointed out earlier [21]. This mechanism is known as transformation toughening zirconia and involves microcracked process zone at the crack
Fig. 2.3. Phase diagram of ZrO2-Y2O3 system [22].
14
tip, as shown schematically in Fig. 2.4. As result of crack propagation, a stress field is procreated around the crack tip and contributes in phase transformation of the surrounded particles that occurs at a speed close to the speed of sound propagation in solids [17]. This phenomenon led in turn to the formation of transformed process zone constrained by the neighbour particles of a matrix.
Fig. 2.4. Schematic view of transformation toughening process [26].
Indeed, the surrounding untransformed particles opposes to the dilated transformed zone and presses back with residual stresses that causes the generation of closure forces from each side of the crack tip and hence, retard crack extension. The transformation is called stress induced because an external applied stress is performed to help preceding the transformation due to matrix stretching. According to Wolten, phase transformation from tetragonal to monoclinic in zirconia is martensitic of nature similar to martensite transformation in quenched steels that is used to increase their hardness by particular heat treatments [27].
In ceramic, martensitic transformation occurs between the parent tetragonal phase and the product through nucleation and structural growth. This transformation is generally adiabatic, a thermal and involves the atomic motion over distances less than an interatomic spacing, resulting in microscopic changes of shape of the transformed regions, which is associated with transformation toughening [28–31]. Furthermore, transformation toughening in partially stabilized zirconia is critically constrained by the particle size, which should be ranged in between 0.2 µm and 1 μm for 2 mol% to 3 mol%, yttria concentrations; otherwise the transformation to the monoclinic phase can be inhibited [32,33].
15
2.2.3. Ionic conductivity of yttria stabilized zirconia (YSZ)
Fully stabilized zirconia (FSZ) with cubic fluorite structure is commonly known as a solid electrolyte that possesses high oxygen ionic conductivity extended to wide ranges of temperature and oxygen partial pressure, and it is extensively employed as an oxygen sensor to control the emissions of automotive systems, combustion control for furnaces and engines, solid electrolyte for high-temperature fuel cells and hydrogen production. The dopant trivalent cations require a minimum activation energy. The cubic fluorite structure of zirconia becomes stable at room temperature with high Y2O3 addition and present high ionic conductivity at high temperatures [34–
36]. The doping of ZrO2 with Y2O3, the Y3+ cations replace Zr4+ cations as shown in Fig. 2.5. This fact induces the formation of oxygen vacancies that maintain charge neutrality in the lattice.
Fig. 2.5. Schematic structure of YSZ cubic fluorite [37].
Two types of interactions are established by the oxygen vacancies in the lattice. Repulsion with themselves and attraction toward the acceptor (Y3+cations). Since yttria has one less valence electron than zirconium, one oxygen vacancy is created for two substituted Y3+cations.
Consequently, the oxygen ions are free to move from vacancy to vacancy in the lattice thereby, increasing the ionic conductivity of zirconia. The corresponding reaction in Kroger-Vink notation is described as follow [34]:
Y2O3ZrO→ 2Y2 Zr,+ VO,,+ 3OOX (2.1) The maximum ionic conductivity is reached when doping zirconia with 8 to 9 mol% Y2O3. However, higher doping rates will result in reduced mobility of the oxygen vacancies and the
16
creation of complexes with positive effective charge due to the bonding between an oxygen vacancy and one cation according the following notation [35].
YZr,+ VO,, ↔ (YZr,VO,,), (2.2)
The mobility of oxygen vacancies diminishes sharply with higher yttria concentrations, since one oxygen vacancy is bonded to two cations, leading to the formation of clusters and more complex associations as shown by the following Eq. 2.3 [36].
2YZr,+ VO,, ↔ (YZr,VO,,YZr, )X (2.3)
2.3 Carbon nanotubes (CNT)
The discovery of carbon in the form of graphite has been achieved in 1779, followed by diamond after 10 years later. These two enormous discoveries in the field of nanotechnology generally and carbon structure specifically, stimulates researchers worldwide to increase their interest in finding other forms of carbon more stable and structurally ordered. In 1985, a new form of carbon known as fullerenes has been accidentally discovered by Kroto, Smalley and Curl (Nobel prize in chemistry in 1996) [11]. The structure of fullerenes is almost similar to a single sheet of graphite (graphene) with a planar honeycomb lattice, in which each atom is attached to three neighbouring atoms (hexagonal rings) via a strong chemical bond. However, fullerenes sheet is practically not planar as graphene, which is linked to existence of additional pentagonal or sometimes heptagonal rings.
A few years later, in 1991 the Japanese scientist Iijima [10] discovered multiwall carbon nanotubes (MWCNTs) with an outer diameter ranged from 3 nm to 30 nm and at least two layers.
Later in 1993, he discovered a new class of CNT with single wall carbon nanotubes (SWCNTs).
SWCNTs tend to be curved rather than straight with a typical diameter in between 1–2 nm. The different types of CNTs are presented in Fig. 2.6. Carbon nanotubes (CNTs) are cylindrical fullerenes with nanometric diameter and micrometer sized length, which lead to a high length to diameter ratio exceeding 107. Carbon nanotubes align themselves into chains by van der Waals forces, where the carbon atoms are sp2 bonded with length of approximately 0.144 nm. In
17
MWCNTs the interlayer distance between two successive CNT is similar to the interspaces between two successive graphene layers in graphite about 3.4 A˚.
Fig. 2.6. Schematic diagrams showing different types of CNTs: single wall CNT and multiwall CNT (MWCNT)[38].
Since their discovery, MWCNTs open an incredible range of promising applications in nanocomposites, nano-electronics, medicine, energy and construction. Indeed, CNTs led to novel and unique properties, namely very high tensile (≈100 GPa) and Young’s modulus (≈1500 GPa), high thermal conductivity and chemical stability and excellent electrical conductivity similar to silver and platinum [11, 40, 41].
Several carbon nanotubes structures can be produced depending on graphene sheet orientation on the rolling. The tremendous ways to roll fullerene into cylinders are specified by chiral vector 𝑐⃗⃗⃗ determined by two integers (n, m) and chiral angle (𝜃) located between the chiral ℎ vector and zig-zag nanotube axis as shown in Fig. 2.6 and can be described in Eq. 2.4 and 2.5.
ch
⃗⃗⃗ = na⃗ 1+ ma⃗⃗⃗⃗ 2 (2.4)
θ = tan−1(m√3)/(m + 2n) (2.5)
where, a1 and a2 are the unit cell vectors of the two-dimensional lattice formed by the graphene sheets.
As the chiral vector C is perpendicular to CNT axis, its length forms the CNT circumference and can be calculated according to Eq. 2.6.
18 ch
⃗⃗⃗ = |C| = a√n2+ nm + m2 (2.6)
The length a is calculated based on the length of carbon–carbon bond acc generally approximated to 0.144 nm for graphene sheet as given by the following relation:
a = |a1| = |a2| = acc√3 (2.7) The diameter can be deduced from the chiral vector c length as follow:
d = c/π (2.8)
Fig. 2.7. Schematic diagram showing chiral vector and angle used to define CNT structure on hexagonal sheet of graphene [40].
CNTs can be classified either as armchair, zig-zag or chiral tube according to the pair of integers (n, m) in the chiral vector relation (Fig. 2.7). In armchair and zig-zag carbon nanotube the structure follows mirror symmetry in both axes (longitudinal and transverse) due to the arrangement of hexagons around the circumference. Whereas, the chiral carbon tube is characterized by non-symmetric structure and therefore, the mirror symmetry is not realized. These three different structures and enrolment of graphene sheet to form carbon nanotubes are shown in Fig. 2.8. Furthermore, the values of the integers (n, m) influence the optical, mechanical and the electronic properties of CNTs. CNTs are considered as semiconductors when |𝑛 − 𝑚| = 3𝑖 ± 1 and metallic when|𝑛 − 𝑚| = 3𝑖[11,40].
19
Fig. 2.8. CNT structure based on the chirality. The structure of CNT is easily determined by the terminations so called caps or end caps. (A) armchair structure, (B) zig-zag structure, (C)
chiral structure [11].
2.3.1 Synthesis of CNTs
There are diverse synthetic routes to produce carbon nanotubes in which the quality depends on the preparation method. High-temperature evaporation methods such as arc discharge or pulsed laser deposition (PLD) yield to considerably manufacture low defect CNTs with high mechanical properties. However, these methods require a lot of purification from unwanted carbonaceous impurities and are generally operating at the gram scale, hence drive a quite expensive process.
Nevertheless, scientists are researching more economical ways to produce CNT without complicated purification steps and easy to scale up. Chemical vapour deposition (CVD) or catalytic growth processes operate at lower temperatures and enables high CNT purity with controllable orientation and density. This method favourites large scale production for composite manufacture, both in academia and in industry and satisfy the low cost production. However, CNT produced by CVD usually present a lack of prefect structure which often degrades the intrinsic properties. Hence, the diverse synthetic routes should be taken into account when interpreting the CNTs performance in a given application [41].
Carbon nanotubes were initially detected in 1991 during an arc discharge which was planned to produce fullerenes (Fig. 2.9a). This technique is quite simples and involves DC arc discharge between two graphite electrodes under a current of 100 A, in inert atmosphere with or without catalyst. At high temperature (3000 °C or 4000 °C), carbon particle sublimates then self-assemble at the negative electrode or the walls of the chamber (Fig. 2.9a). Pure graphite electrodes allows
20
the synthetization of MWCNTs while SWCNTs requires a mixture of graphite and metal catalyst such as: Y, Mo, Fe, Co, Ni[10, 41]. The first growth of SWCNTs dates back to 1995 at Rice University, where SWCNTs with about (5–20 µm) in length and from 1 to 2 nm in diameter has been synthesized using PLD. In this method, carbon atoms are vaporized from a graphite pellet containing nickel or cobalt as catalyst material under laser beam (Fig. 2.9b). This process is maintained at high temperatures (about 1200 °C) under constant flow of inert gases. Generally, this technique is considered as an excellent method to synthesize SWCNTs with high purity and controllable size[42].
a) b)
c)
Fig. 2.9. Schematic illustration of the techniques used to synthesis carbon nanotube, a) arc discharge, b) pulsed laser deposition (PLD), c) chemical vapor deposition (CVD) [39,42].
21
On the other hand, in CVD the carbon source contains hydrocarbons such as acetylene, ethylene or ethanol, while the metal catalyst particles are usually cobalt, nickel, iron or a combination of these such as cobalt/iron or cobalt/ molybdenum (Fig. 2.9c). The catalyst tends to decompose the carbon from the gas in the presence of plasma irradiation or heat (600–1200 °C) and to assess the nucleation of CNTs. consequently, the free carbon atoms recombine in the form of CNTs on the substrates (commonly used are Ni, Si, SiO2, Cu, Cu/Ti/Si, stainless steel or glass) [39].
2.4. Powders processing techniques
2.4.1 Dispersion of MWCNT into YSZ matrix using ball milling technique
Powder metallurgy techniques including ball milling method are considered as a major tool to produce homogeneous and uniform dispersion of advanced ceramic powders and their composites. Particle agglomeration prevention, homogeneous and uniform dispersion of MWCNT into structural ceramics matrix, presents a crucial challenge during the mixing process.
In fact, the powder mixture features influence largely the final composite’s properties such as:
strength, density, wear resistance, friction …). Ball milling synthesis for ceramic matrix/
MWCNTs powder is the most popular approach due to its simplicity and energy efficiency that promote high grain refinement and particular phase homogenization. High milling energies are essential to break the interlayer Van der Waal’s forces between carbon surfaces that cause agglomeration and led to high MWCNTs surface energy. High rotational speed of the ball milling devices enables the balls to strike with the walls of the jar where high-energy collision arises [43]. The ceramic crystalline lattice undergoes severe mechanical deformation (fractures) and stress concentration (Fig. 2.10). The combined powders are reached after further milling time of grinding balls the combined powders tend to decrease until they are able to sustain deformation without any fracture. As the milling time increases, powder refinement takes place resulting in significant reduction of the particles size. Ball milling using liquid media proved higher efficiency in inhibiting agglomeration compared to dry media, as reported by several studies.
22
Fig. 2.10. Schematic illustration of the plastic deformation, fracture and welding of powder between the balls. The black arrow shows the repetition of the three processes.
On the other hand, powder contamination can be an issue with ball milling. This is why a protective atmosphere and ceramic milling jars and balls are recommended when milling hard ceramic particles. A good example of ceramic milling jars and ball is tungsten carbide which demonstrated almost no contamination in the final powders [43, 44]. Decker et al. examined the influence of high-energy ball milling on Mg-PSZ-reinforced TRIP steel matrix composites at different rotational speed of 100 rpm and 250 rpm [45]. It was found that at the rate of 250 rpm intensive deformation of the steel powder and mechanical interlocking between the steel and ceramic powder have been occurred, while the milling process at 100 rpm resulted in a homogeneous distribution without significant powder particles deformation. It was suggested to further increase the milling time for better distribution of the Mg-PSZ particles. In another work [46] performed by Konga et al., a successful synthetization of nanosized Lead lanthanum zirconate titanate (PLZT) powders using high-energy ball milling and raw oxides as starting materials has been experimented. The PLZT powders with different dopant concentration exhibited a va ri et y o f f e r r o i c phas es s u ch as f e r ro e l ec t ri c (FE), antiferroelectric (AFE) and paraelectric (PE) phases and indicated superior sintering behaviour than those prepared via the conventional solid- state reaction process. Further, Liu et al synthetized and studied graphene platelet / zirconia- toughened alumina (GPL/ZTA) composites [47]. GPL–ZrO2–Al2O3 powders were obtained by mixing graphene platelets and alumina powders using high energy ball milling and yttria stabilized ZrO2 balls at 300 rpm. It was proved that the ball milling process provides the positive thermodynamic driving force to reverse martensitic transformation i.e. monoclinic to tetragonal
23
transformation, which provokes a cracking phenomenon during the cooling stage. Moreover, after 10 h milling the composite powder was nanostructured with grain size range of 35–60 nm and 25–
54 nm for alumina and zirconia, respectively.
2.4.2 Spark plasma sintering (SPS)
Spark plasma sintering (SPS) is a powder metallurgy process enabling the rapid synthetization of wide range of advanced materials with small grain sizes and at relatively low temperatures. SPS uses high pulsating DC current to heat directly the specimens simultaneous with application of uniaxial pressure to consolidate powders into a bulk material [48,49]. The first SPS machine based on pulsed current was developed by Inoue et al. in the early 1960s [50].
Their invention was based on the idea of sintering under an electric current patented firstly in 1906. However, reaching high efficiency with reasonable equipment cost was a critical point that limited its wider commercialization [51]. The advantages of SPS process over other traditional sintering methods such as hot-pressing and hot-isostatic pressing are the ability to consolidate high temperature ceramics, metals and composites in a few minutes with 1000
°C/min heating rate, resulting in reduced duration and energy costs [48, 51], high thermal efficiency due the absence of any heating elements. SPS heats by passing a high- pulsed direct current through a graphite die and the sample to be sintered. Typical SPS configuration [52] is illustrated in Fig. 2.11. The powder is inserted into a conductive graphite die in a water cooled SPS chamber. During the sintering a uniaxial pressure is applied to the die by an upper and a lower punch. Then, a pulsated current is directed through the punch and the die for thermal heating under vacuum or protective gas evacuated and filled trough the water cooled chamber.
Sintering temperature can be adjusted to high value 2400 °C using either thermocouples or axial/radial pyrometers. SPS process enable uniform Joule heating conditions especially for conducting sample. Further, the current enhance largely the mass transport mechanism through electro-migration, which contributes to obtaining dense samples with finer grain structures despite the low sintering times and temperatures [53–55]. Furthermore, high mechanical pressure in the range of 50 - 250 kN can be applied to enhance the densification by increasing the contact between grains and breaking-down the agglomeration, especially for large particles [49].
24
Fig. 2.11. A typical SPS chamber setup.
In fact, considerable improvement of particle rearrangement can be obtained with uniaxial pressure due to superplastic flow generation via grain boundary sliding. In this context, Anselimi- Tamburini et al. elucidated the pressure effect on the densified specimens based on the driving force for initial densification [53]. According to Eq. 2.9 the driving force for densification increase proportionally with the applied pressure [56].
Driving force = γ +P × r π
(2.9) where: γ is the surface energy, P is the applied pressure and r is the particle radius.
However, based on experimental demonstration Skandan et al. proved that beneficial pressure effect on the densification occurs only if the pressure effect exceeds that of the surface energy [57]. In other words, the small are the particles the high is the pressure required to enhance densification. The effect of temperature and pressure on the grain size of zirconia samples sintered with SPS technique is presented in Fig. 2.12. It is shown that applying high pressure simultaneously with low temperature is efficient to produce grains with minimal size. Hence the optimization of pressure and temperature is a key factor in the fabrication of dense zirconia samples [58].
25
Fig. 2.12. Influence of sintering pressure on the temperature required for 95% TD in zirconia with corresponding grain size [54].
The apparition of spark discharges caused by alternative switching on and off the DC current creates hot regions where the impurities located between particles are melted and vaporized. This process has been advocated mainly to the generation of weak plasma through the powder sintered under pulsed current and causes a phenomenon referred to as “necking” leading to high purification and joining of the densified particles. The detailed steps of the process are shown in Fig.2.13.
However, the concept of plasma still remains not adequately understood, without providing direct justification of its existence. Thus, plasma generation represent an important objective of struggle to establish an implicit understanding of the process.
D. Robles Arellano et al investigated the effect of sintering techniques on the densification behaviour of 8 mol% yttria stabilized zirconia (YSZ) based composites with the addition of 11.6, 21.6 and 30.5 wt% La2O3 [59]. Their work draw clearly the advantage of SPS to attain high densification level (∼92 – 96%) in La2O3+YSZ composites at significantly lower time, pressure and temperature process conditions (1500 °C, 50 MPa and 10 min) compared to pressureless sintering with lower relative density of about (82%) at 1600 °C held for 2 h and HIP sintering technique with relative density of 99.7% performed at 1500 °C, 196 MPa for 2 h.
26
Fig. 2.13. Detailed steps of neck formation during SPS due to the spark discharges [52].
In addition, M. Mazaheri et al investigated the processing features of yttria stabilized zirconia reinforced with multiwall carbon nanotubes sintered by SPS [60]. It was found that SPS is an efficient way to produce fully dense composites with the ability to reduce CNTs structural damages at high temperature contrary to the conventional sintering methods. It also enabled a strong bonding between MWCNT and the ceramic matrix, which is a prerequisite for enhanced mechanical properties. In a similar work performed by Karanam et al. regarding the investigation of densification behaviour in 0.2, 0.5, and 1 wt% YSZ / CNT ceramic composites processed via SPS [61]. The detailed interpretation of the advantageous role of SPS process and CNT in enhancing the hardness and resistance to crack propagation in YSZ / CNT ceramic composites was presented. Indeed, it was found that the presence of CNTs within YSZ matrix led to a delayed densification and grain growth during SPS processing, which in turn reduce the density of the composite. However, during SPS processing CNTs helps to pin grain boundaries which resulted in enhanced mechanical properties.
27
2.5 Mechanical behaviour of ceramic matrix composites (CMC)
2.5.1 Stress strain-curves of pure ceramics via CMC
The strength of ceramic materials is most commonly measured using tensile test, where the external forces tend to elongate the specimens. Typical stress–strain curves comparing the tensile behaviour of pure ceramics with different types of reinforced CMCs is depicted in Fig. 2.14. In pure ceramics (illustrated by the black curve), brittle fracture generally arises before the occurrence of plastic deformation. In fact, in pure ceramic material, the binding orbital of electrons are localized around the corresponding ion cores restricting the movement of electrons. As a result, very high energy is required to generate the movement of dislocations and therefore make the plastic deformation possible [62, 63].
Contrary to pure ceramics, ceramic matrix reinforcement with the help of fibers such as carbon nanotubes (CNTs), boron nitride nanotubes (BNNTs) or whiskers of titanium carbide (TiC), silicon carbide (SiC), silicon nitride (Si3N4), boron carbide (B4C) led to a significant enhancement in fracture toughness, wear resistance and strength behaviour [64]. Indeed, at lower applied stress as shown in Fig. 2.14, both pure ceramics and CMC shares similar elastic mechanical response, which means that the material regains its initial state when the stresses are removed.
Fig. 2.14. Schematic of typical stress strain curves of pure ceramics and different types of reinforced CMCs [7].
28
This region is characterized by the elastic modulus most commonly designated as E and can be determined mechanically from the linear region where the stress and strain exhibit a proportional relationship. E is mechanically reversible and can be characterized by the ratio of stress to strain that is equal to the elastic modulus constant according to Hooke's Law [65].
σ = E . ε (2.10)
where σ is the measured stress (Pa), E is elastic modulus (Pa), and ε is the strain (mm/mm) [66–68].
In addition, E can be determined also using the sonic technique. This method involves a piezoelectric transducer that measures the time of flight of transverse and shear waves. As a result, the recorded voltage as a function of time can be plotted. Due to the minimal sensitivity to internal defects the sonic technique is mainly employed to distinguish between the materials [69, 70].
When the applied stress increases, a plastic deformation occurs due to matrix cracking. As a results, the stress–strain curve of CMC follows a nonlinear behaviour as can be seen from Fig.
2.14. At even higher stress, the cracks reach the saturation and remains nearly constant. The end of the final step is characterized by material failure, where the stress–strain curve follows linear behaviour but with lower tangential modulus compared to initial modulus.
In fact, the fibers and whiskers form an additional resistance barrier when the stress is applied resulting in pull-out, crack bridging and crack deflection [71]. As a consequence, theses mechanisms lead to crack self-healing, strong bounding within the ceramic matrix. Thus higher tensile strength is achieved in CMC compared to pure ceramics. Generally, the tensile strength of ceramics composites is much lower than their compressive strength (about ten times). This is due to the external forces applied during the compressive test that tend to decrease the specimen volume and then limiting the flaw propagation. Indeed, in compressive loading plastic deformation such as glide bands and the pile-up of dislocations at grain boundaries, micro cracks take place at very high loading to conduct to the fracture [62,63]. Consequently, ceramics are usually used in applications where loads are compressive.
29 2.5.2 Ceramic matrix composites: challenges
Despite, the major advantages and unique properties achieved with the fabrication of CMC materials, the recent literatures reported several dissimilarities of the nanomaterials effectiveness dispersed within the ceramic matrix or at the grain boundaries. Indeed, this has been suggested to be in link with several issues due to the choice of synthesis techniques or sintering treatment.
A. Gallardo-López et. al. prepared 3 mol% yttria tetragonal zirconia polycrystals (3YTZP) composites with 1, 2.5, 5 and 10 vol% nominal contents of graphene nanoplatelets (GNPs) [72].
The mixture was synthesized using ultrasonic probe agitation of GNPs. Fully dense composites were obtained after SPS sintering at 1250 °C for 5 min. Further, Vickers hardness decreased with GNP content from 13.9 GPa in 3YTZP to 8.1 GPa in 3YTZP with 10 vol% GNPs. Moreover, significant hardness anisotropy was obtained in the perpendicular plane to the sintering compared to the cross section. This anisotropy augmented with GNPs content. Zahedi et.al. compared the effectiveness of CNT dispersion in wet and dry media to avoid agglomerations [73]. The density of the samples prepared in wet media was generally higher compared to dry media samples. This was attributed to high CNT homogeneity found in wet media method. Melka et.al studied tetragonal zirconia polycrystals doped with 3 mol% yttria (3Y-TZP) and multiwall carbon nanotubes (MWCNTs) content from 0.5 to 4wt% [74]. A strong increase in the electrical conductivity for the sintered composite with 0.5 wt% MWCNTs content has been claimed. Xu et al. used boron nitride nanotubes (BNNT) instead of CNT or graphene to improve zirconia fracture toughness [75]. BNNTs with 0.5, 1 and 2 wt% were added to zirconia matrix. The highest flexural strength and fracture toughness were found in the composite with 1 wt% of BNNT (1143.3 MPa and 13.13 MPam1/2 respectively). Duszova et al. studied the effect of CNTs content on the mechanical and electrical properties of monolithic zirconia [76]. The addition of the CNTs decreased the hardness and indentation toughness from 1297 kg/mm2 to 830 kg/mm2 and from 8.01 MPam0.5 to 5.6 MPam0.5 respectively. This fact was attributed mainly to the residual porosity remained in the material after sintering. CNT and graphene can be easily damaged by the high sintering temperature and therefore, react with the oxide matrix [77]. Spark plasma sintering (SPS) has been emphasized by all to enable high ceramic consolidation with minimal damage [78].
30 2.5.3 Fracture toughness of ceramic composites
The use of ceramics and composites in any successful application requires a careful investigation and design of the crack propagation mechanism and its occurrence. The spontaneous extension of cracks can be described by the Griffith/Irwin criterion (Eq. 2.11) and refers to the stress intensity factor (SIF) (K, MPam0.5) described as the material ability to adhere the loading at the presence of intrinsic flaws [79,80].
K = σY√πa (2.11)
where 𝜎 (MPa) is the stress in the uncracked body, Y is a dimensionless geometric factor describes the preexisting flaw geometry and the specimen and a (m) is the crack length.
Failure occurs if the stress intensity factor (SIF) reaches or exceeds the fracture toughness KIc (which is the resistance of the material against crack extension).
K ≥ KIC (2.12)
The determination of fracture toughness based on conventional methods such as single edge notched beam (SENB), the single edge V-notched beam (SEVNB), Chevron notched beam, surface crack in flexure (CNB and SCF), single edge pre-cracked beam (SEPB), and other conventional methods is hardly assessed on the brittle ceramics or composites because of their notable brittleness (the hard phase and high elastic modulus) and the difficulty to create a sharp pre-cracked specimen. In addition, these methods require arduous sample preparation and a particular notch geometry control to get only one result for each sample. Therefore, a significant time consumption and expensive procedures are crucial [81–84].
2.5.4 Hardness of ceramic composites
The hardness of materials is considered as a key parameter in the field of material science, engineering design and analysis of structures. The principal aim of the hardness test is to develop more sophisticated devices and machines suitable for a given application or a particular treatment.
As a general definition, hardness refers to material quality rather than a physical property and is defined as the resistance to plastic deformation or penetration namely by indentation, wear, abrasion or scratch. In 1900, the Swedish engineer Brinell was the first who invented an effective and modern method using hard steel ball as the indenter to measure the hardness of a given
31
material. His method entitled Brinell hardness testing presented an alternative to: 1. Traditional resistance test, which used to measure the scratch resistance in Mhos. 2. The destructive and high time-consumption of the tensile test, besides, its difficulty to be performed on several small sized new materials. Therefore, Brinell hardness testing using a hard steel ball as the indenter has been often the only solution [63, 67, 85, 86].
Meanwhile, several authors discussed the hardness testing on ceramics through discussion of indentation fracture or as a fundamental description. Among them, the most influencing ones were McColm (1990), Lawn (1993) Tabor (1951) and Chandler (1999) [85]. Today, several hardness testing variants exist, where the most common are Rockwell and Brinell test usually used to evaluate the hardness of soft to medium hard metals and material with non-uniform microstructures. On the other hand, other hardness testing methods such as Vickers and Knoop are usually applied on ceramics [67, 80]. According to the applied loads on the indenter, hardness testing can be divided into two groups: macro-hardness and micro-hardness. When the applied load exceeds 1 kg, the test is known as macro-hardness and usually performed on large sized material such as testing tools, dies etc. Below 1 kg applied loads, the test is considered as microhardness, mainly devoted to small scale material which includes thin films, small parts and individual constituents of materials [63,86]. The geometry of the indenter, load, dwell time besides the means of result interpretation are the key factors to differ between the mentioned hardness testing methods.
Fig. 2.15. Hardness test. a) Vickers indentation under 19.6 N load in SPS sintered zirconia [84], b) Schematic of Vickers hardness principle.
32
Vickers hardness test is the most preferred one due to several advantages. Indeed, in addition to the extremely high precision Vickers hardness test uses only one type of indenter that is adaptable to all types of materials including the softest and hardest ones (Fig. 2.15). However, the Vickers machine is more expensive than the Brinell or Rockwell machines [67,87]. Generally, in ceramics hardness is closely related to yield strength and can reflects the material’s resistance to wear. The most cited empirical equation in the literature [80,88], that describes Vickers hardness/yield strength relationship follows approximately the form as below:
HV≈ 3. σy (2.13)
where σy is the yield strength.
2.5.5 Indentation fracture toughness of ceramic composites
To overcome these difficulties several simple techniques have been established for this purpose. The most attractive one is referred to as indentation fracture toughness that involves the measurements of the emanated crack lengths from the corners of Vickers indentation diagonals.
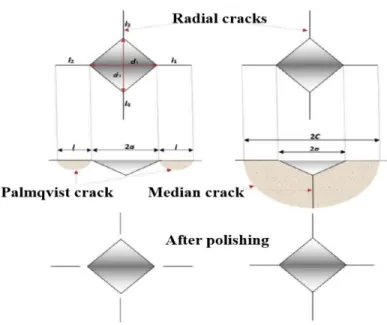
This method basically enables easy, fast and cheap experimental procedure in addition to the non- destructive test since only small sample size is required. Vickers and Knoop indentation hardness tests are the most commonly used techniques to create an indentation mark on the well and smoothly polished sample. In these methods, the indenter is forced into the surface at high testing load until a plastically deformed region is formed below and around the indentation, resulting in cracks emanated from the four corners of the impression zone and residual stresses according to the material features. The indentation fracture toughness method involves the crack length and shape, load, impression size, hardness, calibration constant and sometimes the elastic modulus [81, 89 –91]. Numerous studies performed on polycrystalline ceramics describe the Palmqvist crack as the four independent radial cracks which do not connect to each other under the indentation.
This type of crack is mostly formed at low and intermediate load. Above a characteristic generally quite high threshold load, the crack merge to a median type where the cracks are interconnected in the sample depth [79, 95, 96].
33
The two models referring to Palmqvist and median crack under Vickers indentation are illustrated in Fig. 2.16. Indeed, the geometry of the crack can be affected by crack growth mechanism that is associated with the presence of a complex residual stress network around the indentation in some material. Therefore, in some cases it can be hard to approve if the median crack shape is an extension of Palmqvist cracks due to residual stress or its formed directly at the beginning from the indenter [40]. The two crack shapes can be identified by several methods. A formal commonly used criterion relies on measuring the crack-length/indent diagonal ratio.
Indeed, when the ratio is larger than 2 the crack geometry is attributed to the median shape, else it is Palmqvist. Other experimental techniques known as decoration [97–102], process and serial sectioning technique [79, 83, 103, 104] are widely used. The decoration of the indentation cracks method proposed by Jones et al. requires a saturated lead acetate solution which is soaked into the polished tensile surface of flexural specimens [105]. In this method, the crack path can be observed under SEM micrographs after fractographic test (taking into consideration the original indentation crack as failure origin) and the completed drying of the excess lead acetate solution usually by using an oven.
In addition, the crack shape can be determined by serial sectioning method based on layer- by-layer material removal by ceramographic polishing. At the end of surface polishing, the cracks
Fig. 2.16. Type of cracks in ceramic material.
34
remain connected to the inverted pyramid of the indentation in case of median shape, while the Palmqvist cracks exhibits a detached radial crack as displayed in Fig. 2.16.
2.5.6 Vickers indentation fracture toughness of ceramic composites
By far, most of the studies cited in the literature use the Vickers indenter to determine the fracture toughness directly from indentation mark. Different models (more than 30 equations) have been developed by a large number of authors either by empirical or experimental processes, some of which involves the Young and Poisson modulus in addition to the hardness test results. Most of the equations are a reformulation of the previous equations with novel calibration constants depending on the crack type (Palmqvist or radial-median), crack length, and material properties.
As mentioned earlier, the conventional techniques are hardly applicable to large scale samples due to the laborious crack measuring, robust equipment and the requirement of a very precise notch geometry control [106]. Furthermore, the raised residual stresses and the hard surface preparation can influence largely the final results.
As consequence, in 1970, Evans and Charles were the pioneer who developed the Vickers indentation fracture technique to assess the fracture toughness of ceramics and their composites.
In 1976, they published a short communication, where they presented a normalized calibration curve fitting to correlate the crack length (c) and indentation size (a) to estimate the indentation fracture toughness. In their paper, a generated equation has been provided that seems to be used regardless the crack shape (Palmqvist or with median) as illustrated below [40,106]:
KIC = 0.16(c a⁄ )−1.5(HV. a1⁄2) (2.14) Afterwards, the indentation method has successively received much interest because of its expediency. However, the indentation fracture toughness scientist community assumes that it’s important to establish new models for each crack type to obtain accurate fracture toughness values.
Consequently, in 1981 Marshall and Evans [107] simplified and corrected the formula of indentation given by Evans and Charles applied to median crack, while Anstis et al. proposed additional modifications to the proposed equation as presented below [108]:
Marshall and Evans [107,109]:
35
KIC= 0.036E.4P.6a−.7(c a⁄ )−1.5 (2.15) Antis, Chantikul, Lawn, and Marshall [108, 109]:
KIC= 0.016 ( E HV)
0.5 P C1.5
(2.16) Other reformulations of the previous equations for median crack were established by Lauginer, Casselas and Nihara as cited below:
Lauginer [81, 109]:
KIC= 0.010 ( E HV)
0.6 P C1.5
(2.17) Casselas [81, 109]:
KIC= 0.024 ( E HV)
0.5 P C1.5
(2.18) Nihara, Morena, and Hasselman [81, 109]:
KIC= 0.0309 ( E HV)
0.4 P C1.5
(2.19) The models assume that the residual stress formed underneath the indentation in the plastically damaged zone proceeds as expanding cavities that pulls the median cracks apart.
Subsequently, different authors successively described the Palmqvist cracks models to estimate the indentation fracture toughness. All the equations applied to Palmqvist crack type use the Exner crack resistance (W)[83], defined by the ratio between indentation load (P) and the sum of the cracks length at the corners of the Vickers hardness impression using the following Equation:
W = P
∑4i=1li
(2.20) The most commonly cited equations to describe the Palmqvist crack type are presented as follows:
Warren and Matzke model [81, 109]:
KIc = 0.087. (HV. W)1⁄2 (2.21) Nihara, Morrena, and Hasselman model [81, 109]:
36
KIc = 0.0246. (E H⁄ V)2 5⁄ . (HV. W)1⁄2 (2.22) Shetty, Wright, Mincer, and Clauer model [81, 109]:
KIc = 0.0889. (HV. W)1⁄2 (2.23) However, the different proposed equations result in large standard deviation of KIC results.
In addition, when the properties are not homogeneously distributed along the sample surface, this method may not represent accurately the indentation fracture toughness due to the small indented zone. Therefore, several tests must be carried out on the same specimens for a better precision.
2.6 Tribological properties of ceramic matrix composites
The optimization of wear resistance and friction coefficient is considered as a preliminary step during the design of a new tribological system, able to withstand severe thermo-mechanical environment. Reinforced ceramic composites appears nowadays commercially competitive to the traditional materials for example: grey cast iron or carbon/carbon used in the fabrication of brake systems which require reduced friction coefficient and high wear resistance [1, 110]. In fact, nano- conductive particles, whiskers or fibres (MWCNTs or graphene) have been in several works endowed as a secondary phase into structural ceramics such as: yttria stabilized zirconia (YSZ), silicon nitride (Si3N4), silicon carbide (SiC) or aluminium oxide (Al2O3) to improve their mechanical as well as tribological properties. The major advantages of reinforced structural ceramics reside in their greater strength, reduced density, high abrasion/wear resistance and high temperature stability [111]. Indeed, reinforced structural ceramics demonstrated high tribological performance at lab as well as industrial scale, which enable their wide commercialization for short and long operational lifetime applications. Advanced nozzle jet vanes used in missiles or hot structures for spacecraft are good examples of short life time applications where mostly melt infiltrated composites like C/C–SiC coated with a ceramic surface protection take a part [112].
Other typical applications requiring special wear resistance performances for longer structural lifetime are devoted to terrestrial applications including brake systems in cars, trains, aircraft or elevators. In this context, several ceramic matrix composites have been investigated for these purposes [110, 113, 114]. Kasperski et al prepared ZrO2 / MWCNT composites by SPS. Several amounts of MWCNT (0.5, 1, 1.68, 3.24 and 5.16 wt %) have been added to zirconia matrix [115].
37
The wear test investigation has been performed under a load of 5 and 10 N using alumina ball as a counterpart. The frictional properties were reduced with increasing MWCNT amount from 0.5 to 3.24 wt%. However, the friction coefficient and the wear resistance were significantly improved with 5 wt% MWCNT addition, which was in line with the fainter track and the higher lubricating effect observed on the worn areas. On the other hand, the highest average arithmetic roughness was attributed to the composite with 5 wt% of MWCNT about 0.11 compared to the other composites, where the roughness was located in the range of (0.01- 0.03) causing easier zirconia grains pull-out during polishing. Hvizdos et al. investigated the tribological properties of GNPs with 1 and 3 wt% additions into Si3N4 matrix under (5 N) load and maximum sliding distance of 300 m [116]. Steady-state of friction coefficient were recorded at short sliding distance followed by more or less higher fluctuation depending on the composite content. According to the results, the best friction coefficient and wear resistance have been obtained in the composite with 3 wt%
graphene addition to Si3N4 matrix illustrated by remarkable wear rate decreased (about 60 %) compared to Si3N4 reference. The microstructural features analysis was related closely to the wear damage mechanism. In fact, it confirmed a strong GNPs interfacial bonding to silicon nitride matrix. This high integration of GNPs into the microstructure prohibited finding a significant lubrication effect during wear test. On the other hand, intensive milling process for more than 10 h played an important role to achieve large distance between graphene multilayers and therefore acquire the expected tribological properties.
Latifa et al studied the friction and wear behaviour of spark plasma sintered 3 mol% yttria stabilized tetragonal zirconia (3Y-TZP) reinforced with up to 2 wt% MWCNTs using zirconia ball with 10 mm diameter as a counterpart [117]. In their study, the friction coefficients (COFs) were evaluated in macro-scratch testing with a sliding Rockwell indenter at increasing loads. Strong oscillations have been recorded in the COF beyond a critical load relatively higher. The oscillations appeared earlier for the composites with larger amount of MWCNT provoking brittle fracture and chipping trend. The origin of the brittle fracture and chipping were supposed to be resulted from the weak zirconia and MWCNTs interface or due to the tensile stresses appeared during the scratch test. However, the effect of MWCNTs addition on COF under low applied loads resided in considerable increases reflecting low wear rate. In another study, the influence of the applied load and sliding speed on the friction and wear behaviour of ZrO2 with 1.07 wt% carbon nanofiber (CNFs) composite has been investigated by Hvizdos et al [118]. A slight variation of the friction
![Fig. 2.3. Phase diagram of ZrO 2 -Y 2 O 3 system [22].](https://thumb-eu.123doks.com/thumbv2/9dokorg/514905.176/13.918.250.674.112.490/fig-phase-diagram-zro-y-o.webp)
![Fig. 2.9. Schematic illustration of the techniques used to synthesis carbon nanotube, a) arc discharge, b) pulsed laser deposition (PLD), c) chemical vapor deposition (CVD) [39,42]](https://thumb-eu.123doks.com/thumbv2/9dokorg/514905.176/20.918.127.809.370.924/schematic-illustration-techniques-synthesis-nanotube-discharge-deposition-deposition.webp)
![Fig. 2.12. Influence of sintering pressure on the temperature required for 95% TD in zirconia with corresponding grain size [54]](https://thumb-eu.123doks.com/thumbv2/9dokorg/514905.176/25.918.230.695.110.380/influence-sintering-pressure-temperature-required-zirconia-corresponding-grain.webp)
![Fig. 2.13. Detailed steps of neck formation during SPS due to the spark discharges [52]](https://thumb-eu.123doks.com/thumbv2/9dokorg/514905.176/26.918.117.785.112.496/fig-detailed-steps-neck-formation-sps-spark-discharges.webp)
![Fig. 2.14. Schematic of typical stress strain curves of pure ceramics and different types of reinforced CMCs [7]](https://thumb-eu.123doks.com/thumbv2/9dokorg/514905.176/27.918.228.692.656.913/schematic-typical-stress-strain-curves-ceramics-different-reinforced.webp)
![Fig. 2.15. Hardness test. a) Vickers indentation under 19.6 N load in SPS sintered zirconia [84], b) Schematic of Vickers hardness principle](https://thumb-eu.123doks.com/thumbv2/9dokorg/514905.176/31.918.240.686.730.956/hardness-vickers-indentation-sintered-zirconia-schematic-vickers-principle.webp)