BWP. 2001/4
Economic transformation and the revaluation of human capital –
Hungary, 1986–1999
GÁBOR KERTESI and JÁNOS KÖLLŐ
Labour Research Department, Institute of Economics, Hungarian Academy of Sciences
Department of Human Resources, Budapest University of Economics and Public Administration
Budapest
Budapest Working Papers on the Labour Market BWP. 2001/4
June 2001
Administration
Economic transformation and the revaluation of human capital – Hungary, 1986–1999
Authors: Gábor KERTESI, Head of Department of Microeconomics, Budapest University of Economics and Public Administration, Fővám tér 9. H–1093 Budapest, Hungary; senior research fellow of Labour Research Department, Institute of Economics, Hungarian Academy of Sciences;
Budaörsi út 45. H–1112 Budapest, Hungary. E-mail:
kertesi@econ.core.hu
János KÖLLŐ, senior research fellow of Labour Research Department, Institute of Economics, Hungarian Academy of Sciences; Fellow at William Davidson Institute, University of Michigan Business School, Ann Arbor, Michigan, USA; Fellow at Institute for the Study of Labor, University of Bonn, Bonn, Germany. Address: Budaörsi út 45. H–1112 Budapest, Hungary. E-mail: kollo@econ.core.hu
Paper presented at the International Conference „Understanding Skills Obsolescence:
Theoretical Innovations and Empirical Applications” organised by the Research Centre on Skills, Knowledge and Organisational Performace (SKOPE), University of Oxford, Department of Economics and the Research Centre for Education and the Labour Market (ROA), Maastricht University, May 11-12, 2001, Maastricht.
Published by the Institute of Economics, Hungarian Academy of Sciences.
Budapest, 2001.
With financial support from the Foundation for Job Creation
GÁBOR KERTESI – JÁNOS KÖLLŐ
The paper analyses the evolution of relative wages using individual wage data, and the contribution of skills to productivity using firm- level information from Hungary, 1986-99. Its main conclusion is that skills obsolescence was, and still is, an important aspect of post- communist transition. The data suggest a general rise in the returns to education between 1989 and 1992. This, the paper argues, was just a mirror image of the collapse of demand for unskilled labour in a period of deep crisis when technological change was minimal, and the forces of the market just started to work. When market institutions were already at work, and modern technologies were implemented on a massive scale, the general appreciation of education stopped but the returns to experience continued to decline. Young and educated workers are paid increasing wages and their skills are estimated to yield higher productivity returns, especially in a modern environment.
By contrast, neither productivity nor wages grew for the older cohorts of educated workers after 1992.
1. INTRODUCTION
The basic measures of enrollment in education, completed classes, and the population’s total work experience suggested, some ten years ago, that Central and Eastern Europe's transition to the market economy would be promoted by a valuable and transferable stock of human capital. Optimistic and proud references to a 'highly skilled labour force' were repeatedly made in government manifestos and the (early) country reports of international organizations. Some less contented observers warned, however, that the distortions of the school system and the peculiarities of work-based skills may considerably reduce the value of the inheritance.
The socialist system put strong emphasis on technical skills as opposed to business related disciplines on both the secondary and higher levels of education. On the secondary level simple vocational training for manual occupations had shares exceeding 50 per cent while upper secondary education was severely undeveloped. (OECD 1993). A considerable part of what workers and managers 'learned by doing' was how to deal with input shortages, how to manage the inconsistencies of plan orders, how to make transactions on the sellers' market – skills losing their value when the economy is opened and the forces of the market begin to work. In addition, new technologies were expected to appear 'overnight', shortly after the liberalization of trade and FDI, leaving the older generation less time for adjustment than had their Western counterparts.
Whether the skills acquired under communism can indeed be adapted to the needs of the Western market economy, which itself depreciated many old skills in the last two decades, is a question bearing prime importance for the region's social peace and growth prospects even now. In 2001 the median worker of the region had about 20 years of work experience. She or he left the school in 1980, invested ten years to the acquisition of work- based skills in a socialist state enterprise, thus she/he is still at risk of transition-related skills obsolescence. What is at stake is more than a mild decrease in the potential growth rate: a disappointed older generation with a broken career, pushed out of better jobs, paid lower and lower wages would be an outright loss to the society as well as a risk endangering the completion of post-communist transition.
Most, albeit not all, empirical studies demonstrate that the older generation was indeed devalued during the transition. In Poland Rutkowski (1996)
and Puhani (1997) presented evidence of falling wage returns to experience in 1987-92 and 1992-95, respectively. In the former Czechoslovakia Vecernik (1995), Flanagan (1995), Chase (1997), and Sakova (1998) observed steeply declining returns in early stages of the transition and so did Kertesi and Köllő (1999) in Hungary, Steiner and Bellmann (1995), Krueger and Pischke (1995), and Burda and Schmidt (1997) in the former GDR.
No decline in returns was detected by Steiner and Wagner (1997) in their female sub-sample but, as they called the attention, their results were biased by a growing share of public sector employees within East Germany's female labour force. Franz and Steiner (1999) estimated falling returns for women but flat experience-wage profiles for men both before and after the unification. (Their choice of controlling the wage equation for tenure may have affected their pre-unification estimates because labour turnover was particularly low in the GDR questioning the distinction between general and firm-specific experience.) A recent paper using retrospective data by Munich, Svejnar and Terrell (1999) observed no change in the experience-wage profile in the Czech Republic between 1989 and 1996. While the MST survey is unique in providing longitudinal observations (the respondents were asked to tell their 1989 earnings in 1997) the data are potentially subject to recall bias and, even if unbiased, are difficult to compare with other sources for the exclusion of young workers.
Did, then, the older generation lose during the transition? We believe it did as suggested by the bulk of the literature: the comparable studies based on cross-section data, focusing on the enterprise sector, using potential years in work as a measure of experience unequivocally suggest decline in the wage returns although they do show differences in the magnitudes and time paths. Some of the seemingly contradicting results can be reconciled with these findings if specification issues are taken into account.
Undoubtedly, some disturbing details remain – ones discouraging general statements about the 'fate of older generations' but calling for further empirical research.
In this paper we would like to clarify some of the unclear details using large samples of Hungarian workers and firms observed over a long period (Appendix 1). Cross section samples of about 100,000 individuals per annum in 1986-99 allow the analysis of relative earnings in various sub- groups and the study of interactions between education and experience.
We can also confront the results from Mincer-type earnings functions with
estimates of the relative productivity of skill groups distinguished by educational background and experience. This is rendered possible by the availability of enterprise level data on skills, capital and output for a restricted sample of medium-sized and large firms.
The earnings functions presented in Section 2 reveal two stages of different character in the revaluation of human capital. The first stage starting in 1989 and lasting until the low point of the 'transformational recession' brought about a widening wage gap between skilled and unskilled labour and falling returns to experience. 'Rising returns to education' should be strictly meant in relative terms since even skilled workers' employment and real wages decreased by two-digit percentages in this period.
The second stage characterised by rising real wages for high-wage workers and massive skilled job creation had rather different implications for the relativities. While the skill premium of older workers failed to increase the general devaluation of experience and the appreciation of new skills (rising returns to education in young cohorts) got impetus and continued until recently. The productivity equations of Section 4 provide part of the explanation by suggesting a widening productivity gap between skilled- and-young and skilled-and-old workers. Such a gap was first observed in foreign-owned enterprises but appeared in the domestic sector, too, in later stages of the transition.
The findings thus support the pessimistic (realistic) scenario of skills obsolescence after the fall of state socialism. A more general lesson from Hungary’s case is that Mincer-type earnings functions estimated without interacting education and experience, and interpreted without an eye on wage levels and employment, fail to uncover the true story. In early stages of the transition one could observe a minor decline of returns to experience and, more importantly, a major general increase in the value of school- based skills irrespective of vintage. The estimates relating to this period were driven by the collapse of demand for unskilled labour rather than technological renewal or permanent systemic change, however. When new technologies actually appeared and the demand for qualified workers began to rise the 'appreciation of skills' was restricted to the younger generation.
2. THE EVOLUTION OF RELATIVE WAGES
Throughout the paper we apply three different specifications of earnings regressions (see Table 1). The benchmark Mincer-type specification comprises the key variables (schooling and experience) as educational grade dummies and linear, quadratic, cubic and quartic terms of experience.1 (Specification 1). Specification 2 applies an augmented interactive model with group dummies for interactions of gender, education and experience. Finally, we estimate a simplified interactive earnings model (which interacts education and experience in a simplified manner), where the key variables are defined exactly the same way as in the underlying firm level productivity model (Specification 3).
Table 1.
EARNINGS REGRESSIONS USED IN THE PAPER
Specification Key variablesb Controlsb Detailed information 1. Benchmark
Mincerian
gender dummy,
educational grade ummies, exp, exp2, exp3, exp4
Appendix 2 2. Augmented
interactive
26 interactive dummies of education, experience and gender
Appendix 3 3. Simplified
interactivea
gender dummy,
unskilled, skilled-young, skilled-old
occupational grade,
productivity, capital/labor ratio, firm size, local un- employment rate, industry dummies, region dummies, constant
Appendix 4
a Occupational grade is not included as control.
b See Appendices for definitions and measurement.
We start with the benchmark regressions controlled for a large number of wage determinants using data from 1986, 1989 and 1992-99. The
1 We use higher than second order experience terms in order to be able to follow cohort specific changes in the earnings profiles over time.
regression estimates suggest a marked increase in the wage returns to schooling, from the onset of transition. Figure 1, depicting the time paths of returns to educational grades, suggests that wages relative to the primary school grade grew by 25 per cent in the category of higher education, and about 10 per cent in the case of secondary school background. The value of apprentice-based vocational training did not change during the transition.
Most of these changes took place during the ‘transformational recession’
i.e. between 1989 and 1992/3. The rates of return to education seem to be stabilised after 1993.
percent
year
college secondary school
vocational training school
86 89 92 95 99
0 10 20 30 40 50 60 70
Figure 1: Returns to schooling (base: primary school), 1986-99 (Specification 1)
The numbers presented in Figure 1 can be interpreted as lower bound estimates of the "true" change in relative wages because the observed earnings of the unskilled are upward biased by the sorting effect of unemployment (Appendix 6).
The rise in return to formal education was accompanied by the devaluation of market experience acquired under socialism. Changes in the rates of return are measured by the formula yˆt −yˆt−1, with the predictions defined as
4 4 3 3
2 2
1*exp ˆ *exp ˆ *exp ˆ *exp
ˆ =βˆ +β +β +β
y . The predicted change in the
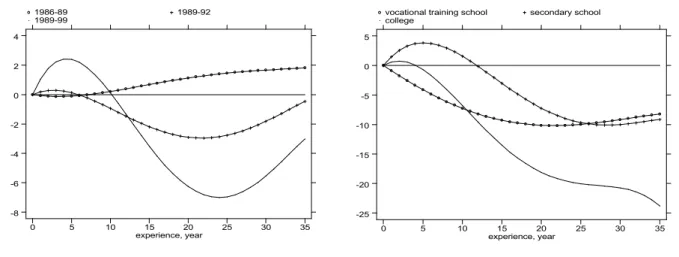
returns to experience is plotted against the years of experience in Figure 2.
Panel a suggests that the value of labour market experience slightly increased in the last years of state socialism. The trend reversed in 1989 when experience started to lose its value, especially in older cohorts of the labour force. The relative premium on 20 (or more) years of labour market
experience dropped by 4 percent in 1989–92, and 7 percent between 1989 and 1999.
experience, year
1986-89 1989-92
1989-99
0 5 10 15 20 25 30 35
-8 -6 -4 -2 0 2 4
experience, year vocational training school secondary school college
0 5 10 15 20 25 30 35
-25 -20 -15 -10 -5 0 5
(a) whole sample (b) separate equations by educational groups Figure 2:Changes in the predicted returns to experience, 1986-99,
per cent (Specification 1)
As suggested by panel b of Figure 2 (separate equations for each educational group), the obsolensence of experience-based skills was stronger in the educated part of the labour force, with workers of university or college background suffering the largest losses. A person with university diploma and 15–25 years of experience lost about 20 percent of his/her former experience-related wage premium.
Figure 2b calls the attention to the relevance of an interactive model which allows for the fact that different educational and experience groups were exposed to skills obsolescence to highly different degree. The interaction effects are tested with an equation using 25 interactive dummies2 of education, experience and gender, treating unskilled labour (0-8 completed classes irrespective of experience and gender) as the reference category. In order to be able to control the gender division of the occupational structure, and the profound gender differentials in the extent of specialized
2 The interaction of gender, three educational (vocational training school, secondary school, college) and four experience groups (0-5, 6-10, 11-20, 21-30 years of experience) plus two categories as left overs: "old" workers (more than 30 years of experience (without distinguishing by gender and schooling) and unskilled labour (without distinguising by gender and experience). The latter category is the group of reference in the regressions. In the augmented interactive model (Appendix 3) the same controls are used as in the benchmark specification (see Appendix 2)
knowledge in the post-primary education3, Figure 3 and its underlying equation reports the coefficients for males and females separately.
Regression parameters of the year 1986 are chosen as uniform (zero value) starting points. Changes in wage returns relative to the 1986 values are plotted in the graphs. Panels a-b repeat the results of the benchmark Mincerian model by gender.
(i) The benchmark regression models (panels a-b) hint at the stabilisation of returns to education following 1992/93, the worst years of the transformation crisis. By contrast, the more precise interactive model (panels c-h) reveals profound differences between young and old cohorts.
The experience-related gap of the pre-transitional years (1986-89) was in large part unaffected by 1992/934, and started to narrow rapidly after 1992/93, and even more markedly after 1995 when the first signs of economic recovery became visible.
(ii) Workers with college or university background, both males and females, improved their position across all experience groups but the value of education increased at substantially higher rates in the young cohorts.
As a result, the experience-related wage gap between the oldest and the youngest college cohorts decreased by 20-25 percent by 1999 (panels g-h).
Figure 3
year
college secondary
vocational
86 89 92 93 94 95 96 97 98 99
-5 0 5 10 15 20 25 30
year
college secondary
vocational
86 89 92 93 94 95 96 97 98 99
-5 0 5 10 15 20 25 30
(a) all experience groups, males (b) all experience groups, females (continue)
3 As 1999 data show: the typical educational level for female workers is the general secondary school (37 per cent as opposed to the 19 per cent of the vocational training school). The opposite is true for male workers: most of them (42 per cent) have vocational training school (as opposed to the 24 per cent who have general secondary education).
4 Exceptions are female college graduates and workers with completed secondary school. Even in these groups about the half of narrowing of the base years’
differential took place after 1992/93.
year
exp.: 0-5 years exp.: 6-10 years exp.: 11-20 years exp.: 21-30 years
86 89 92 93 94 95 96 97 98 99
-5 0 5 10 15 20 25 30
year
exp.: 0-5 years exp.: 6-10 years exp.: 11-20 years exp.: 21-30 years
86 89 92 93 94 95 96 97 98 99
-5 0 5 10 15 20 25 30
(c) vocational training school, males (d) vocational training school, females
year
exp.: 0-5 years exp.: 6-10 years exp.: 11-20 years exp.: 21-30 years
86 89 92 93 94 95 96 97 98 99
-5 0 5 10 15 20 25 30
year
exp.: 0-5 years exp.: 6-10 years exp.: 11-20 years exp.: 21-30 years
86 89 92 93 94 95 96 97 98 99
-5 0 5 10 15 20 25 30
(e) secondary school, males (f) secondary school, females
year
exp.: 0-5 years exp.: 6-10 years exp.: 11-20 years exp.: 21-30 years
86 89 92 93 94 95 96 97 98 99
-5 0 5 10 15 20 25 30 35
year
exp.: 0-5 years exp.: 6-10 years exp.: 11-20 years exp.: 21-30 years
86 89 92 93 94 95 96 97 98 99
-5 0 5 10 15 20 25 30 35
(g) college, males (h) college, females Figure 3: Changes in returns relative to the 1986 returns:
Differences of the respective regression parameters: ti i
i β β86
β = −
∆ , (t = 86, 89, 92-99, i = 1, ... , 24, 25), i representing 25 interactive dummies of education, experience and gender. Reference: unskilled labour: 0-8 completed classes, irrespective of experience and gender (panels c-h), Specification 2. Other controls: see Appendix 3
(iii) The returns to secondary school increased in, and only in, the younger cohorts of men and (particularly) women. The youngest female cohort managed to improve its position by almost 20 percent, followed by workers with 6-10 years of experience with a 15 percent increase, and older females whose market skills kept their modest value without any further appreciation. This kind of imbalance can be a sign of change in the patterns of demand for non-manual female employees resulting from the expansion of the tertiary sector.
(iv) Workers who completed vocational training school did not get ahead in general (neither the females nor the males improved their position relative to the reference category of unqualified workers) but the wages of young skilled workers grew by about 10 percent compared to their older counterparts. Again, we observe that the age-specific changes were taking place after 1992.
(v) The relative shift in the position of the two youngest cohorts with higher educational background (0-5 and 6-10 years of experience, respectively) is particularly telling. The gap between these two cohorts was 5-8 percent (in terms of rise in returns) in the first years of transition (1992-94). This diffential completely vanished by 1999 for males, and even reversed for females. As the youngest cohort of the 1995 cross- section (0-5 years of experience) and the second youngest one of 1999 (with 6-10 years of experience) graduated about the same time, in and right after 1989. Those who graduated from college in 1989-94 was the first cohort whose experience related returns were increasing over their life cycle in the whole period of 1986-99. The increase of experience-related returns indicate that new knowledge “behaves properly”: learning by doing is rewarded increasingly when demand for new skills rises.
This observation can indicate that the the turning point in the story of higher education in Hungary falls to the transitonal years when the quality of education may have changed substantially. People who graduated by and after 1989 were fortunate enough to receive a kind of education which proved to be very useful in the market economy. This was not the case for the other cohorts – and especially not for the older ones who graduated in the sixties, seventies and early eighties. The rise in return to their skills stopped by 1992/93 as transitional crises was over and the market economy (and the implied technological renewal) started to evolve at a full scale.
3. THE BROADER CONTEXT: JOB DESTRUCTION AND JOB CREATION
Lessons from the interactive model demonstrate that the value of skills rose between 1986 and 1992/93 in all experience groups, at almost the same rate. However, in interpreting the general rise in returns to education during the transformational recession one should consider the fact that nearly all groups of the labour force lost in terms of both job opportunities and real wages. The appreciation of skills should be meant in strictly relative terms.
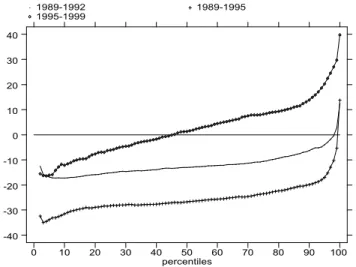
Though unevenly, real wages decreased by two digit percentages all along the wage distribution, barring the 100th percentile, in early years of the transition. Low wage workers (10th percentile) suffered a 30 per cent loss in 1989-95 but the decline at the other end of the wage distribution was large enough too (20 per cent in the 90th percentile). Figure 4 gives the percentage changes in net real wages by percentile over the 1989–1992, 1989–1995 and 1995–1999 periods.
As to the quantities, the time period of 1990–1995 witnessed large scale job destruction, too. Workers with different skills were unevenly affected but the available figures suggest net job destruction even in the skilled part of the market. As much as 48 per cent of the unskilled jobs disappeared between 1990–1995 but the market for skilled labour also had to face a 11 per cent contraction in that period.
percentiles
1989-1992 1989-1995
1995-1999
0 10 20 30 40 50 60 70 80 90 100
-40 -30 -20 -10 0 10 20 30 40
Figure 4: Percentage changes in net real earnings by percentiles in 1989-92, 1989-95, 1995-99
Table 2 Employment by gender and education 1990, 1992, 1995, 1999
(thousand)
Male Female Total
unskilled skilled unskilled skilled unskilled skilled Year
1990 1,803 845 1,38 1,055 3,190 1,900
1992 1,358 860 929 936 2,287 1,864
1995 1,225 824 759 869 1,984 1,693
1999 1,228 875 702 1,006 1,930 1,881
Source: Central Statistical Office in: Fazekas (2000), pp. 247, 249. Skilled stands for workers with secondary or higher educational background The years of general decline were followed by an era of divergent evolutions in 1995–1999. Skilled jobs were created in a similar magnitude as had been destructed during the transition5, and real wages in the upper range of the wage distribution started to rise (Figure 4). This was not the case with unskilled jobs. The number of unskilled jobs stagnated after 1995 and real wages decreased further in lower ranges of the wage distribution.
With the passing of the transformational recession, which brought about the collapse of demand for unskilled labour, substantial changes took place in the evaluation of human capital. As shown in the previous section the skill premium of older workers failed to increase further while the appreciation of new skills got impetus and has continued until recently. In the next section we present evidence suggesting that the widening gap between the value of old and new skills are consistent with differences in their relative productivity. These differences began to bear importance when the market for skilled labour started to grow and new technologies appeared in the economy.
Before engaging into a demand-side explanation we briefly address the question if the observed trends in wage returns indicate deficiencies on the supply side. This possibility can be ruled out on the basis of observed (absolute) outflows from the educational system. As shown at Figure 5 the marked rise in the value of new skills took place in a period when the
5 The net skilled job creation rate was 11 per cent in 1995-1999.
supply of skills increased considerably.6 Though the inevitable sluggishness of the supply-side response is part of the story, the concomittant increase of wages and supply of young skilled workers leads us to believe that the key is on the demand side.
year
secondary vocational training school
1970 1975 1980 1985 1990 1995 2000
30000 40000 50000 60000 70000 80000 90000
year
college enrollments college graduations
1970 1975 1980 1985 1990 1995 2000
10000 20000 30000 40000 50000
(a) graduation from vocational training school and secondary school
(b) College enrollments and graduations Figure 5: Flows of the educational system, 1970–2000 (number of students)
4. ESTIMATES OF RELATIVE PRODUCTIVITY
We present a simple model with the aim to test the hypothesis that changes in technology and markets raised the productivity of younger educated workers relative to other employees including older skilled employees. We estimate productivity equations (derived from Cobb-Douglas production functions with heterogeneous labour input) of the form:
logy =α +
∑
3i=2βi logli +γ logk +ε. (1) y being firm level productivity (value added per worker), li the share of the different types of skilled labour within the firm (skilled-young (l2) and skilled-old (l3), the base category being the share of unskilled labor: l1)7, k
6 As the annual inflow of students to college increased sharply between 1994 and 1999 we can expect a further rise in supply in the 2000-2005 period.
7 “Skilled” means completed secondary school or incompleted or completed college or university, “unskilled” means incompleted or completed primary or incompleted
stands for the capital-labour ratio approximated with the net value of fixed assets per worker. Parameters of particular interest are the productivity elasticities with respect to l2 and l3, that is, the differences between skill groups defined on the basis of educational background and experience.8 The equations are estimated for a restricted sample of medium-sized and large firms. Restriction is required because we shift from individual to firm-level observations. Information on the internal composition of a firms' labour force is available on the basis of a ten percent random sample of its employees, so we have to restrict the attention to enterprises where the number of workers in the Wage Survey is large enough.9 Computations in the restricted sample were weighted. Weights were defined as the ratio of firms in the original and the resticted samples within groups formed by firm size and ownership.
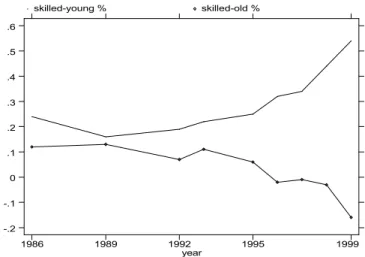
Figure 6 shows the time paths of the productivity yields attributed to young and old skilled labour:
βi(t) =∂ logy(t)/∂ logli(t). (2) The results suggest that the changes in the skill-related wage differentials at least partly reflect changes in relative productivity levels. The productivity yield that is attributed by the model to young-skilled labour input was rapidly growing in 1986–99 while the productivity of skilled-old labour input was declining in 1992–99, to a point that in the latter year it did not differ significantly from the productivity yield of unskilled labour (that was chosen as the base category).
Before taking these first results as a proof let us examine the productivity yields in more detail. If the appreciation of new skills is explained by the efficient matching of new technologies and young workers one would expect younger employees to be more productive and better paid in firms applying advanced equipment and new work standards. Ideally, one would like to study the experience-related differences in productivity and wages
secondary school. “Young” means experience less than the median experience, “old”
means median experience or more.
8 The functional form chosen for the productivity function assumes separability of inputs which may be evaluated as a strong assumption. In a recent study (Kertesi and Köllő 2001), estimating multi-factor demand models derived from the translog cost function, using the same firm sample and the same definition of inputs, we got results supportive of the conclusions drawn here.
9 This critical sample size on the level of a particular firm was 30 workers. By this restriction practically all firms with less than 300 workers are excluded from the analysis.
by comparing a 'modern' and an 'obsolete' sector distinguished using firm- level information. As a second best solution, since no enterprise-level information is available on technology, and industrial branches are too heterogeneous for a meaningful classification, we use foreign ownership to proxy the 'modern sector'.
year
skilled-young % skilled-old %
1986 1989 1992 1995 1999
-.2 -.1 0 .1 .2 .3 .4 .5 .6
Figure 6: Productivity elasticities of shares of different types of skilled labour (relative to the unskilled labour), 1986–99.
Regression coefficients from equation 1 (page 10).
Dependent: log of value added per worker. See Appendix 5
Majority foreign-owned enterprises constitute a sizeable part of the Hungarian economy: in 1999 they had 40.5 per cent share in employment, 51.2 per cent in fixed assets, 61.6 per cent in depreciation, 63.0 per cent in value added and 78.6 per cent in exports (taking all firms in the Wage Survey one hundred). Foreign-firm workers operate a relatively young equipment of unusually high value, in a most productive environment (Table 3). In addition they are required to adapt to the yet unfamiliar western corporate culture, many of them are expected to speak foreign languages, and undertake training courses repeatedly.10 Exceptions do exist (several foreign enterprises are known to have high demand for extended worktime and maximum physical effort rather than novel skills) but there
10 According to a recent survey comprising 264 domestic and 78 foreign-owned firms the former spent 2.4 per cent of their total investment on training while the latter spent 14.2 per cent in 2000. A difference of similar magnitude was observed in the Czech Republic by Filer et al. (1995) For an introduction of the Hungarian survey see EBRD (2000). The quoted figures have been calculated from the original data file.
is hardly better choice than this if one looks for a representative of 'modernity' in the contemporary Hungarian economy.
Table 3.
Foreign and domestic firms in the sample of earnings model 3 – Selected variables
Value added / workerc Fixed assets (net) / workerc Depreciation rateb do-
mestic foreign F-ratio domest
ic foreign F-ratio do-
mestic foreign F-ratio Year
1992 528 1,008 33.1 1,202 1,151 0.1n 0.113 0.132 1.2n 1993 769 1,540 63.5 1,889 2,524 2.3n 0.093 0.109 2.3n 1994 1,085 2,065 26.8 2,627 2,769 0.1n 0.085 0.119 20.4 1995 1,555 3,118 27.2 3,150 3,955 0.9n 0.096 0.131 16.7 1996 1,855 4,942 12.1 3,250 5,820 6.9 0.109 0.141 11.0 1997 2,804 6,022 25.2 4,815 7,804 7.4 0.115 0.149 19.5 1998 2,602 6,445 27.3 4,033 7,766 7.9 0.134 0.153 3.8 1999 3,368 7,529 28.6 6,308a 7,253 0.3n 0.151 0.181 6.4
aThree domestic firms reported extremely high capital/labour ratios (28 times the average) in this year. If these firms are omitted the domestic mean becomes 4,410 and F=10.8.
b Firms reporting a rate higher than one excluded. The number of excluded firms: 1 in 1994, 2 in 1992, 3 in 1996 and 1999.
c Million Ft.
n Insignificant at the 0.05 level. The F-ratios test the equality of the means by one-way analysis of variance.
Reestimating the productivity equation for domestic and foreign firms separately yields the results presented at Figure 7. The estimates cover the period 1992-99 during which the percentage of workers employed by foreign firms rose from 10 per cent to 40 per cent.
year skilled-young % skilled-old %
1992 1993 1995 1996 1997 1998 1999
-.2 -.1 0 .1 .2 .3 .4 .5 .6 .7
year skilled-young % skilled-old %
1992 1993 1995 1996 1997 1998 1999
-.2 -.1 0 .1 .2 .3 .4 .5 .6 .7
(a) foreign firms (b) domestic firms Figure 7: Productivity elasticities of shares of different types of skilled
labour (relative to the unskilled labour) by ownership, 1992–99.
Regression coefficients from equation 1 (page 10).
Dependent: log of value added per worker. See Appendix 5
At domestic firms we observe that a higher share of skilled workers is conducive to higher productivity but we find no difference related to the shares of young-skilled and old-skilled labour until 1996. Moreover, the productivity yields attributed to the young-skilled and the old-skilled were stable over time, at least until 1996. By contrast majority foreign-owned firms apparently acquire high productivity gains by employing young and educated workers. In foreign firms the contribution of young-skilled workers to the firm's productivity was markedly higher than that of older cohorts throughout 1992–99. Higher shares of old-skilled labour increased the productivity of a foreign firm in 1992 but the yields of this group were continously decreasing and fell even below the level estimated for the base category after 1996.
Foreign firms thus seem to play a leading role in the economy-wide rise of productivity gains from young, educated workers. Taking into account the widening productivity gap between young and old skilled labour in the economy as a whole on the one hand, and the aforementioned ownership- specific differentials on the other, one can conclude that the economy-wide increase was a result of pure compositional change until 1996. Foreign direct investment, and the more efficient matching of new technologies and new skills in foreign than domestic enterprises, was the driving force behind the appreciation of younger generations for half a decade.
The returns to skills in domestic firms started to follow the foreign-firm pattern only at the end of the nineties as shown by panel (b) of Figure 7:
during the three years between 1996 and 1999 the base differential in productivity yields of the two types of skilled labour almost tripled (growing from 0.14 to 0.40 by 1999).
percent
year
foreign skilled-old domestic skilled-old foreign skilled-young domestic skilled-young
92 93 94 95 96 97 98 99
20 30 40 50 60
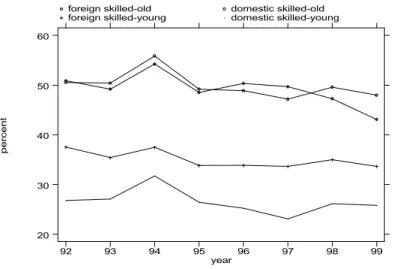
Figure 8: Wages at foreign and domestic firms.
See Appendix 4 for controls
The ownership-specific differentials in productivity are clearly reflected in relative wages. Consistently with the predictions of the productivity model young-skilled workers employed by foreign enterprises have higher wages relative to their unskilled and skilled-old colleagues than have their counterparts in domestic firms.11
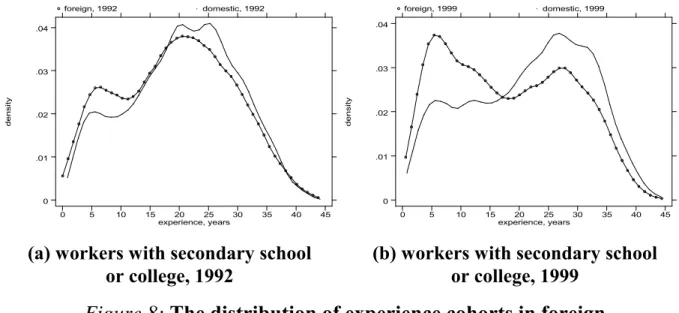
High demand for young, educated workers is also reflected by the age composition of the labour force compared across sectors.12 Foreign firms’
demand has been shifted towards the young cohorts since the times of the first observations as shown by the panels of Figure 8. The size distribution of experience cohorts compared across ownership were only slightly different in 1992, as yet, with skilled workers having 3-10 years of experience over-represented in foreign firms, but the equality of the distributions can be definitely rejected in 1999. The bias for the young- skilled is apparent from the shape of the curves.
11 These results stem from the simplified interactive regression models presented by Appendix 4.
12 Workers with college or completed secondary school.
density
experience, years
foreign, 1992 domestic, 1992
0 5 10 15 20 25 30 35 40 45
0 .01 .02 .03 .04
density
experience, years
foreign, 1999 domestic, 1999
0 5 10 15 20 25 30 35 40 45
0 .01 .02 .03 .04
(a) workers with secondary school or college, 1992
(b) workers with secondary school or college, 1999
Figure 8: The distribution of experience cohorts in foreign and domestic firms (1992, 1999)
Figure 8, however, calls the attention that the productivity advantage of skilled-young workers employed by foreign firms may be partly a result of a selection effect. Note that the demand shift towards the skilled-young did not imply increased demand for school leavers. The cohorts heavily over- represented in foreign enterprises are those with 3-10 years of work experience – a fact we are inclined to interpret as a sort of free riding. By employing skilled labour with some experience foreign firms may take advantage of on-the-job training investments by domestic employers. (So to say: they "skim the cream" of young skilled labour). Further research is required to separate the productivity effect from the selection effect.
6. CONCLUSION
The evolution of relative wages on the one hand, and of contributions to productivity on the other, leads us to the conclusion that skills obsolescence was, and still is, an important aspect of the post-communist transition.
Like most of the studies of Central and Eastern Europe we found a general rise in the returns to education between 1989 and 1992 when technological change was minimal, and the forces of the market just started to work.
This, we believe, was nothing else but a mirror image of the collapse of
demand for unskilled labour. When market institutions were already at work, and modern technologies started to flow in, the general appreciation of education stopped but the returns to experience continued to decline.
Technological renewal apparently contributed to the appreciation of young and educated labour in this period. We found that these workers are paid increasing wages and their skills actually worth more in a modern environment. By contrast, neither productivity nor wages grew for the older cohorts of educated workers after 1992.
REFERENCES
Burda, M. and C.M. Schmidt (1997): Getting behind the East-West German wage differential. Discussion Paper No. 250, University Heidelberg
Chase, S. R. (1997): Markets for communist human capital: Returns to education and experience in the Czch Republic and Slovakia. The Davidson Institute Working Paper Series, No. 109, Ann Arbor
EBRD (2000): Transition report 2000, chapter 5. EBRD, London
Fazekas, K. (ed.) (2000): Labour market report, 2000. (in Hungarian) MTA KTI
Filer, R., O. Schneider and J. Svejnar (1995): Wage and non-wage labour cost in the Czech Republic: The impact of fringe benefits. CERGE–EI, Working Paper Series 77, Prague
Flanagan, R. J. (1995): Wage structures in the transition of the Czech economy, IMF Working Paper WP/95/36, March
Franz, W. and V. Steiner (1999): Wages in the East German transition process – Facts and explanations. ZEW Discussion Paper No. 99–40, Mannheim
Kertesi, G. and J. Köllő (1999): Economic transformation and the return to human capital. Budapest Working Papers on the Labour Market, 1999/6, MTA KTI–BKE, Budapest
Kertesi, G. and J. Köllő (2001): Demand for unskilled, young skilled, and older skilled workers during and after the transition – Evidence on large firms in Hungary, 1986–99. Institute of Economics, mimeo
Krueger, A. B. and J. S. Pieschke (1995): A comparative analysis of East and West German labor markets before and after unification. In: R.
Freeman and L. Katz (eds.): Differences and changes in wage structures. University of Chicago Press, Chicago
Munich, D., J. Svejnar and K. Terrell (1999): Returns to human capital from the communist wage grid to transition: Retrospective evidence from Czech micro data. CERGE, Prague and The William Davidson Institute, Ann Arbor, mimeo
OECD (1993): Education at glance. Paris
Puhani, P. (1997): All quiet on the wage front in Poland? ZEW Mannheim, mimeo
Rutkowski, J. (1996): High skills pay off: The changing wage structure during economic transition in Poland, Economics of Transition, 4 (1), 89–112
Sakova, S. (1998): Changes and differences in earnings structures, unpublished thesis. Central European University, Economics Department, Budapest
Steiner, V. and L. Bellmann (1995): The East-German wage structure in the transition to a market economy, Labour, 9 (3) 539–560
Steiner, V. and K. Wagner (1997): East-West German wage convergence - How far have we got? ZEW Discussion Paper No. 97–25, Mannheim Vecernik, J. (1995): Changing earnings distribution in the Czech Republic:
Survey evidence from 1988–94. Economics of Transition, Vol 3. No.3., September
APPENDIX 1: THE WAGE SURVEY
The analysis basically relies on cross-sectional regressions using data from the National Labour Centre’s Wage Survey, waves 1986, 1989 and 1992- 99. The survey covers representative samples of firms employing 20 or more workers (10 or more workers in 1995–99) and 10 percent random samples of their workers. We restrict the analysis to workers in the business sector by choice. The number of enterprises observed in the survey grew from 4023 in 1986 to 13,585 in 1999. The number of individual observations in the restricted samples varies between 86,000 and 116,000.
The cases are weighted to ensure representativity. An individual weight (w1) stands for the number of workers represented by a respondent given the sampling quota within his/her firm. An enterprise-level weight, added by ourselves, is intented to correct the bias from firm-level non-response.
Comparing the composition of the target population and the sample by firm size and two-digit industry we attached weights (w2) to each size- industry cell. The compound weights (w1⋅w2) restore representativity under the assumption that non-response is uncorrelated with variables in the calculations.
The variables observed on the level of individuals include gender, age, level of education, occupation, and job grade. The firm-level variables include two-digit industry, location, firm size, ownership, and standard financial variables. Experience was approximated on the basis of age and the level of education (age – years in school – 6). Unemployment was measured at the Labour Office District level by dividing the number of registered unemployed by the labour force in 1990.
The earnings figures we use comprise all work-related payments made by the enterprise in May of the given year and 1/12 of the premia, bonuses and rewards paid in the preceding year. The statistics refer to gross earnings.
Appendix 2: Benchmark Mincerian earnings model (1986-1999)
Dependent: log of gross monthly earnings
Independent variables 1986 1989 1992 1993 1994
Constant 8,0504 8,4343 8,9185 9,0968 9,1676
Gender:
Male 0,2838 0,2995 0,2234 0,2317 0,2378
Schooling:
Vocational training school 0,1203 0,1157 0,1339 0,1323 0,1288 Secondary school 0,1359 0,1460 0,2197 0,2308 0,2194
College 0,3592 0,4410 0,5597 0,5971 0,5981
Experience:
Linear 0,0522 0,0514 0,0538 0,0482 0,0481
Quadratic/100 -0,2187 -0,2034 -0,2554 -0,2226 -0,2285 Cubic/10000 0,4654 0,4130 0,6259 0,5416 0,5760 Quartic/1000000 -0,4149 -0,3579 -0,6000 -0,5182 -0,5569 Occupation:
Non-manual 0,0957 0,1757 0,2218 0,2480 0,2451 Managerial 0,5436 0,8700 0,7505 0,7039 0,8334 Productivity:
log(value addded/worker) 0,0565 0,0808 0,1177 0,1615 0,1270 Negative value added -0,0601 -0,0681 -0,1099 -0,0903 -0,1068 Capital/labor ratio:
log(net fixed assets/worker)
0,0350 0,0225 0,0200 0,0168 0,0131 Firm size: (# of workers)
10 – 20 – – – – –
21 – 50 -0,0005n 0,0142n -0,0546 -0,0669 -0,0382 301 – 1000 0,0312 0,0478 0,0404 0,0582 0,1294 1001 – 3000 0,0502 0,0764 0,0716 0,1059 0,1822
3001 + 0,0772 0,0900 0,1294 0,1558 0,2318
Unemployment:
log(unemployment rate) – – -0,0553 -0,0714 -0,0811 Industry:
49 dummies, F-test 108,25 105,97 93,46 56,03 80,64 Region:
15 dummies, F-test 131,47 152,39 57,39 35,78 30,55
continue N. of observations 116205 111293 86935 85833 94639 Adjusted R2 0,4588 0,4639 0,5275 0,5058 0,5324
F– test 1033,11 881,07 940,88 825,08 898,97
Heteroscedasticity 710,19 1848,55 1574,00 1858,77 3702,04 Omitted variables 148,08 251,54 269,20 234,17 122,85 Normality of residuals 1579,83 3259,07 5397,33 7523,75 3833,55
If not indicated otherwise: significant at 0,0001.
* Significant at * 0,001 ** 0,05 n not significant.
Notes: OLS regressions with heteroscedasticity corrected standard errors.
Base categories: women; 8 classes; manual workers; firms with 51-300 workers.
Independent variables 1995 1996 1997 1998 1999
Constant 9,4365 9,5614 9,7322 9,7852 9,6720
Gender:
Male 0,2196 0,2025 0,1929 0,1921 0,2088
Schooling:
Vocational training school 0,1108 0,1303 0,1297 0,1220 0,1183 Secondary school 0,1882 0,1999 0,2101 0,2154 0,2069
College 0,5461 0,6004 0,6263 0,6342 0,6272
Experience:
Linear 0,0454 0,0549 0,0593 0,0646 0,0636
Quadratic/100 -0,2187 -0,3004 -0,3262 -0,3883 -0,3834 Cubic/10000 0,5394 0,8134 0,8705 1,0912 1,0734 Quartic/1000000 -0,4985 -0,8038 -0,8466 -1,1013 -1,0806 Occupation:
Non-manual 0,2142 0,2389 0,2281 0,2334 0,2491 Managerial 0,7453 0,8461 0,7979 0,8291 0,8021 Productivity:
log(value addded/worker)
0,1698 0,2170 0,1962 0,2256 0,2301 Negative value added – -0,0995 0,0319** 0,0543 0,1064 Capital/labor ratio:
log(net fixed assets/worker) 0,0174 0,0058* 0,0243 0,0072 0,0068 Firm size: (# of workers)
10 – 20 -0,2114 -0,2506 -0,2868 -0,2926 -0,2749 21 – 50 -0,1142 -0,1408 -0,1692 -0,1808 -0,1901 301 – 1000 0,0795 0,0784 0,0796 0,0981 0,1242 1001 – 3000 0,1176 0,1085 0,1405 0,1710 0,1884
3001 + 0,1673 0,1397 0,1202 0,1545 0,2179
Unemployment:
log(unemployment rate) -0,0839 -0,0843 -0,0725 -0,0831 -0,0970 Industry:
49 dummies, F-test 68,61 68,61 69,81 69,59 71,34 Region:
15 dummies, F-test 15,13 15,13 16,27 18,90 14,90
continue N. of observations 90717 97918 88208 102102 102547 Adjusted R2 0,5201 0,5472 0,5591 0,5710 0,5771
F– test 835,44 917,92 906,14 1192,02 1243,58
Heteroscedasticity 3551,24 5688,65 3435,75 4923,05 4894,68 Omitted variables 235,60 178,08 174,96 258,54 277,51 Normality of residuals 3547,12 3494,94 3515,77 3607,09 4534,56
If not indicated otherwise: significant at 0,0001.
* Significant at * 0,001 ** 0,05 n not significant.
Notes: OLS regressions with heteroscedasticity corrected standard errors.
Base categories: women; 8 classes; manual workers; firms with 51-300 workers.
Appendix 3: Augmented interactive earnings model (1986-1999)
Dependent: log of gross monthly earnings Interactive variables
education experience (years) 1986 1989 1992 1993 1994 MALES
vocational 0–5 -0,1004 -0,1313 -0,1136 -0,0747 -0,0665 6–10 0,1031 0,1009 0,0909 0,0878 0,1169 11–20 0,2088 0,1984 0,1902 0,1951 0,1972 21–30 0,2581 0,2555 0,2498 0,2516 0,2492 secondary 0–5 -0,1384 -0,1456 -0,0681** -0,0469 -0,0422**
6–10 0,0997 0,0801 0,1218 0,1280 0,1270 11–20 0,2256 0,2285 0,2655 0,2846 0,2635 21–30 0,3300 0,3448 0,3607 0,3699 0,3600 college 0–5 -0,0112n 0,0454*** 0,1572 0,2406 0,2295 6–10 0,2553 0,2676 0,3834 0,4528 0,4390 11–20 0,4315 0,4766 0,5579 0,5519 0,5619 21–30 0,5305 0,6014 0,6696 0,6886 0,6894 FEMALES
vocational 0–5 -0,2351 -0,2615 -0,2085 -0,1969 -0,2339 6–10 -0,1433 -0,1682 -0,1112 -0,1244 -0,1719 11–20 -0,0756 -0,1049 -0,0583 -0,0677 -0,0900 21–30 0,0078n -0,0198n 0,0249** 0,0263** 0,0015n secondary 0–5 -0,3709 -0,3900 -0,2374 -0,2243 -0,2432 6–10 -0,2080 -0,2571 -0,1052 -0,0997 -0,1215 11–20 -0,0685 -0,0983 -0,0174** -0,0168*** -0,0344 21–30 0,0805 0,0598 0,1224 0,1290 0,0899 college 0–5 -0,0698 -0,0927 0,1834 0,2101 0,1894 6–10 0,1155 0,1855 0,2896 0,3424 0,3419 11–20 0,2808 0,3570 0,4373 0,4980 0,4539 21–30 0,4246 0,4782 0,5436 0,6070 0,6159 male & female, experience > 30 0,2892 0,2879 0,3135 0,3200 0,3403
continue N. of observations 116205 111293 86935 85833 94639 Adjusted R2 0,3647 0,3998 0,5023 0,4802 0,5106
F– test 649,39 576,21 617,41 616,97 696,18
Heteroscedasticity 187,12 1234,89 1448,51 1628,16 3481,45 Omitted variables 52,10 129,37 159,93 185,28 80,83
If not indicated otherwise: significant at 0,0001.
* Significant at * 0,001 ** 0,01 *** 0,05 + 0,1 n not significant.
Notes: OLS regressions with heteroscedasticity corrected standard errors.
Base category: Education = primary (or less), irrespective to gender and experience Controls: same as in the benchmark Mincerian model (see Appendix 2)
Interactive variables
education experience (years) 1995 1996 1997 1998 1999 MALES
vocational 0–5 -0,0745 -0,0605 -0,0577 -0,0559 -0,0432 6–10 0,0771 0,0713 0,0564 0,0816 0,0808 11–20 0,1597 0,1663 0,1674 0,1668 0,1716 21–30 0,2199 0,2309 0,2353 0,2292 0,2251 secondary 0–5 -0,0788 -0,0893 -0,0816 -0,0622*** -0,0306 6–10 0,1060 0,1159 0,1087 0,1159 0,1287 11–20 0,2233 0,2291 0,2361 0,2507 0,2600 21–30 0,3217 0,3205 0,3301 0,3275 0,3309
college 0–5 0,1785 0,1956 0,2748 0,2775 0,3072
6–10 0,4097 0,4736 0,5312 0,5273 0,5777 11–20 0,5130 0,5564 0,5750 0,6220 0,6214 21–30 0,6238 0,6317 0,6691 0,6511 0,6842 FEMALES
vocational 0–5 -0,1985 -0,1803 -0,1607 -0,1513 -0,1351 6–10 -0,1142 -0,1184 -0,1014 -0,1065 -0,0716 11–20 -0,0777 -0,0718 -0,0660 -0,0655 -0,0629 21–30 -0,0114n 0,0148n 0,0052n 0,0076n 0,0077n secondary 0–5 -0,2363 -0,2397 -0,2282 -0,1879 -0,1857 6–10 -0,1231 -0,0982 -0,0693 -0,0540 -0,0587 11–20 -0,0454 -0,0556 -0,0190+ -0,0268* -0,0345 21–30 0,0592 0,0783 0,0934 0,0977 0,0815
college 0–5 0,2001 0,1725 0,2182 0,2345 0,2299
6–10 0,3774 0,3679 0,4161 0,4646 0,4584 11–20 0,4149 0,4348 0,4513 0,5025 0,4735 21–30 0,4988 0,5634 0,5942 0,5546 0,5268 male & female, experience > 30 0,2997 0,3061 0,3057 0,2907 0,2817 N. of observations 90717 97918 88208 102102 102547 Adjusted R2 0,4999 0,5303 0,5445 0,5570 0,5622
F– test 651,44 716,36 737,18 948,85 1006,96
Heteroscedasticity 3474,02 5645,25 3357,66 4934,77 4909,06 Omitted variables 182,43 138,21 156,04 237,19 236,07
If not indicated otherwise: significant at 0,0001.
* Significant at * 0,001 ** 0,01 *** 0,05 + 0,1 n not significant.
Notes: OLS regressions with heteroscedasticity corrected standard errors.
Base category: Education = primary (or less), irrespective to gender and experience Controls: same as in the benchmark Mincerian model (see Appendix 2)
Appendix 4: Simplified interactive earnings model (1992-1999)
Dependent: log of gross monthly earnings DOMESTIC FIRMS
Interactive variables 1992 1993 1994 1995
skilled-young 0,2675 0,2707 0,3170 0,2641
skilled-old 0,5053 0,5036 0,5586 0,4919
N. of observations 81301 75791 82768 65754
Adjusted R2 0,3927 0,3872 0,3811 0,3573
Mean ln(monthly wage) 9,8293 9,9952 10,2428 10,3331 Interactive variables 1996 1997 1998 1999
skilled-young 0,2517 0,2307 0,2613 0,2579
skilled-old 0,4888 0,4714 0,4959 0,4796
N. of observations 77733 68013 75415 75321
Adjusted R2 0,4031 0,4401 0,4424 0,4277
Mean ln(monthly wage) 10,5108 10,6838 10,8141 10,9606 FOREIGN FIRMS
Interactive variables 1992 1993 1994 1995
skilled-young 0,3753 0,3543 0,3745 0,3382
skilled-old 0,5089 0,4919 0,5422 0,4849
N. of observations 5493 9815 11490 24650
Adjusted R2 0,3992 0,4004 0,3919 0,3952
Mean ln(monthly wage) 10,0673 10,2099 10,4685 10,6292 Interactive variables 1996 1997 1998 1999
skilled-young 0,3385 0,3363 0,3496 0,3361
skilled-old 0,5032 0,4968 0,4723 0,4307
N. of observations 19814 20195 26687 27226
Adjusted R2 0,4196 0,4092 0,4435 0,4627
Mean ln(monthly wage) 10,8283 11,0455 11,2282 11,3634 Significant at 0,0001.
Notes: OLS regressions with heteroscedasticity corrected standard errors Skilled young: secondary or college, less than 22 years of experience Skilled old: secondary or college, 22 years of experience or more Base category: Education = primary (or less), irrespective to experience Controls: as in the benchmark Mincerian model (see Appendix 2) except
occupational groups.
Appendix 5: Productivity model (page 11) (1986-1999)
Dependent: log value added per worker ALL FIRMS
Independent variables 1986 1989 1992 1993 1994 Constant -2.2069 -1,5558 -1,2928 -1,2463 -1,3857 log share of skilled-younga 0,2418 0,1591 0,1894 0,2180 0,4025 log share of skilled-oldb 0,1175 0,1273 0,0723n 0,1069** 0,0170n log capital/labour ratioc 0,1822 0,2428 0,2145 0,1833 0,1354
N. of firms 971 748 600 567 506
Adjusted R2 0,2111 0,2170 0,1241 0,1736 0,2341 Independent variables 1995 1996 1997 1998 1999 Constant –0,8274 –0,4725* -0,4975** -0,5156* -0,6403n log share of skilled-younga 0,2510 0,3227 0,3441 0,4385 0,5442 log share of skilled-oldb 0,0623n –0,0180n –0,0111n –0,0291n -0,1600**
log capital/labour ratioc 0,2545 0,2834 0,3417 0,2897 0,3296
N. of firms 470 477 400 476 445
Adjusted R2 0,2666 0,3419 0,3665 0,4045 0,4069 If not indicated otherwise: significant at 0,0001.
Significant at * 0,01 ** 0,05 n not significant.
a Skilled-young: secondary or college, less than 22 years of experience
b Skilled-old: secondary or college, 22 years of experience or more
c Capital/ labour ratio: net value of fixed assets per worker
Dependent: log value added per worker DOMESTIC FIRMS
Independent variables 1992 1993 1994 1995
Constant –1,2976 –1,2451 –1,4589 –0,9548
log share of skilled-younga 0,1658* 0,1405* 0,3346 0,1157***
log share of skilled-oldb 0,0788n 0,1575* 0,0903n 0,1868*
log capital/labour ratioc 0,1982 0,1502 0,1040 0,1887
N. of firms 543 478 420 312
Adjusted R2 0,1104 0,1324 0,2071 0,1777
Independent variables 1996 1997 1998 1999
Constant –0,6556 –0,6073* –0,6085 –0,6675n
log share of skilled-younga 0,2431 0,2492 0,3103 0,3797 log share of skilled-oldb 0,0978n 0,0905n 0,1057*** –0,0060n log capital/labour ratioc 0,2257 0,2756 0,2121 0,2481
N. of firms 345 276 310 272
Adjusted R2 0,2923 0,3160 0,3518 0,3126
FOREIGN FIRMS
Independent variables 1992 1993 1994 1995
Constant –1,7159 –1,8830 –1,5904* –0,8008*
log share of skilled-younga 0,4548* 0,5979 0,6069 0,3721 log share of skilled-oldb 0,1748n 0,1018n –0,0461n 0,0514n log capital/labour ratioc 0,1800n 0,1874 0,3077 0,2397*
N. of firms 57 89 86 158
Adjusted R2 0,2601 0,4876 0,3612 0,3607
Independent variables 1996 1997 1998 1999
Constant –0,3343n –0,0804n –0,3491n –0,3780n log share of skilled-younga 0,3946 0,3015* 0,4657 0,4817*
log share of skilled-oldb –0,0642n –0,0308n –0,0824n –0,1499n log capital/labour ratioc 0,3424 0,3961 0,3517 0,4197
N. of firms 132 124 166 173
Adjusted R2 0,3881 0,3245 0,3390 0,3605
If not indicated otherwise: significant at 0,0001.
Significant at * 0,01 ** 0,05 *** 0,1 n not significant.
a Skilled-young: secondary or college, less than 22 years of experience
b Skilled-old: secondary or college, 22 years of experience or more
c Capital/ labour ratio: net value of fixed assets per worker