3.4 LONG-TERM TRENDS IN RELATIVE WAGES.
ARE THERE ANY SIGNS INDICATING SHORTAGE?
Éva Czethoffer & János Köllő
Wage increase has considerably accelerated in the last two years and many ex- plain it by the emergence of shortage. In 2016, there was an outstanding real wage increase near or at the level of earlier peaks (1994, 2001–2003, 2005), while the various shortage indicators have also started to grow rapidly.1 This does not necessarily imply that there is causality between the two phenom- ena. A possible causality is assessed through indirect effects in the subchapter (while Subchapter 3.3 analyses the direct relationship between certain short- age indicators and wages). We examined whether wages in the groups of work- ers and firms impacted more strongly by the changes on the supply side (head- count loss, emigration, retirement) or are “well-known” to be affected by labour shortage (skilled workers, manufacturing companies) increased more rapidly.
Wage growth was explored in two steps. First, we estimated individual wage equations from the millennium to 2016 and drew conclusions from the chang- es in the impact of individual and contextual characteristics on wages in order to examine the potential role of recruitment difficulties. Then, we evaluated the impact of enterprise characteristics, including workforce composition on annual enterprise-level wage increase. The study below only discusses the pa- rameter time series of variables suitable for (indirectly) identifying shortage;
the detailed results are available upon request in a Stata or Excel database. The research was restricted to the business sector.
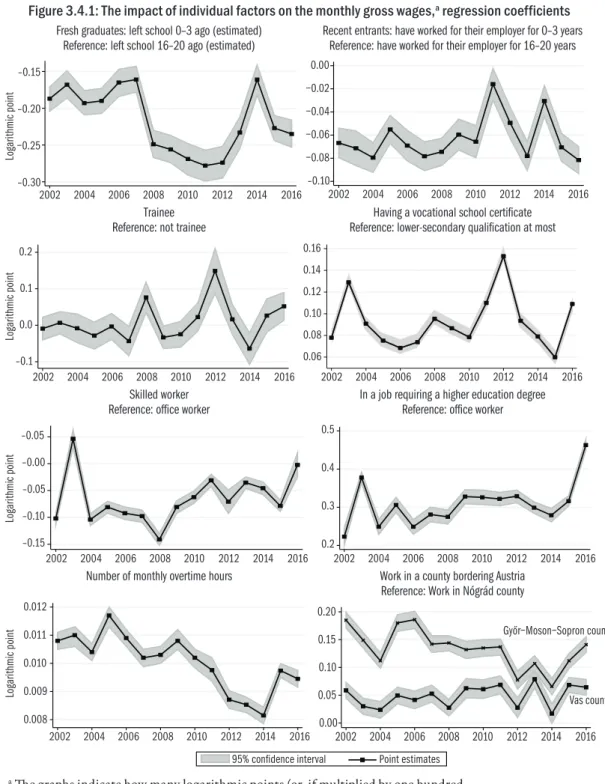
Figure 3.4.1 shows how the wages of fresh graduates, trainees, recent en- trants, those with a vocational school certificate, skilled workers and higher education graduates changed between 2002 and 2016. For more explanation on the graphs, see the note below the figure.
The wage disadvantage of fresh graduates relative to those in the labour mar- ket for 16–20 years ranged between 17–27 per cent and decreased in the pe- riod 2014–2016, compared to the period of the economic crisis and recov- ery, but it did not drop below the level seen in the 2000s. No marked break is observed in the period when complaints of shortage became more frequent.
Similarly, there is no marked break in the case of employees working for their present employer for a maximum of three years: their wage disadvantage rela- tive to employees working for their employer for 16–20 years ranged between 4–8 per cent, except for two years, and it has not decreased recently. A slightly growing trend is seen in the time series of trainees but the wages at the end of the period are not significantly different from wages in the early 2000s; ad- ditionally, there is no sharp change between 2013 and 2016, in the period of growing recruitment difficulties.
1 ��� ���� �������� ��� ��� ������� ���� �������� ��� ��� ����
���n ������ Statistical data.
–0.30
−0.25 –0.20 –0.15
Logarithmic point
2002 2004 2006 2008 2010 2012 2014 2016 –0.10
−0.08
−0.06
−0.04
−0.02 0.00
2002 2004 2006 2008 2010 2012 2014 2016
–0.1 0.0 0.1 0.2
Logarithmic point
2002 2004 2006 2008 2010 2012 2014 2016 0.06 0.08 0.10 0.12 0.14 0.16
2002 2004 2006 2008 2010 2012 2014 2016
–0.15 –0.10 –0.05 –0.00 –0.05
Logarithmic point
2002 2004 2006 2008 2010 2012 2014 2016 0.2 0.3 0.4 0.5
2002 2004 2006 2008 2010 2012 2014 2016
0.008 0.009 0.010 0.011 0.012
Logarithmic point
2002 2004 2006 2008 2010 2012 2014 2016
95% confidence interval Point estimates 0.00
0.05 0.10 0.15 0.20
2002 2004 2006 2008 2010 2012 2014 2016 Vas county Győr−Moson−Sopron county
Figure 3.4.1: The impact of individual factors on the monthly gross wages,a regression coefficients Fresh graduates: left school 0–3 ago (estimated) Recent entrants: have worked for their employer for 0–3 years
Reference: left school 16–20 ago (estimated) Reference: have worked for their employer for 16–20 years
Trainee Having a vocational school certificate
Reference: not trainee Reference: lower-secondary qualification at most
Skilled worker In a job requiring a higher education degree
Reference: office worker Reference: office worker
Number of monthly overtime hours Work in a county bordering Austria Reference: Work in Nógrád county
� Th� g��p�� �n������ ��w ��ny ��g�������� p��n�� (��� �f �u���p���� by �n� �un�����
��ug��y ��w ��ny p����n��g�) �� ��� g���� w�g� �f ��� ����g��y ��w�� �� ��g���
���n ��� ���� �f ��� ��f���n�� ����g��y. Th� �u�v� �n������ng ��� �ff��� �f �v������
���w� by ��w ��ny ��g�������� p��n�� �n� ��u� �f ��n���y �v������ �n�������
��� ��n���y g���� w�g�. Th� g��y ����� (��� ��nfi��n�� �n���v���) �n������ ���� ���
����ng�� �f ��� �ff��� �� ��������� �� b� b��w��n ��� ������ ���wn� w��� � 5 p�� ��n�
���k �f ������. A�� �ff���� ��� p������� ���� ��� ���y ��� v���� �f ��n������ng f�� ��� �����
f������. Th� �qu����n� ��n���n�� ��� f����w�ng v����b���: g�n���� ���� �p�n� �n ���
��b�u� ���k��� ���� �� ��p��y��� ��u�����n�� �����n��n� ��v��� ���up����n (b����
�n ��� �n����g�� ����� �f ��� Hung����n S��n���� C�����fi�����n �f O��up����n�)�
����n��� nu�b�� �f �v������ ��u��� p�������� ��p��y��n�� fix������� ��n������
��j����y f����gn �wn�����p �f ��p��y��� ������� ��un�y w���� ����� ��� �������. Th�
���������n �n�y ��v��� ��� bu��n��� ������.
N���: D�p�n��n� v����b��: ��g������ �f ��n���y g���� w�g�.
S�u���: W�g� Su�v�y�� 2002–2016.
The time series of the wage advantage of those with a vocational school certifi- cate (those who obtained a certificate not entitling them to higher education studies) does not show a growing tendency of relative wages, which would boost the supply of workforce with this level of qualification. At the same time, the wages of skilled workers began to grow strongly after the trough in 2008: their wage disadvantage relative to office workers (15 per cent) had com- pletely disappeared by 2016. A sharp change is observed in the wage increase of those working in occupations requiring a higher education degree (also com- pared to office workers) in 2015–2016.
Surprisingly, instead of a rise, there was a decline in the contribution of over- time to earnings: while ten hours a month overtime increased the monthly gross wage by 11 per cent in 2002, this effect decreased to 9 per cent in 2016, which is a small but statistically significant change.
Finally, wages (controlling for all other factors) did not increase among those working near the Western border, in Győr-Sopron-Moson and Vas counties, which are the most affected by commuting to Austria: wages in the former rose slightly but continuously, wages in the latter dropped slightly compared to the reference, Nógrád county.
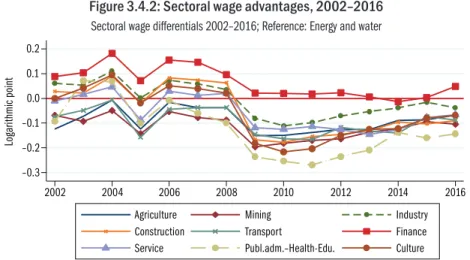
A separate figure presents trends in sectoral wage differentials, controlled for workforce composition, company size, ownership and geographical loca- tion (Figure 3.4.2). Two tendencies are worth noting: wage advantage in the financial sector decreased considerably after 2006 and the position of manu- facturing industry improved after 2012.2
Overall, there were only two cases when the tendencies in individual wages changed in a direction and extent that would imply that labour shortage may play a role at all: one is the increased the appreciation of occupations requir- ing a higher education degree, the other is improvements in wages in industry.
None of the other variables included either in the figures or in the analysis in general changed in a way that would suggest a strong relationship between the increasing occurrence of shortage and accelerating wage hikes.
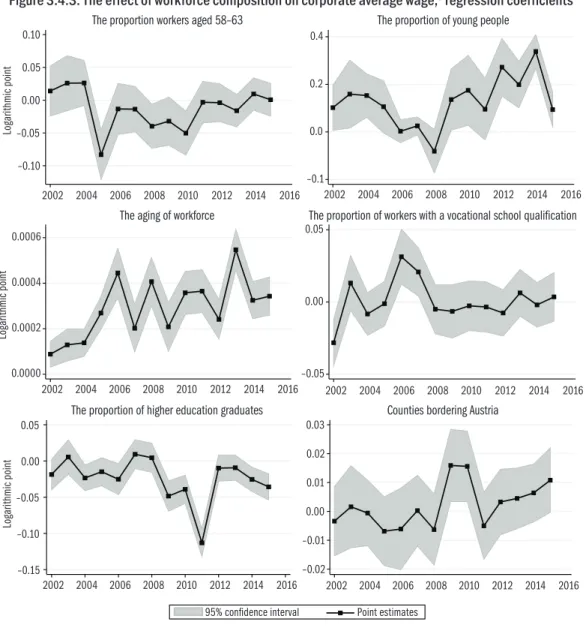
The enterprise-level regressions based on short (biannual) panel data explain changes in annual average wages from 2002–2003 to 2015–2016. The most relevant time series of parameters are included in Figure 3.4.3.
2 In ���� ���� w� ��� n�� p����n�
��� ��nfi��n�� �n���v��� f�� ���
p��n� ��������� f�� ��� pu�p����
�f ������y.
–0.3 –0.2 –0.1 0.0 0.1 0.2
2002 2004 2006 2008 2010 2012 2014 2016
Agriculture Mining Industry
Construction Transport Finance
Service Publ.adm.–Health-Edu. Culture
Logarithmic point
Figure 3.4.2: Sectoral wage advantages, 2002–2016 Sectoral wage differentials 2002–2016; Reference: Energy and water
Companies with many employees approaching the retirement age are more af- fected by the scarcity of supply. The effect of the higher proportion of elderly employees increased after 2005 but the period of more severe shortage did not have an impact on this tendency. The point estimates indicate an increase but the confidence intervals measured at the beginning and end of the period overlap, that is, the difference is not statistically significant.3
The proportion of young people was accompanied by above average growth rate of wages in the entire period of the analysis, except for one year. Com- panies employing more young people are impacted by fluctuation and emi- gration (increasing among young people) more than the average, which may have played a role in the acceleration of wage growth after 2008. However, the confidence intervals estimated for the years before and after the crisis also overlap in this case.
Labour turnover: when there is no churning, the average tenure of em- ployees increases by one year within a year – if the figure is higher, it indi- cates the aging of the company. This was accompanied by above-average wage growth during the entire period studied, which suggests the failure of efforts for ensuring supply rather than intentionally neglecting it. The rela- tionship grew stronger; however, not after 2013 but continuously over the whole period examined.
Firms employing more workers with a vocational school qualification raised wages at an average rate over the whole period examined (except for 2003–
2004). This pattern did not alter in the years of more frequent complaints of skilled worker shortage in 2013–2016. The effect of the proportion of higher education graduates did not change after 2013 either.
At firms with one or more sites in Győr-Sopron-Moson or Vas counties, point estimates suggest a gradual acceleration of wage growth but figures cal- culated for the beginning and end of the period do not differ significantly.
3 I� �� w���� n���ng ���� ��� �g�I� �� w���� n���ng ���� ��� �g�
�ng �f w��kf���� ��p���� ���
v����u� ���up����n�� ������� �n�
��g��n� ��������y; ��w�v��� �����
��� �x����� ��ff���n��� �� �n�
���p���� ��v��: �������ng �� ���
���� �f ��� N����n�� P�n���n In�u��n��� 60 p�� ��n� �f fi���
��v� n� ��p��y��� �pp������ng
��� ��������n� �g� (�g�� 59–63)�
w���� �� ��� �����n�ng 40 p��
��n� ����� p��p�����n �� ����
���n �w��� ��� �v����� �v���g�.
–0.10 –0.05 0.00 0.05 0.10
Logarithmic point
2002 2004 2006 2008 2010 2012 2014 2016 –0.1
0.0 0.2 0.4
2002 2004 2006 2008 2010 2012 2014 2016
0.0000 0.0002 0.0004 0.0006
Logarithmic point
2002 2004 2006 2008 2010 2012 2014 2016 –0.05
0.00 0.05
2002 2004 2006 2008 2010 2012 2014 2016
–0.15 –0.10 –0.05 0.00 0.05
Logarithmic point
2002 2004 2006 2008 2010 2012 2014 2016
95% confidence interval Point estimates –0.02
–0.01 0.00 0.01 0.02 0.03
2002 2004 2006 2008 2010 2012 2014 2016
Figure 3.4.3: The effect of workforce composition on corporate average wage,a regression coefficients The proportion workers aged 58–63 The proportion of young people
The aging of workforce The proportion of workers with a vocational school qualification
The proportion of higher education graduates Counties bordering Austria
� Th� g��p�� �n������ ��w ��ny ��g�������� p��n�� (��� �f �u���p���� by �n� �un�����
��ug��y ��w ��ny p����n��g�) w�� ��� �v���g� ���p����� w�g� g��w�� f����� ��
���w�� �� � ���u�� �f � �n� un�� ���ng� �n ��� �xp��n����y v����b��. Th� g��y �����
(��� ��nfi��n�� �n���v���) �n������ ���� ��� ����ng�� �f ��� �ff��� �� ��������� ��
b� b��w��n ��� ������ ���wn� w��� � 5 p�� ��n� ���k �f ������. A�� �ff���� ��� p�������
���� ��� ���y ��� v���� �f ��n������ng f�� ��� ����� f������. Th� �qu����n� ��n���n��
��� f����w�ng v����b��� n�� p����n��� �n ��� figu��: ��� p��p�����n ������ ��� p���
p�����n �f g���u���� f��� g�n���� upp�������n���y �n� v������n�� upp�������n���y
�������� ��� p��p�����n �f w��k��� �n ��n��u� w�g�� ��� p��p�����n w��k���
w��� � fix������� ��n������ ������un�� ������. Y�ung = fin����� ������ � ��x��u�
�f ����� y���� �g� (��������� v��u�). Th� �g�ng �f w��kf���� = ���ng� �n ��� �v���
�g� ���v��� ���� �n � y���. Th� y���� ��f�� �� b��� y����. Th� ���������n �n�y ��v���
��� bu��n��� ������.
N���: D�p�n��n� v����b��: ��� ��g������ �f ��� �nnu�� ���ng�� �n ���p����� �v���g�
w�g��.
S�u���: W�g� Su�v�y�� 2002–2016.
* * *
In conclusion, the data on relative wages, obtained from a large sample, do not indicate that labour shortage would play a decisive role in the rapid wage growth of recent years. Point estimates suggest rising wages among young people, in skilled worker positions and occupations requiring a higher edu- cation degree as well as in industry. They also show faster corporate wage in- crease at companies more affected by demographic replacement, staff turn- over and emigration but hardly any of the changes are significant and the point estimates indicate long-term tendencies instead of a sharp break in the years of worsening labour shortage. Although there have been several cases (e.g. in large shopping centres) of significant pay rises resulting from increas- ingly severe recruitment difficulties, these did not alter the Hungarian wage hierarchy until 2016.