At the same time, despite the low level of the FDI inflows in the Romanian economy, it seems that they are becoming more important as a source of capital. M – material, including the value of the raw materials and consumables (including power, water and other material expenses). S – subcontracted services, meaning the value of the works performed and services provided by third parties.
Consequently, the study of productivity means the interpretation of parameters λ, α, β, γ, δ in the context of equation (7). S – is part of the set of manufacturing firms (λ, α, β, γ and δ are considered constants for all firms in S). As mentioned earlier, the estimated values depend on the level of the factors, but not directly on.
The price indices should therefore change according to the NACE class (or subdivision) of the firm's main line of business. Corresponding to each firm, the geometric mean will be calculated for the NACE class (4-digit code) of the main business line of the firm. However, our concern is not related to the impact of major change in the ownership statute, but to the influence of the actual ownership-type characteristics on productivity.
The extent of use of tangible assets is different for each company and varies widely.
MODELS AND OUTCOMES DESCRIPTION
Model M3. Factorial analysis of production conditioned by the factor TP of prevailing ownership-type
The M3 model is compatible with the processed empirical data: the coefficient of determination has the value R2 = 0.960. The coefficient λ of the static TFP index (SITFP) is significantly higher for factor level 3 than for levels 1 and 2. The contribution of capital to the production function is significantly higher for level 3 than for levels 1 and 2.
Labor contribution to the production function is significantly higher for level 2 than for levels 1 and 3. Contribution of subcontracting to the production function is significantly higher for level 3 than for levels 1 and 2. THE EMPIRICAL ANALYSIS OF THE EXPORT AND FDI IMPACT ON THE ECONOMIC PERFORMANCE IN THE MANUFACTURE.
THE EMPIRIC ANALYSIS OF THE EXPORT AND FDI IMPACT ON THE ECONOMIC PERFORMANCE IN THE MANUFACTURING
Methodological note
This indicator compares the effects of the factor on the variables X and Y. 5) If statistic W(X:Y│f) has a component higher than 1, then it also has a component below 1. Thus, a higher than 1 value corresponding to the "i" level of the factor shows that the "i" level of the factor affects the X variable values to a greater extent than the Y variable values. More intuitive, but more vaguely expressed – the "i" level of the factor causes high values of the X/Y ratio.
To say 'For level "i" above average X/Y ratio values are obtained.' may be a suggestive description, but not an exact one, because of the disparity. So the following surprising position can appear: all three components corresponding to a specified subsection are higher than the corresponding components corresponding to another subsection - but this has no econometric significance.
The manufacturing industry: subsection level empirical analysis
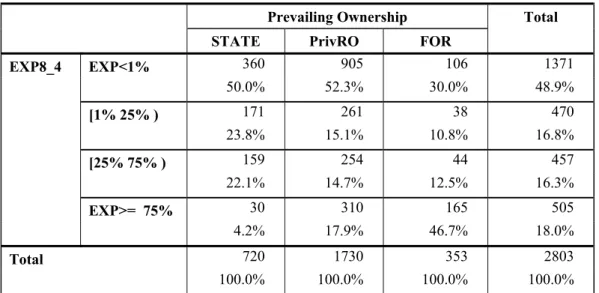
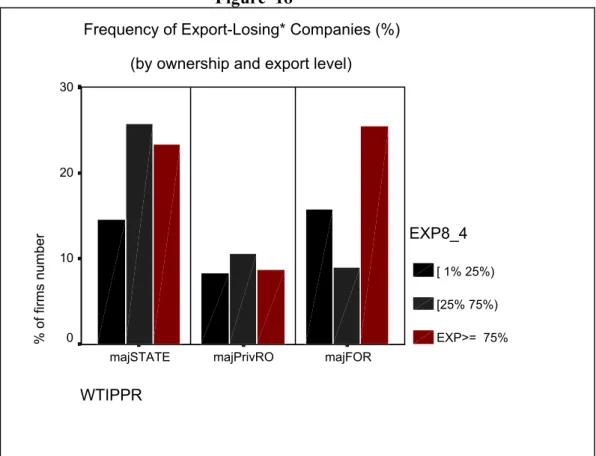
At the individual firm level, the frequency and intensity of export activities are maximum for FOR (see Table 1). Furthermore, the percentage of firms without any exporting activity is 30% for firms, but 50% for domestic firms (PrivRO or STATE). It should be mentioned that as far as the FOR sector is concerned, 25% of the firms that work mainly for export (more precisely: their exports exceed 75% of the turnover value) are losing exporters.
The available data (1400 companies) show that the ascending order of capital utilization level is: FOR, PrivRO and STATE. In fact, except for one statistically non-significant case, the median values for the percentage of imported material are higher for FOR companies in all subsections. In subsections EB and EC – subsections with the highest level of imported materials – the percentage of imported materials reaches 100%.
The weight of the imported material is high for the firms that systematically export. This increase is significant for the case of the firms whose exports exceed 50% of their turnover (see Figure 18). It cannot be ignored the variation of the percentage of imported material: it is maximal for the firms whose export exceeds 75% of their turnover.
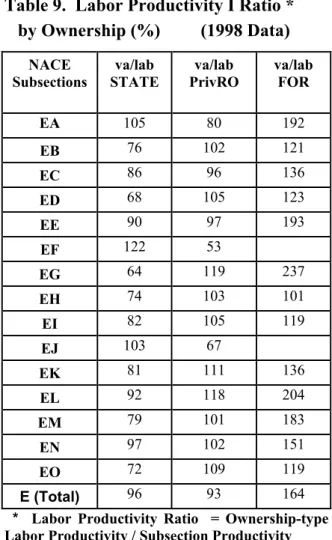
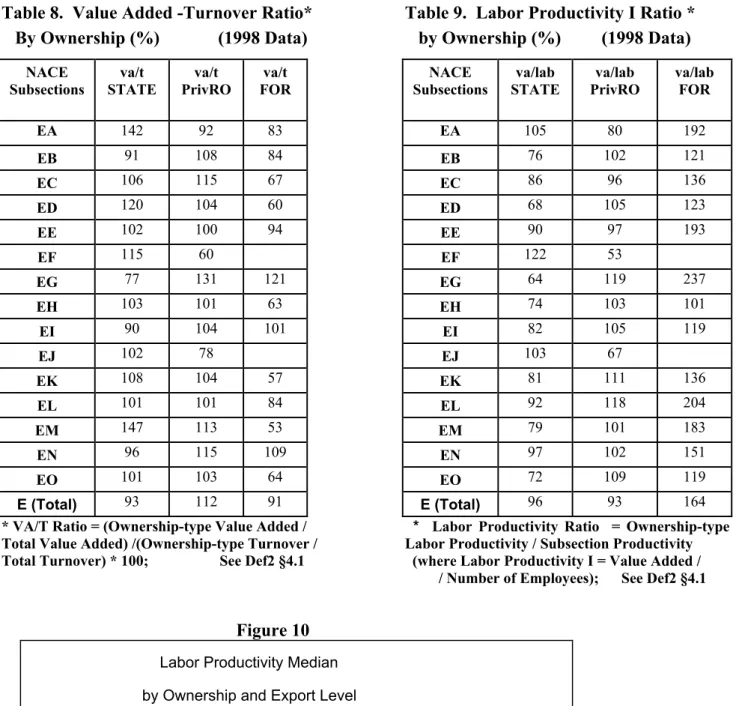
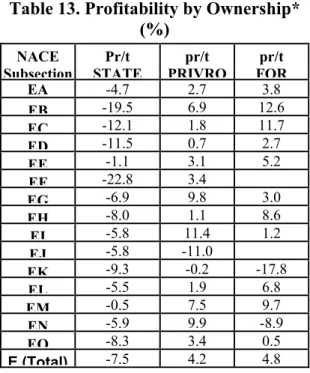
Moreover, in 10 out of the 13 presented subdivisions, the capital productivity ratio is the highest for FOR. The situation appears due to the high weight (30%, in the year 1998) of the metallurgy in the turnover of the Romanian manufacturing industry. In FOR sector and also – at a decreasing intensity – in PrivRO sector, the labor productivity decreases with the increase of the export weight in the turnover value.
The STATE sector has the highest aggregate ratio values in 9 subsections: EA, ED, EE, EF, EH, EJ, EK, EL and EM. At the aggregate level of the manufacturing industry, the ratio of the PrivRO sector is maximum and the ratio of the FOR sector is minimum. This does not contradict the above statement PrL2 regarding the high level of labor productivity of the FOR sector (productivity calculated in relation to VA).
CONCLUSIONS
Specific conclusions
At the firm level, the contribution of capital K to the production function is higher in private firms (PrivRO or FOR) compared to state-owned firms. This could mean a higher level of technology or a decrease in capital underutilization. At the company level, the contribution of labor to the production function is maximum in PrivRO companies.
At the firm level, the decreasing order of the contribution of materials M to the production function (expressed in the value of expenditure on raw materials, materials, energy and water) is STATE, PrivRO and FOR. Indeed, the weight of imported materials is significantly higher in FOR companies and systematically exporting companies. At the company level, the decreasing order of outsourcing the contribution to the production function is FOR, PrivRO and STATE.
The production function behaves quite similarly under the influence of the factors TP and EXP. There is no such agreement between the factors relating to labor L (exports and ownership type affect the L variable in a less direct way, through agency of corporate governance, expansion policies, etc.). The lack of agreement in case of L reveals that the two factors, even dependent on "the contact with the outside world", did not reduce to the latent factor.
At the firm level, labor productivity appears to decrease as the share of exports increases. This trend is particularly evident in the FOR sector (the sector with the higher productivity), but also – at a. S9.1 At the company level, the frequency and intensity of export activities is maximum in the FOR sector (see Table 1).
S9.2 At the aggregate level of the manufacturing industry, the export share in turnover is maximal in STATE sector. S9.4 The two-way factorial analysis (actually performed by us, but not described in this particular article) did not identify any significant interaction between the ownership type and export level. We can conclude that there is no synergy effect between export level and ownership type in the production function.
General conclusions
In addition, if there will be no new developments in the future to modify the trends identified in our paper, it is reasonable to consider that the future foreign investments in Romania, although significant, will have a lower macroeconomic impact than normally expected one. Aitken, Brian and Ann Harrison: "Do Domestic Firms Benefit from Foreign Direct Investment", Columbia University, mimeo. Oh, Bee Yan; Chung, Sukkyun & Roberts, Mark J.: "Productivity and the Decision to Export; Microevidence from Taiwan and South Korea", NBER Working Paper No.
Croitoru, Lucian, Doltu, Claudiu and Tarhoaca, Cornel “Conditions for Economic Growth in Romania”, Bucharest, The Institute for Liberal Studies, 1999. The Evidence with Implications for Developing Countries”, Fondazione Mattei, Milan, April 18-19 (a the subsequent alternative was published in World Bank Economy Review), 1998. Kalpern, Lazlo: “Comparative Advantage and Likely Trade Patterns of CEECs”, in: Faini, Riccardo and Richard Portes (eds.): European Union Trade with Eastern Europe: Adjustment and Opportunities, Center for Economic Policy Research, London.
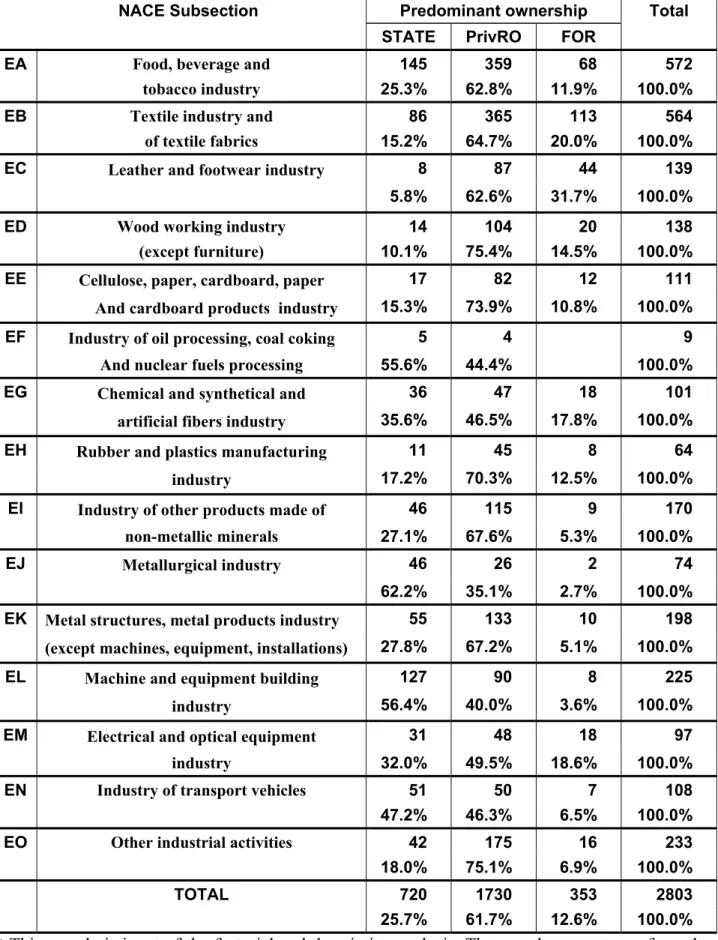
UNCTAD: "World Investment Report 1999 - Foreign Direct Investment and the Challenge of Development", United Nations, New York and Geneva, 1999. The sample of manufacturing enterprises at ownership and export level (manufacturing enterprises with at least 50 employees*). The sample percentages from the table can be used as unbiased estimates for the Romanian manufacturing industry, except for the EC section.
Labor Productivity Ratio = Ownership Type Labor Productivity / Subsection Productivity (where Labor Productivity I = Value Added / / Number of Employees);. Capital Productivity Ratio = ( Subsection Ownership Type Capital Productivity) /. Subsection Capital productivity) * 100 (where Capital productivity = Revenue / Fixed assets), Def2 §4.1. Property rights. Factorial analysis of the production conditioned by the factor EXP (3 levels) Estimated parameter values (see relation (9)).