EDUCATION AND THE LABOUR MARKET
Edited by
júlia varga
INTRODUCTION
Following the beginning of transition one of the key determinants of labour market changes has been the revaluation of education and experience. Th e upward shift in demand for educated labour has not only resulted in the rapid increase of the returns to education but it may explain – at least in part – the persistent low level of employment also. Th e increase in the returns to education has resulted in the demand for education showing considerable growth. Th ere was an expansion in education and the number and share of students following their studies at the upper secondary and higher level of education has increased substantially. Recently anxiety concerning over- education has arisen with some arguing that the composition of graduates by level and fi eld specialisation does not meet market demand.
Th e aim of the present set of studies was to collect the results of empirical research analysing the link between education and the labour market from diff erent aspects. Th e collection allows us to adopt a position on diff erent questions. Is the Hungarian labour force well educated by international comparison or not? What were the reasons for educational expansion? What are the labour market eff ects of the increase in educational participation?
What kind of changes could be observed in the transition from to school to work? During recent years important achievements have been attained in analysing these questions, but this collection also reveals the questions about which we have insuffi cient knowledge. Analysing some important problems – fi rst of all the eff ects of the transformation of the vocational training system – is aff ected by not only the lack of empirical research but also the lack of adequate data collection. Some sections of this chapter call attention to these problems.
Th e collection consists of fi ve sections. Section 1 investigates the connec- tion between educational attainment and labour market success in terms of earnings and employment. One of the most important developments of the last decade was the huge increase in participation in upper secondary and higher education and this is why three sections focus on the expan- sion of education and its consequences. Section 2 presents the magnitude of educational expansion and the results of research investigating if there is any observable evidence on over-education today in Hungary and if educa-
tional expansion has resulted in the distortion of quality. Section 3 presents fi ndings on the role of labour market information and expectations on edu- cational decisions. Section 4 focuses on diff erent aspects of school to work transition and labour market success of graduates. Finally, Section 5 dis- cusses connections between educational attainment and migration.
1. EDUCATION AND LABOUR MARKET SUCCESS 1.1 Education and Earnings
gábor kézdi
Th is short study looks at the returns to education in terms of earnings in Hungary, between 1989 and 2002.1 Since 1989, Hungary experienced not only a transition to a market economy but also an expansion in secondary and college education. Th erefore, a particularly interesting question is how returns to education changed during this period.
Our measure of earnings refers to main job total yearly earnings including overtime and bonus payments. Education is measured in four categories:
completed lower secondary school (általános iskola, 8 grades in Hungary) or lower; completed vocational training school without a baccalaureate exam (szakmunkásképző); completed upper secondary school with a successful
baccalaureate exam (középiskola); and completed college or graduate school.
Returns will also be estimated for education in years.
Figure 1.1: Schooling and standard deviation of log earnings
Earnings inequality has risen considerably since the fall of the communist system. Measured by the standard deviation of log earnings, inequality rose by more than 60 per cent between 1989 and 2002. Much of the increase
0 50 100 150 200 250
Within schooling groups StDev.
Between schooling groups StDev.
2002 1999
1995 1992
1989 0
10 20 30
R-squared Per cent
R-squared
Standard deviation of log earnings
1 Source of the data is the Wage Surveys of the National Labor Center (NLC). NLC Wage Surveys ask detailed earnings questions of a sample of em- ployees from fi rms and other establishments employing at least 5. Samples are large and the data contain basic demographics and can be matched with fi rm characteristics. See Kertesi and Köllő(1997) for details.
took place between 1995 and 1999. Figure 1.1documents the trends in the standard deviation of between-schooling level and within-schooling level log earnings. Both components increased for most of the period, but the former grew faster. As a result, the share of total variance explained by education (the R2 of a simple variance analysis) increased from 21 per cent in 1989 to 28 per cent in 2002.
Conceptual problems
Returns to education will be measured by standard OLS Mincer-type earn- ings regressions run on cross-sections of employees (see, for exampleWillis 1986). Before turning to the estimates, however, we need to clarify some
conceptual problems so that we can interpret the regression results and their year-to-year changes. Th e question of this section is whether our estimates are biased, and if yes, in what direction. Even more important is whether changes in the estimated returns are biased, and if yes, in what direction.
Th e fi rst issue is the general identifi cation problem of cross-sectional regressions. Ideally, one would like to measure returns to education in the following thought experiment. First, assign a certain level of education to an individual and measure her complete life-time earnings. Th en, start the whole thing over, and assign a diff erent level of education to the same individual and measure her lifetime earnings. Th e diff erence between the two earnings will then identify the causal eff ect of changing education level from the fi rst to the second, the eff ect we conveniently call the returns to education. In this thought experiment we can make sure the diff erence between the two earnings levels are due to diff erences in education only.
Th e thought experiment is, of course, impossible to carry out. Th e only way to identify returns to education is by comparing the earnings and education levels of diff erent individuals. In such cases we would like to control for all other factors that aff ect earnings (but are not caused by education). It is, again, impossible to measure all such factors. Interpersonal comparisons can therefore identify the true eff ect of education on earnings only if those unmeasured characteristics are uncorrelated with education, i.e. if education is exogenous in the earnings equation. Without a controlled experiment (in which assignment of education would be properly randomized) we can never be sure of that.
In standard Mincer-type regressions estimated by OLS, one controls for all measured characteristics that could be correlated with earnings.
Typically, 30 to 50 per cent of total (log) earnings variance can be explained by such regressions. Th e rest is due to unmeasured characteristics, luck, or measurement error in earnings. While the last two probably play an important role when we look at yearly earnings as opposed to complete lifetime earnings, unmeasured characteristics surely play a role. Unmeasured
factors that increase earnings (such as “ability” or “motivation”) tend to increase education as well. Th is distortion is labeled as “ability bias” in the literature (Williss 1986; Cardd1998). In plain words, it says that more educated people may earn more than others in part because they have unmeasured qualities that would make them earn more even if they had the same level of education. But since those unmeasured characteristics tend to help them attain higher education levels, it seems as though earnings diff erences were caused by to education. As Card (1998) showed, a reversed bias may also arise, especially if education is measured with some error.
He reviews evidence showing that OLSestimates may actually be right on target or actually biased downwards. Th e direction of the bias is still in general an open question.
Our estimates are based on establishment-level data; therefore measurement error may be of a smaller importance. As a result, we can expect standard ability bias to dominate ourOLS estimates, resulting in an upward bias in the estimated level of returns to education. On the other hand, the expansion of secondary, and especially, tertiary education led to a change in the ability distribution of more educated people, and this should have decreased the role of ability bias. When we look at changes in returns to education, therefore, our estimates probably underestimate the true increase.
Th is is, at least, what we can expect from ability bias. But there are other measurement problems that may aff ect our estimates
Th e second important issue is selection into employment. Our estimates refer to the earnings of employed people. Communist countries tried to make sure all people were employed, but even they could not arrive at literally full employment. When profi t motives and market forces took over however, many formerly employed people proved to be unemployable.
Th e least educated saw their employment prospects deteriorate enormously, while the most educated, especially the most educated men, stayed at nearly full employment. If our goal is to estimate expected returns to education for all people, keeping all other things constant, we should take into account the eff ect of education on the probability of employment, again, keeping other things constant.OLSestimates of expected returns to education are biased if selection on unobservables is important (“selection bias”). If among the less educated people, only the more able are employed, whilst all of the better educated people are employed, earnings diff erences between the two groups underestimate the expected returns to education.2
Employment fell sharply in the early years of transition. As a result, selection bias is most important when we compare estimated returns for those years. Measured changes of the returns between 1989 and 1995 therefore most probably underestimate the true increase in expected returns to education in Hungary.
2 Section 1.2 addresses the eff ect of education on employment probabilities.
Th e third issue arises because we can measure total monetary earnings from the main job only. Th e data at hand does not allow the measuring of fringe benefi ts or earnings from secondary jobs. Using household survey data on more detailed labor income, Horváth et al (2004) reinforce what is both theoretically plausible and supported by anecdotal evidence. Th ey show that in 2003, the better educated received a larger part of their labor income in non-monetary fringe benefi ts and they were also more likely to have a second job or additional sources of earnings.3As a result, this study most probably underestimates the eff ect of education on total labor income in post-communist Hungary. Unfortunately, we do not have comparable results for earlier years. Th erefore, we cannot assess the resulting bias on changes in the estimated returns.
Taking the above three considerations together, we cannot tell for sure whether returns to education estimated in this study are biased upwards or downwards. But selection bias and the ignoring of important parts of total labor income probably balance ability bias, and therefore our results are more likely to underestimate the true eff ects. As for changes in returns to education, the picture is more complex. Expected returns to education most probably rose more from 1989 to 1995 than our estimates show. Changes after 1995 are probably a lot less biased.
Specification issues
Th e regressions are estimated by OLS, allowing for arbitrary form of heteroskedasticity and within-fi rm clustering. Dependent variable is log yearly earnings, which allows us to compare slope coeffi cients without having to worry about wage infl ation. Th eNLC Wage Survey allows for controlling for a limited set of covariates. Besides education, the right-hand side variables include a gender dummy, industry, region, and settlement type dummies (of the fi rms), and estimated labor market experience and its square.4Regression estimates use the weights calculated by Kertesi and Köllő (1997). Un-weighted estimates are very similar.ő
Based on human capital theory, standard earnings functions relate years spent in school to earnings, in a linear fashion.Cardd(1998) shows that in the U.S., the linear functional form is a good approximation of a non- parametric returns function.Figure 1.2 shows that this is a bit less true 2 for Hungary. Th e linear approximation was a bit off in 1989, and it be- came worse by 2002. It is the 11-year vocational degree that has been the important outlier. Already at the end of the communist system, but even more so by 2002, vocational training provided substantially smaller returns than what the 11 years completed would predict. We shall report results from both the linear and the 4 education category specifi cation. Th e lat-
3Horváthet al (2004) use a special labor incomes module from the 2003 TÁRKI Monitor
p
Survey, a relatively small but very detailed household-level dataset.
Th eir estimates are not directly comparable to the ones presented in this study, both because of diff erent specifi cations, and more importantly, because the TÁRKI
p
survey contains self-reported labor income measures.
4 Labour market experience is es- timated by age minus modal age at highest completed education level. Th is overestimates actual labour market experience for those that had discontinued their employment career. Women and the least educated are consider- ably more likely to had done so.
Th erefore, returns to experience are estimated with a sizable bias for them.
ter is more correct a specifi cation, while the former is useful for interna- tional comparisons.
0.0 0.1 0.2 0.3 0.4 0.5 0.6
Schooling categories Linear
16 15 14 13 12 11 10 9
8 0.0
0.2 0.4 0.6 0.8 1.0
16 15 14 13 12 11 10 9 8 Years of completed schooling
1989 2002
Log earnings Log earnings
Figure 1.2: Returns to schooling, different functional forms. 1989, 2002
Dependent variable of Mincer-type regressions is log of earnings.5Coeffi - cients from such regressions are easy to interpret if they are close to 0: and estimated 0.01 slope coeffi cient means a 1 per cent increase in earnings if the right-hand side variable in question increases by one unit. Larger es- timates are more diffi cult to interpret. Letß denote the slope coeffi cient in which we are interested. Th e percentage eff ect then is (eee –ßß– 1)×100%, which is approximately 65 per cent if ßf = 0.5, and more than 170 per centß if ß = 1.0. When interpreting the results, we shall convert all slope esti-ß mates to percentage returns based on the above formula.
Estimated returns to education in Hungary, 1989 to 2002
Figure 1.3 shows estimated returns to earnings of three education levels, relative to completed lower secondary (8 grades) or less, between 1989 and 2002. Detailed estimates are inAnnex A.1.Percentage returns are estimated from dummy parameters on log earnings transformed the above mentioned way. Returns to completed vocational training has been 10 to 14 per cent, without a clear trend. Completed upper secondary school without further education increased from 30 per cent to 40 per cent. Returns to college or higher education increased dramatically: from 80 per cent in 1989, it ini- tially increased to 100 per cent by 1995, and reached almost 150 per cent by 2002. Most of the increase concentrated on the late 1990’s; the growth rate slowed down after 1999 but stayed signifi cant.
5 Th ere are at least two reasons for having a logarithmic left- hand side variable in earnings regressions. First, human capital theory interprets education as an investment. It relates oppor- tunity cost of one more year in school to alternative investments.
It is therefore the expected rela- tive increase in future earnings that should be weighed against the returns to other investments, proxied by the interest rate. Rela- tive returns are approximated in a logarithmic form in continu- ous-time decision morels. Th e other rationale for log earnings is a statistical one: earnings are close to lognormal, and therefore a regression on a logarithmic dependent variable is expected to produce more efficient es- timates.
Figure 1.3: Returns to schooling levels, relative to 8 grades
Linear specifi cation in years of schooling shows an increase from 7 per cent in 1989 to 12 per cent by 2002, an outstanding rate by international standards. Th e literature surveyed by Card (1998) estimates 6 to 8 percent returns.Figure 1.4 shows the estimates based on the linear specifi cation4 for the total population and also the youngest cohorts. Returns to educa- tion of the 30 to 34 year old group rose in accord with the overall increase.
Th e 25 to 29 year-old group experienced an even more substantial increase, from 4 to 11 per cent.
Figure 1.4: Returns to completed years of schooling
Figure 1.5 shows cross-sectional age-earnings profi les for 1989 and 2002.5 Th e fi gures are based on a quadratic specifi cation, and they show earnings
relative to the 16 year-old least educated employees. Th e fi gures highlight two striking phenomena. First, profi les of the diff erent education levels
0 30 60 90 120 150
College or more Baccalaureate
Vocational
2002 1999
1995 1992
1989
Return
Per cent
3 6 9 12 15
30–34 years old 25–29 years old
All employees
2002 1999
1995 1992
1989
Returns
Per cent
moved further away, in accord with the signifi cant increase of the average returns to education. Secondly, the cross-sectional profi les have fl attened considerably. Th e latter suggests another important consequence of tran- sition: the dramatic improvement of the relative position of the youngest cohorts, especially among the most educated. Th is phenomenon is a com- mon characteristic of most transition economies, as documented by Kézdi and Köllő (2000).It most probably refl ects downgrading of experience ac- cumulated in the communist economy.
0.0 0.2 0.4 0.6 0.8 1.0
College or more Baccalaureate
Vocational 8 grades
60 55 50 45 40 35 30 25 20
15 0.0
0.2 0.4 0.6 0.8 1.0 1.2
60 55 50 45 40 35 30 25 20 15 Age
1989 2002
Log earnings Log earnings
Figure 1.5: Age-earnings profile by educational attainment, 1989, 2002
Summarizing the results returns to education increased substantially in Hungary between 1989 and 2002. Young cohorts experienced an even steeper increase, and intergenerational diff erences decreased substantially, especially among the most educated. Taking all shortcomings of the data and estimation method into account, the results most probably underes- timate the true increase.
1.2 Employment and Educational Attainment in Hungary gábor kertesi – júlia varga
Although Hungary has successfully passed through the fi rst period of tran- sition and the economy has started to grow the employment level is still low and the rate of non-working (unemployed and inactive population) is extremely high by international comparison. Th ere is a more than 10 per- centage points lag behind theEU average in the employment rate. In this chapter based on the data of the 2001 census we will show that the main reason for the low level of employment in Hungary is that the low educated
have a larger share in the population than in theEU (15) average and that their employment probabilities are worse than in the EU.
It is very important both for employment and for education policy to determine the impact of the two components (the eff ect of the diff erence in the educational attainment of the population and the eff ect of the dif- ference in employment probabilities for workers with the same education- al attainment) on the overall lag in employment level. International com- parison of the educational attainment of the population is hindered by the diffi culties related to the classifi cation of educational programmes. Clas- sifi cation can be made using diff erent criteria.6As we want to analyse the connection between educational attainment and employment we have to classify educational programmes in such a way that within a group the ac- cumulated human capital of individuals are comparable and so they are similarly employable as they acquire similar skills and competences. In the following we will distinguish three groups: (1) those whose educational attainment is less than upper secondary school; (2) those whose highest educational level is upper secondary school; (3) those who have at least college education.
Th ere are diff erences in the educational systems of diff erent countries at all educational levels, but the main diff erences can be observed at upper secondary level regarding the duration and content of studies. In Hun- gary – similarly to most of the post-socialist countries – a large part of secondary school graduates, graduates from vocational training schools (szakmunkásképző) and vocational schools (szakiskola) has studied for less years7 and the content of their studies also diff ered from that of graduates from the other types of Hungarian secondary schools – gymnasiums (– gim- názium) and vocational secondary schools (szakközépiskola). When we are forming internationally comparable groups by educational attainment the most important question is whether vocational training schools correspond to upper secondary level or not.8
Depending on the allocation of vocational training schools to upper sec- ondary level or to less than upper secondary level educational attainment of the Hungarian population is very good in international comparison or on the contrary educational attainment falls behind theEU average (Figure 1.666). If we classify vocational training schools as upper secondary educa- tion, then the educational attainment of the 25–64 years old population is near to that of the most developed countries in the EU. Th en the share of those who have attained at least upper secondary level is above the EU (15) average by 6 percentage points and only Germany, Norway, Denmark, Sweden and Finland have better results. If we use the opposite classifi ca- tion (that is we classify vocational training schools to less than upper sec- ondary level) then Hungary is near to Italy concerning the share of popu-
6 In the ISCED classifi cation the level of an educational pro- gramme should be determined by its educational content. As it’s very diffi cult to directly assess and compare the content of dif- ferent educational programmes in an international comparative way ISCED–97 defi nes various criteria that should be used as proxies for the content of the programme. Th ese include the duration of the programme, typical entrance qualifi cation, type of subsequent education or destination, and programme orientation.
7 According to the data of the 2001 Census 6 per cent of those aged 25–64, who have vocational training school (szakmunkásképző) as their highest educational qualifica- tion have 10 years of schooling and 94 per cent have 11 years of schooling. In the same age group those whose highest educational qualifi cation is (former type) vocational school (szakiskola) 12 per cent have 9 years of education, 32 per cent 10 years of education and the remaining part 11 years of education.
8 In the ISCED classifi cation Hungarian vocational training schools are classifi ed as ICED3C type of education, that is they are classifi ed as upper second- ary education. Th ere is a wide variability in the duration and the level of content of ISCED 3C programmes and this leads to many problems in the inter- national comparability on the educational attainment of the population. (See for example:
OECD 1999:40–46.) In the fol- lowing we argue that the clas- sifi cation of 3 years vocational training schools to upper second- ary level distorts international comparability of educational attainment of the population and the investigation of the em- ployment rate by educational attainment.
lation with at least upper secondary level and there are only two countries which have worse results: Spain and Portugal.
Figure 1.6: The proportion of those who have atteined different educational levels as a percentage of the EU average by both classifications by gender, aged 25–64, 2001
Source: EU-OECD Education at a Glance 2003; Hungary, Census, 2001.
Th e choice between the two classifi cation possibilities shouldn’t be arbi- trary. One point of reference might be the comparison of completed years of education. Completed years of education is one of the measures of hu- man capital.9 If we compare cumulative years of schooling it turns out that for those who have fi nished Hungarian vocational training schools the cumulative years of schooling is below the average of upper secondary graduates in theEU (15) countries. For allEUcountries the cumulative years of schooling for upper secondary education is at least 12 years10 while for Hungarian vocational training schools graduates it’s not more than 11 years (for the older age-cohorts only 10 years).
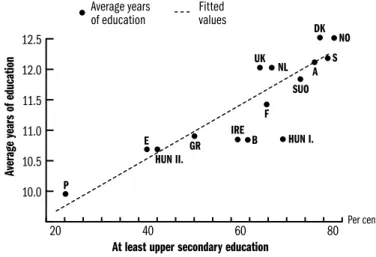
Figure 1.77shows the average completed years of schooling and the share of those who have attained at least upper secondary education and the pre- dicted years of schooling11inEUcountries and in Hungary according to both classifi cations. It can be observed that using classifi cation 1, that is if we classify vocational training schools as upper secondary education, then in Hungary the average actual completed years of schooling of the popu- lation are smaller by nearly one year than the predicted years of schooling.
In contrast if we use classifi cation 2, that is we classify vocational training schools as less than upper secondary education, then average completed
0 50 100 150 200
Higher education Upper
secondary Less than
upper secondary
2.
1.
2.
1.
Per cent
Men Women
9 Assuming that human capi- tal accumulation is linear and each additional year of educa- tion increases human capital by the same value. It is obviously a very restrictive assumption as school years at diff erent levels and types of education might raise an individual’s human capi- tal diff erently, and might result in diff erent returns. One solution for handling this problem is that the average level of human capital is related to the sum of years of schooling at diff erent levels weighted by the return to that level of education. (See for exampleWossman2001.) 10 In Austria, Denmark Ger- many and Italy it’s 13 years.
11 Predicted years of schooling are based on the ratio of the pop- ulation who has attained at least upper secondary education.
years of education is near to the predicted years of education. In the case of the use of classifi cation 1 the diff erence between actual and predicted years of schooling is about one, that is the diff erence corresponds to the diff erence in years of schooling between vocational training schools and other types of upper secondary education. In the average EU country hu- man capital of individuals whose educational attainment is upper second- ary school is greater at least by one year than that of individuals who have fi nished Hungarian vocational training schools. Th e comparison of the years of schooling attained and the share in the population who have at- tained upper secondary education seems to be an argument for classifi ca- tion 2 being better for international comparison.12
Figure 1.7: Average and predicted years of education and the proportion of the population aged 25–64 who have at least upper secondary education (per cent)
Source: EU-OECD Education at a Glance 2003; Hungary, Census, 2001.
For the decision between the two alternative classifi cations it’s worth ex- amining the judgement of the market, that is what is an upper secondary education worth in employment probability by international comparison.
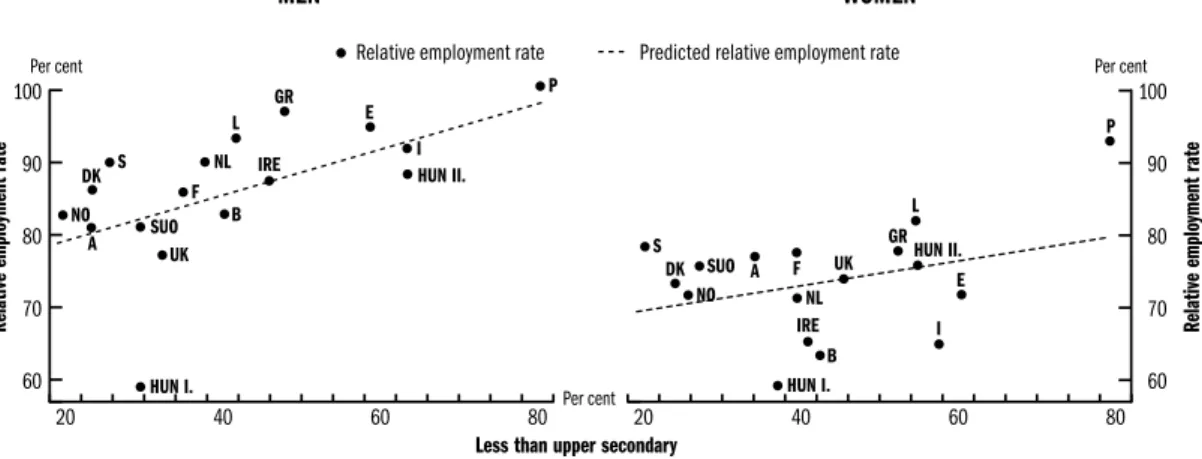
Figure 1.8 displays the relative employment rate8 13 of those who have less than upper secondary education, the share in the population of those who have attained at least upper secondary education and the predicted rela- tive employment rate of the undereducated by gender.14 Th e fi gure shows that where the better educated is the typical individual of a country (the higher the share of those who have at least upper secondary education) the worse is the employment probability of the undereducated. For example in Portugal, where the share of those who have attained at least upper sec- ondary level is the lowest, the employment level of the undereducated is near to the average employment level, while in Germany where the share
10.0 10.5 11.0 11.5 12.0 12.5
80 60
40 20
Average years of education
Fitted values
At least upper secondary education
Per cent
Average years of education
P
E HUN II.
GR HUN I.
F SUO
A S DK NO UK NL
IRE B
12 Diff erence in years of school- ing seems to underestimate the diff erence in accumulated hu- man capital between those whose highest educational attainment is upper secondary school or vocational training school as wage returns to upper second- ary education are 40 per cent while for vocational training school it is 10 per cent. SeeKézdi, Section 1.1.
13 Relative employment rate:
employment rate of those who have less than upper secondary education (the under-educated) as a proportion of the average employment rate.
14 Employment rate of women diff ers substantially from that of men in several countries (except- ing the highly educated) because of cultural reasons and because of diff erences in taking the re- sponsibility for child care.
of those who have attained at least upper secondary education the employ- ment probability of the undereducated is much worse than the average em- ployment probability. (Th e connection between the relative employment level of the undereducated and the share of those who have at least upper secondary education is more pronounced for men but it can be observed for women as well.)
100
90
80
70
60
80 60
40 20
Relative employment rate Predicted relative employment rate
Less than upper secondary Per cent
Relative employment rate
100
90
80
70
60 80 60
40 20
Relative employment rate
Per cent Per cent
MEN WOMEN
P
E HUN II.
GR
HUN I.
SUO A F S
DK NO
UK NL IRE
B L
I HUN I.
HUN II.
P I
GR E
NO A DK S
SUO UK
F NL
L
B IRE
Figure 1.8: Relative employment rate of those who have less than upper secondary education (aged 25–64) and their share in the population by gender
Source:OECD Employment Outlook; OECD Education at a Glance; Hungary, Census, 2001.
In Hungary the relative employment level of the undereducated is lower than the predicted level of their employment, but in the case of using clas- sifi cation 1 the diff erence between the actual and predicted level of em- ployment of undereducated is very large, while if using classifi cation 2 the actual level of employment of the under-educated is much closer to the predicted level.
Both the average completed years of education and the relative employ- ment level of the undereducated confi rms that the allocation of Hungarian vocational training schools to upper secondary level causes a large distor- tion in international comparison.
Changes in the supply side of the diff erently educated labour are fur- ther points in favour of classifi cation 2. Th ese changes can be observed as changes in demand for the diff erent educational programmes at secondary level. If there are no administrative restrictions in students’ choices then students’ will choose the secondary educational programme, which pro- vides the highest private return for them (earnings, employment probabil- ity).15 After the beginning of the transition16 the share in applications to secondary education programmes providing baccalaureate exam (gymna- siums and secondary vocational school) required for college or university
15 On the role of labour market expectations in choice between diff erent secondary educational programmes see Hermann, Sec- tion 3.1.
16 Administrative restrictions in enrolment to diff erent second- ary education programmes were terminated after 1989.
studies has increased considerably, while there has been a sharp decrease in applications to secondary training schools.17Changes in the composi- tion of the diff erent secondary education programmes have followed the changes of earnings gains and employment advantages of graduates from the diff erent secondary education tracks.18
In sum, based on the average completed years of education and on labour market changes it seems a reasonable assumption that for international comparison classifi cation 2 is more adequate, that is vocational training schools shouldn’t be allocated to upper secondary level.19It means that the educational attainment of the Hungarian population lags behind theEU average both in average completed years of education and in the share of the population with at least upper secondary education. Th e proportion of individuals who have completed upper secondary education in the popula- tion aged 25 to 64 years is smaller by 17 percentage points and the propor- tion of individuals who have tertiary education in the same age-groups is smaller by 8 percentage points than theEUaverage. Th e drawback in skills and competencies which are essential for labour market success might be even larger as the results of international adult literacy surveys show. (See OECDD2000).
In order to determine how much of the diff erential in the employment level can be explained by the diff erence in the educational attainment, we decomposed the diff erence in the employment level of men aged 25 to 64 between the EUaverage and Hungary (using classifi cation 2). Table 1.1 shows the results of the decomposition.20
Out of the 14 percentage points diff erence in the employment level be- tween theEUand Hungary only 2.1–3.6 percentage points can be attrib- uted to educated labour being less absorbed by the economy than in the EU. Th e bulk of the diff erence can be attributed to the employment prob- lems of those who have less than upper secondary education. A 3.5–5.2 percentage points lag is due to the quantitative lag, that is the low educated having a larger share in the population than in theEU, and the remaining 5.3–8 percentage points lag can be attributed to the low educated being less employed than in theEU. It means that the major part in employment diff erence can be attributed to the employment problems of the low-edu- cated. One of the main reasons for the worse employment probabilities of the low educated is the transport problems of Hungarian villages (see Köllő 1997; ő Kertesi 2000).i
Th e lag in the educational attainment of the population aged 25 to 64 will have a long lasting eff ect in employment as individuals who belong to these age-groups will be in the labour market for a long time, the youngest of them for more than 30 years. During recent years major changes have
17 Concerning changes in ap- plications to the diff erent second- ary educational programmes see Lannert, 2.1.
18 Returns to vocational train- ing have been 10 to 14 per cent without a clear trend, returns to upper secondary education increased from 30 to 40 per cent.
See Kézdi, Section 1.1.
19 Meantime programmes of vocational training schools have changed as has the name of that type of school. Th e new name of this type of secondary school is vocational school (szakiskola not to be confused with the old type of vocational schools which used to provide only 2-years vocational programmes). Th e duration of studies was extended to four years and the content of studies also has been changed.
Th ere has been no evidence on the eff ects of these changes yet.
In this analysis we investigate the educational attainment of those aged 25–64 who had fi n- ished their studies before these changes.
20 Th e standard Oaxaca-Blinder decomposition method was used.
See Annex A1.3.
taken place in educational enrolment. A larger share of the younger age-co- horts has been enrolled to secondary schools which provide baccalaureate exam, the length of studies has been lengthened to four years in vocational training schools,21 the ratio of students enrolled in higher education has increased and the expected years of education have also increased.Figure 1.9 shows average completed years of education and the expected years of 9 education based on the data of 2001. It turns out from the fi gure that in spite of the educational expansion Hungary is one of the countries where expected years of education are the lowest. Expected years of education are calculated using current enrolment levels and do not take into account drop-outs, so it does not show where the schooling career of a given co- hort really ends. Using stock data the share of a given cohort entering the labour market with low education level can be shown.Figure 1.100shows the share of those who entered the labour market with no more than lower secondary education as the highest educational attainment in the succeed- ing cohorts.22For the calculation 2001 census data were used.
Table 1.1: Decompostion of the 14 percentage points difference in employment rate between the EU–15 and Hungary
Components
Weights Education
level
Hungarian employment rate EU educational attainment
EU employment rate Hungar- ian educational attainment Difference
percentage points
Difference %
Difference percentage
points
Difference % Composition effect 5.2 36.8 3.6 24.7 Parameter effectt Low 5.3 37.5 8.8 60.6 Parameter effect High 3.7 25.7 2.1 14.7
Total 14.2 100.0 14.6 100.0
Figure 1.9: Average years of education and average expected years in education
16 17 18 19
12.5 12
11.5 11
10.5 10
P
HUN GR
F E
B SUO
UK
NL EU-átlag
A S
DK NO
Average years of education
Expected years in education
21 Since 1998 at vocational training schools students were enrolled onto four-year pro- grammes. The first classes of four-year programmes at voca- tional secondary schools fi nished their studies in the school-year 2001/2002.
22 Estimations were made for the 20 year olds in each cohort.
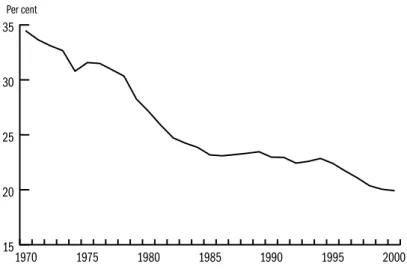
Figure 1.10: The share of under-educated (no more than old-type vocational education) in the population aged 20 (per cent)
Note: For example the estimation for 1981 was made with use of data of 41 year old in 2001.
Source: Census 2001.
Th e fi gure shows that the long-term trend of a decrease in the share of low- educated in the succeeding cohorts observed from the beginning of the 1970s came to an end in the mid 1980s. Between 1985 and 2000 at least 20 per cent of each cohort has entered the labour market without any qual- ifi cation.23 It means that the generation of the low educated still continues and the harmful consequences of this process will have an eff ect over at least the following thirty years.
1.3 Reallocation of Workers with the Higher Education Diploma, 1994–2002
péter galasi
Th e transition shock at the end of the ’80s has had a long-lasting impact on the labour market tendencies of the ’90s. At the beginning of the pe- riod – until 1993 –GDP and employment decreased, unemployment and inactivity increased. From the middle of the ’90s to the end of the decade GDPstarted to grow and employment still stagnated whereas unemploy- ment declined. At the end of the period, a slowing-down of GDPgrowth was coupled with decreases in both employment and unemployment.
Summarising the main results of papers studying the Hungarian labour market (Kertesi – Köllőő1995, 1997, 1999, 2002; Kézdi 2002; i Kőrösii1998, 2000, 2002), the transition process can be described as follows. Th e fi rst phase (until 1995 or 1996) of the transition shock resulted in massive job
15 20 25 30 35
2000 1995
1990 1985
1980 1975
1970 Per cent
23 In 2001 there have been about 340 thousand aged 20–29 year old young people in Hungary who had no useful qualifica- tion (at least vocational training school). Of these 55 thousand were full-time students, 55 thou- sand are on maternity benefi t grant. Th e remaining 200 thou- sand have already fi nished their studies. A quarter of them have been unemployed for at least 3 months and 87 thousand are job- less (unemployed and inactive).
destruction and a low level of job creation. A large number of older and less educated workers quit the labour market and the demand for educat- ed workers did not increase either. Th e second phase (until the end of the
’90s) was characterised by a massive restructuring of the economy, more and more modern jobs were created that represented a growing demand for educated workers. As a result, wage premiums for the young and bet- ter educated workers were considerably increased, and the labour market experience of older workers was devalued. An important fact is that in the second phase the labour demand for workers with the higher-education diploma and the wage premium for young and educated workers simul- taneously increased, meaning that despite the growing higher-education output – observed throughout the period – the supply of young educated workers was still inelastic. Th ese tendencies – described in the literature on the subject – could be observed up to the end of the ’90s.
Th ese tendencies are not consistent with the so-called qualifi cation-in- fl ation hypothesis (Green – McIntosh – Vignoless 1999) which states that employers are willing to hire more and more workers with the higher ed- ucation diploma – due to their higher productivity and/or lower training costs –, and as a consequence of an elastic supply of the better educated young, the number of workers with a higher education diploma increases but the value of higher education diplomas decreases resulting in negligi- ble (or no) wage premium.
On the basis of simple labour market statistics one can say that no change in trends detected by previous studies on the subject took place until 2002.
Employment is still slowly increasing,24 unemployment is declining,25 the number of full-time students in higher education exhibits a 150 per cent level of growth from 1994 to 2002,26 the proportion of better educated workers is still increasing while the proportion of poorer educated is de- creasing,27 the ratio of the monthly wages of those older workers with a higher education diploma to younger educated workers is declining, that of monthly wages of younger workers with higher education to those with high-school diploma is increasing – although the increases/decreases are slowing down over the last three years of the period in consideration.28Th ere are some signs, however, that the position of the educated young would be deteriorating at the end of the period. Th e rate of unemployment of those 20 to 24 years old with a college diploma increased from 3 per cent to 7 per cent between 1999 and 2002, and that of the 20 to 29 year olds with a university diploma more than doubled (from 3 per cent to 7 per cent) between 2000 and 2002 (KSHHLabour Force Survey). It is unclear whether this is due to the slowing down of theGDP growth, or a more elastic sup- ply of, or a decreasing demand for, educated workers.
24 Annual increases in employ- ment level are about 2 per cent in most of the years (KSH LFS).
25 5.8 per cent in 2002 from 10.7 per cent observed in 1994 (KSH LFS).
26 It amounts to 178 thousand in 1994, and 297 thousand in 2001(Statisztikai tájékoztató.
Felsőoktatás 2001/2002. Oktatási Minisztérium,Budapest 2002).
27 Th e proportion of employees with at most primary education decreases from 23 to 17 per cent, that of workers with a higher edu- cation diploma increases form 16 to 21 per cent (Wage Survey of the National Labor Center, ÁFSZ
p g y f
Bértarifa-felvétel).
28 Th e ratio of monthly wages of 36 year and older workers with higher education diploma to those of 25 to 35 year old workers with higher education diploma is 42 per cent in 1994, and 13 per cent in 2002. Th e same ratio for 25 to 35 year old workers with higher education and high school diploma increases from 47 to 73 per cent (Wage Surveys of the National Labor Center).
Th e work in this section focuses on the redefi nition of job requirements and the consequent reallocation of workers among jobs. Reallocation of workers due to increasing demand for educated workers might be detected if we simultaneously analyse changes in the wage premium for educated workers and their proportion among the employees. If both increase then it indicates inelastic supply of, and fi xed or increasing demand for, educat- ed workers, or relatively elastic supply of, and increasing demand for, edu- cated workers. If one can observe this pattern on the labour market one would conclude that some exogenous technical change induces employers to hire more educated workers for new jobs or jobs designed previously for less educated workers. At the beginning of the process the supply of edu- cated workers is relatively inelastic (it takes time for more educated cohorts to enter the labour market), this would result in increases in the wage pre- mium for the educated workers, the number of jobs where a wage premi- um is paid for educated workers, and the proportion of educated workers employed in jobs requiring higher levels of education. A high or increas- ing wage premium for the educated workers induces then potential and actual workers to obtain more education thereby resulting in a more elastic supply of educated workers that might in turn slow down the increase in or diminish the wage premium whereas more and more educated workers would fi nd jobs with higher-level education requirements.
We will analyse the reallocation problem between 1994 and 2002 on samples of workers with the higher-education and high-school diploma.
We consider four indicators: the proportion of workers with the higher- education diploma, that of jobs requiring such diploma, the proportion of workers with the higher-education diploma working in jobs requiring higher education, and the wage premium paid for workers with the higher- education diploma in jobs requiring it.
In order to analyse workers’ reallocation we have to classify jobs accord- ing to their skill requirements. Jobs and their skill requirements are how- ever unobservable. We assume that occupations are good proxies to jobs29 and that the occupational wage premium paid to workers with the higher education diploma in the given occupation captures the skill requirements of occupations. Occupations with a wage premium for workers with the higher education diploma are considered higher-education occupations (more exactly: occupations with higher-education requirements), other- wise the occupations are classifi ed as high-school occupations. Here we follow Gottschalk andk Hansen (2002) who assume that most occupations are heterogeneous in the sense that employers might hire workers both with higher-education and the high-school diploma for a given occupa- tion depending on the actual state of the labour demand and supply. If workers with a given education are heterogeneous in terms of their produc-
29 Due to sample-size limits we will use a three-digit oc- cupational classifi cation. Th is amounts to 77 to 97 occupa- tions in each of the years where workers with higher-education and high-school diploma are present.
tivity, then it might be that less productive workers with a higher-educa- tion diploma will be employed in occupations where they will obtain no wage premium as compared to workers with a high-school diploma. Th e same argument applies if the productivity of workers with a high-school diploma in a given occupation is higher than the average productivity of workers with a high-school diploma, since then workers with the higher education diploma might not realise any wage advantage in these occupa- tions. In these occupations extra schooling does not produce a wage pre- mium, thus they can be considered high-school occupations. If, however, employers pay more for workers with a higher-education diploma, this implies that extra schooling means additional skills and higher productiv- ity, therefore employers will be willing to attract better educated workers.
If the assumption of job-requirement redefi nition holds and the elasticity of supply of workers with a higher education diploma is not zero, then we would expect more and more workers with a higher-education diploma in these occupations, and at the same time we would detect the presence of a wage premium for these workers. Th e redefi nition of job-requirements might result in a reallocation process. Employers are more likely to hire workers with a higher-education diploma for these jobs. Whether they are able to realise this or not at a given wage premium would depend on the elasticity of supply of workers with a higher-education premium. If this supply is relatively inelastic, then increases in the number of workers with a higher-education diploma would be slow, and might be coupled with an increasing wage premium.
Another problem is the minimal wage premium to be applied. It would be obvious to choose some average observed value. Gottschalk and Hansen (2002) use a 10 per cent high minimum which is equal to the average re-
turns to college education. By analysing returns to education in 28 coun- tries,Trostel – Walker – Woolley (2002) fi nd a 10–12 per cent high average wage premium. From papers examining the transition period of the Hun- garian labour market we also know, however, that higher education yields much higher extra wages. We have chosen the average higher-education wage premium observed at the beginning of the period in consideration (1994) which amounts to 44 per cent. Th us occupations with at least a 44 per cent higher-education wage premium will be classifi ed as higher-edu- cation occupations.
We use the annual samples of the Employment Offi ce’s wage survey.30 In order to compute the occupational wage premium we have run earnings regressions for each of the occupations and for each of the years.31 We have specifi ed a simple, Mincerian-type earnings equation. Its dependent vari- able is the natural log of the monthly wage (before tax) that also includes one-twelfth of non-regular annual payments. Th e explanatory variables
30 Th e original annual samples include all the employees of the public sector and a 10-per-cent random sample for business sector units with more than 10 employees. Th e original samples have been re-weighted and they are now representative of the employees by industry and fi rm size. Th e actual annual sample sizes include 74 to 103 observa- tions. Th e author wishes to thank colleagues from the Institute of Economics of the Hungarian Academy of Sciences for making the data available.
31 Occupations with less than 100 observations have been ex- cluded from the analysis. It aff ects 2 to 4 per cent of the observations of the annual samples.
are: a highest-degree dummy (high school = 0, higher education = 1), po- tential labour market experience and its square, and gender. Th e parameter estimates of the education dummy are then considered as the wage premi- um.32With parameter estimates at hand we have examined the coeffi cients of each of the equations, and on the basis of the 44 per cent threshold we have classifi ed all of the occupations as higher-education or high-school occupations.33 Finally all the observations have been classifi ed as workers in higher-education or high-school occupations.
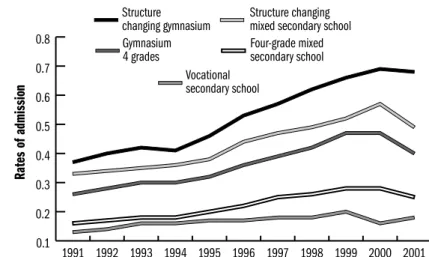
Results are displayed in Figure 1.11. Here one can fi nd four indicators:
(1.) the proportion of workers with a higher education diploma, (2.) the average wage premium for higher-education occupations – as a percentage, (3.) the proportion of higher-education occupations, (4.) the proportion of workers with a higher education diploma who are working in higher-edu- cation occupations.
Figure 1.11: The proportion of workers with higher education diploma, the average wage premium for higher-education occupations, the proportion of higher- education occupations, and the proportion of workers with higher education
diploma working in higher-education occupations, 1994–2002 (per cent)
Th e results might be summarised as follows. Th e proportion of workers with a higher education diploma has continuously and slowly been in- creasing from 32 to 39 per cent. Th e proportion of higher-education oc- cupations seems rather stable until 1997, and then it exhibits a quite rapid growth, the value of this indicator more than doubled between 1997 and 2002, from 12 to 31 per cent. Initially the wage premium associated with higher-education occupations was 55 per cent – a substantial extra pay for extra schooling –, then it starts increasing – fi rst slowly then very rap- idly – until 1998, when it peaks at 73 per cent. Between 1998 and 2002 the premium displays a ten-percentage-point high decrease, but at the end
10 20 30 40 50 60 70 80
Average wage premium for higher-education occup Workers with higher educat Workers with higher educat working in higher-education Higher-education occupatio
2002 2001 2000 1999 1998 1997 1996 1995 1994 Per cent
32 Earnings equations have been estimated by OLS and robust standard errors. Th is might pro- duce biased coeffi cient estimates, due to selectivity, endogeneity or simultaneity problems (See Heckman 1979;Mroz 1987; z Card 1998, 2001).
33 We have used the standard – 5 per cent – level of signifi - cance for deciding whether the estimated coeffi cients are zero or not. At the same time we have examined the educational distribution of each of the oc- cupations with non signifi cant parameter estimates, since zero coeffi cients might be resulted from the distribution itself. We have found some occupations with non-signifi cant parameter estimates where the proportion of workers with a higher education diploma has been 94 to 100 per cent, and these have also been classifi ed as higher-education occupations.
of the period it still higher than 60 per cent. Th e proportion of workers with a higher-education diploma employed in higher-education occupa- tions decreases between 1994 and 1997 (from 25 to 20 per cent), then it almost triples from 1997 to 2000, fi nally it hits its highest level in 2002 with 78 per cent.
Our results are in line with the fi ndings of previous works on the sub- ject referred to above. Between 1994 and 1997 growing higher-education output is coupled with a decreasing proportion of both higher-education occupations and workers with a higher education diploma employed in higher-education occupations, whereas the wage premium starts increasing in 1996. Th is implies increasing demand for more educated workers and inelastic supply. Th e supply becomes more elastic from 1997, and it results in increases in the proportion of both higher-education occupations, and workers with a higher education diploma employed in higher-education occupations. More elastic supply pushes down wages for higher-education occupations (from 1998), as well. At the end of the period one can observe a very high proportion of good occupation/education matches for workers with a higher education diploma, and a relatively high wage premium.
2. EDUCATIONAL EXPANSION 2.1 Facts on Expansion of Education judit lannert
The expansion of secondary education
Th e structure of public education and the possible ways of progression with- in the system have considerably changed in recent years. Th ese changes in the horizontal structure of public education have been forced by theex- pansion of upper secondary education.34
A rapid increase in the number of full-time upper secondary school stu- dents started in the second half of the eighties. Between 1985 and 1990 the number of those continuing their studies in upper secondary education increased by nearly 20,000 – from 60,000 to 80,000. Th is increase in ab- solute numbers meant stagnation in relative terms, as there was, behind it, a growing population. Starting from the 90s the number of those enrolled in upper secondary schools barely changed nevertheless the rate of those enrolled grew while the student population rapidly fell.
Th e main engine of expansion was the growing interest in upper second- ary schools. As a consequence of structural changes and the general crisis in the training sector and its restructuring, the number of those enrolled in vocational training schools has decreased considerably. In line with this the interest in upper secondary education leading to the baccalaure- ate exam (school-leaving certifi cate required for higher educational stud- ies) has grown, the proportion of those entering education leading to the baccalaureate exam has increased, that is to say the expansion of second- ary education got under way spontaneously. By the end of the nineties, as a result of restructuring, 70 per cent of those entering upper secondary education chose upper secondary schools with a programme leading to the baccalaureate exam.
In the early nineties only one fourth of upper secondary school students attended general secondary schools (gymnasiums) one-third attended vo- cational secondary schools and more than 40 per cent attended vocational training schools. In the school year 2002/2003 30 per cent of secondary school students attended general secondary schools (excluding students
34 Several interpretations of ex- pansion of upper secondary edu- cation are possible. Expansion on one hand can be interpreted as an increase in the enrolment in upper secondary education or as an increase in the number of students in upper secondary schools, moreover of those with upper secondary qualifi cation (baccalaureate exam). On the other hand expansion can have an absolute and a relative inter- pretation. In absolute terms it may be an increase like in up- per secondary school enrolment while in relative terms there is no increase in the proportion of a given age cohort. Th e same may be true for the opposite case when enrolment does not increase in absolute terms but there is an increase in relative terms when a larger proportion of a given age cohort enters upper secondary education.