Workfare Society in Action – the Hungarian Labour Market and Social Conditions in European Comparison
Annamária Artner1
Abstract: This paper aims at investigating the achievements of Hungary’s “work- based society”. Based on statistical data, it examines the characteristics of the Hungarian labour market and the development of social indicators over the past decade in comparison with the European Union and the Central and Eastern European member states. As there are improving tendencies during recent years on a regional level, the relatively good employment situation of Hungary cannot be considered as an outlier. While the Hungarian labour market conditions have been improved to some extent, some characteristics, like the level of wages and productivity are rather lagging behind the regional average. Due to policy changes since 2010, the social protection of the most vulnerable declines and, concerning the increase of income inequalities, Hungary is a regional “leader”. The article concludes that in order for such a social welfare regime to help social inclusion and serve social equality, a reconfiguration of the economic, as well as political governance, is needed.
Keywords: Central and Eastern Europe, Hungary, labour market, welfare, workfare JEL: E24, D63, I3, J3, J8
Introduction
In Hungary, the shift of power in 2010 to the conservative political forces (the Alliance of Young Democrats, the FIDESZ, in coalition with the Christian Democratic People’s Party, the KDNP) took place after the global crisis and its management and was as a response from the population to the social consequences of the previous neoliberal economic governance. The Prime Minister Viktor Orbán defined his political course in Tusnádfürdő (Băile Tuşnad, Romania) in 2014 as national and illiberal: “until now we have known three forms of state organisation: the nation state, the liberal state and the welfare state. And the question is, what’s next? The Hungarian answer to this question is that the era of the work-based state is approaching. We want to organise a work-based society that, as I have just mentioned, undertakes the odium of stating that it is not liberal in character. (…) the Hungarian nation is not simply a group of individuals but a community that must be organised, reinforced and in fact constructed. And so in this sense the new state that we are constructing in Hungary is an illiberal state, a non-liberal state.” (Orbán 2014). In 2015, at an international conference he clarified further: “… it is a labour-based or workfare society (…) We don’t pay social welfare if we haven’t got something from the people for that. We have a flat tax. We have probably one of the lowest small and medium size company corporate tax level. We don’t have inheritance tax
1Annamária Artner is senior research fellow at the Institute of World Economic of the Centre for Regional and Economic Studies, Budapest. E-mail: artner.annamaria@krtk.mta.hu.
or that kind of things, so it is a strange combination.” (Keszthelyi 2015, Orbán 2015) In this spirit, the FIDESZ-KDNP government has made lots of changes in the economic governance, which resulted in an over centralization (Lakner & Tausz 2016). The social policy framework has lost its “welfare”’ character, which has already been weakened by the previous governments and has been diverted from “welfare” to
“workfare” by shortening the period of unemployment benefit to three months and replacing almost all labour market policies – including training and education – for the public works scheme.
Recent studies have not painted good picture about this policy. Scharle & Szikra (2015) point out that although the erosion of the Hungarian welfare system has not begun with the illiberal conservative governance, given that both the availability and generosity of welfare provisions and workers’ rights and social partnership consultations have declined already since 2006, the process has definitely accelerated after 2010. Based on the treatment of the most vulnerable groups (e.g. long term unemployed, disabled and homeless people), Lakner & Tausz got to the conclusion that this “new atypical workfare”
policy can be defined as a “punitive prisonfare regime” (Lakner & Tausz 2016:348).
Szikra (2018) has found that the pension reform of the FIDESZ-KDNP government favours the better-off against the most vulnerable pensioners and its family policy makes a sharp division between the so-called “responsible” (hard working, deserving) and
“irresponsible” (undeserving) families. Similarly, Scheiring & Szombati (2019) considers that the new system follows a “Social Darwinist logic of supporting people who conform to the ideal of biological-cum-economic productivity and withdrawing support from those who do not”.
Our research adds to these an international comparison based on statistical data. The research question is how this workfare has affected the standard of living of the Hungarian population and its different groups in comparison to other European countries’ achievements.
In what follows, the first chapter summarizes the economic performance of Hungary, the second chapter examines its labour market (employment conditions, labour productivity) while the third part of the article is focusing on the social aspects. In all the three cases, the relative positions of Hungary within the – until 2020 – 28-member European Union (EU28)2 and, especially, among the 11 Central and Eastern European Member States (CEE11) will be presented.
Economy
The government-controlled Hungarian media often emphasise that “Hungary performs better”. Indeed, after 2013 the growth of the Hungarian Gross Domestic Product (GDP) has accelerated. Recently, even the Executive Directors of the International Monetary Fund (IMF) commended the country’s strong economic performance and decreasing financial vulnerabilities (IMF 2019:2). However, the IMF-report has not made any international comparison.
2 Until 2020, i.e. in the period concerned by this research, the United Kingdom has been a member of the European Union, therefore we use aggregate numbers of the 28-member EU.
Between 2010 and 2019, the growth of the Hungarian GDP was the seventh largest in the EU28 and in the last five years it took the sixth place after Ireland, Malta, Romania, Cyprus and Lithuania (Eurostat 2020a). However, it must be emphasized that this dynamism could not have been achieved without the financial support of the European Union. Hungary gets EUR 25 billion from the European Structural and Investment Funds over the period 2014-2020. This represents an average of 2,532 euro per person, which is the fifth largest value within the EU28 after the Baltic States and Slovakia (EC s.a.).
The acceleration of economic growth has resulted in some catching-up process.
In 2010, the Hungarian per capita GDP in PPS was equal with 64.7 percent of the EU28 average and this ratio increased to 71.1 percent by 2018. However, this does not mean that the country could improve its relative position within the EU: based on the GDP per capita (purchasing power standard, PPS) Hungary was the 22nd in the row both in 2010 and 2018. Furthermore, Hungary’ position has been slightly deteriorated within the Central and Eastern-European region. In 2010, the Hungarian GDP per capita in PPS was the fifth highest within the CEE11-group and slipped to the sixth place in 2018.
Lithuania has left Hungary behind and Poland has almost caught up with it (Eurostat, 2020b).
So, until now, the “workfare” has not proved to be extraordinarily successful in economic terms. But how has it affected the population?
Although calling itself “illiberal”, the Hungarian conservative government has continued and even strengthened the neoliberal policy course of the previous decades.
This means encouraging foreign direct investments with billions of HUF as state subsidies (The Budapest Beacon 2016), very low corporation tax rate, capital-friendly employment conditions, like increased supply of low-skilled labour as the age limit for education was reduced from 18 to 16 years, growing flexibility of labour market via changes in the Labour Code, more recently with the overtime regulation, known as “Slave Law” (BBC 2018, Karasz & Kingsley 2018) and the repression of labour unions. These have been completed by the reduction of welfare spending and support to national capital. The minimum wage has also been raised, but the government has compensated the employers for that with decreasing social contribution and corporation tax rates. All in all, the actions of the government have been more beneficial for the capital (both foreign and national) than to the working class.
These developments, together with the extended public works scheme, the improving economic climate after the crisis and the outflow of the working power to other EU Member States after the removal of the obstacles for workers from Central and Eastern Europe in 2011, resulted in a rising employment rate, and pushed up the revenue of the working population, although very unevenly and without helping the social mobility.
In the following sections, I examine whether the “workfare” proved to be better for the working people and their families than other policy courses in Europe. For this, first I present the main indicators and trends of the Hungarian labour market and social conditions compared to that of the EU28 and the CEE11 based on data from the Eurostat and the STADAT system of the Hungarian Central Statistical Office (HCSO).
The period following the crisis of 2008 will be examined mainly, but, in certain cases,
some earlier years are also investigated where the outlining of long-term trends makes it necessary and the availability of data enables it. Generally, Artner – Sőreg (2018) provides a comprehensive picture about the labour market and social processes of the European Union, while the wage and salary conditions of Hungary, are analysed in more detail and in regional context by Artner, Sőreg & Sőreg (2019).
Labour market – employment conditions and productivity
In short, after the global economic crisis, starting from 2010, we noticed an above-the European-average improvement in the level of employment in Hungary, which raised the country from the bottom to the middle range of EU countries. Still, the unemployment rate of the 15-24 years old population remains a serious issue to be solved. The quality of the Hungarian employment is relatively good in international comparison. However, despite the recent declining trend, the number of weekly working hours is still high and the wages, despite their raise in the last years, are increasingly lagging behind even the average of the CEE region. Hungary is also performing poorly in raising labour productivity. It is the consequence of its semi-peripheral position in the world economy that has been further deepened by the policies of the – by now down trending – unproductive public work program. On the other hand, most policy decisions in Hungary since the regime change of 1989, until nowadays have been visioning the model of integration into the international division of labour by purely serving the interests of trans- and multinational corporations by keeping the level of wages expressed in USD or Euro low.
The above-mentioned arguments are reflected in the following data.
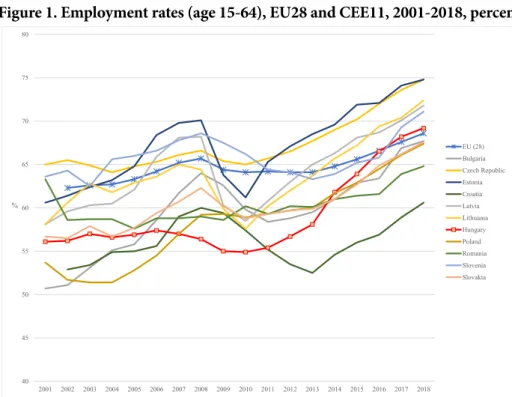
In the first decade of the twenty-first century, the Hungarian employment rate was among the lowest in Europe. In 2001, it ranked the 23rd among later 28 EU Member States, but in the following years, the situation has further worsened. In 2009-2010 the Hungarian employment rate was the lowest in the EU, significantly diverging also from other economies in the CEE11 group (Figure 1). Since 2011 and especially after 2013, employment has started to increase. This was due, first, to the expansion of the public work program that was incentivized by the very short duration of the unemployment benefit (3 months – the lowest in the EU), but later also due to the booming production, led by the multinational companies, and the increasing employment abroad. In the period of 2010- 2018, 1.8 million new jobs were created in the EU and Hungary gave six percent of this.
The Public Work Scheme (PWS) was launched by the conservative government in 2010 and since then it has replaced almost all other labour market tools, like the active labour market policies, including training. The PWS has played an important role on the labour market until 2016, when the number of employees (the so-called “fostered workers”) in the program reached 202 thousand. In 2019, it has shrunk to half of that (HCSO Table 2.1.35.). Between 2010Q1 and 2019Q3 the number of employees has increased by 842 thousand and 12 percent of this was given by the Public Work Scheme, the employees of which earn less than the official minimum wage set by the government.
By 2018, Hungary had achieved an employment rate (69.2%) a bit above the EU average, which places the country in a middle-ranking position among the member states. It will be much more difficult to move upward in the rankings from this position
since other countries have been also experiencing similar trends: although in 2019 the Hungarian employment rate has further increased and reached 70.0 percent in the second quarter of 2019, this was enough only for the 17th place in the EU, below the median.
Figure 1. Employment rates (age 15-64), EU28 and CEE11, 2001-2018, percent
Source: Eurostat (2019a).
Due to the expansion of employment opportunities and mass emigration, youth unemployment has significantly decreased, mainly within the 25-29 age group. In this age group the proportion of young people in 2008 of those who were not in employment, education or training (NEETs) in Hungary was 23.4 percent. At that time, it was the second highest ratio within the EU28 but, by 2018, it had fallen to 16.5 percent which represented only the 10th highest value. However, concerning the group of 15-24-year- olds, the situation is far from satisfactory. Their NEETs-rate has been only slowly moderating in the EU and the Hungarian ratio is steadily among the higher ones (at the upper third of the EU28).
The quality-related characteristics of the Hungarian employment situation might be considered relatively good in European comparison. The proportion of people forced to make ends meet from having multiple jobs at one time is quite low, in 2018 composing only 1.4 percent, far below the EU28 average, only Bulgaria’s, Slovakia’s and Croatia’s data are lower (Eurostat 2019f). The proportion of those working regularly more than 48 hours (“long working hours”) per week is 3.2 percent, barely the third of the EU28 average, and being the 5th lowest in the Union after Lithuania, Bulgaria, Romania and Latvia (Eurostat 2019g). The ratio of those working in atypical working time (during the
40 45 50 55 60 65 70 75 80
2001 2002 2003 2004 2005 2006 2007 2008 2009 2010 2011 2012 2013 2014 2015 2016 2017 2018
%
EU (28) Bulgaria Czech Republic Estonia Croatia Latvia Lithuania Hungary Poland Romania Slovenia Slovakia
evening or at night, on Saturdays or Sundays, in variable shifts) is only 21.8 percent, the lowest in the Union (Eurostat 2019h) and it is also true for the ratio of weekend workers which was 8.8 percent in 2018 (Eurostat 2019i).
Yet, although having decreased compared to 2008, the number of regular hours worked in Hungary per week is still high. Most of the fall in average workload had proceeded before 2011. After that, the average number of weekly working hours had increased until 2014 and a significant moderation was experienced only in 2018. This oscillating trend led to the fact that, in 2018, the average weekly working hours became slightly, about 0.5 hour less than in 2008. However, this is not a good result in European comparison. The average hours worked per week have been falling more rapidly in most European countries over the recent decade (Figure 2).
Figure 2. Change in average number of usual weekly working hours between 2008 and 2018, hour
Source: Eurostat (2019b)
Thus, Hungarian employees belong to those who work the most in the European Union, and their relative position has even worsened in the last decade: in 2010 Hungarians, on average, worked 40.1 hours per week, which was the 10th highest within the EU28. Eight years later, in 2018, the slightly lower mean weekly workload of 39.6 hours in Hungary was 6th highest in the Union, tied with Croatia and Romania. It means that in 20 Member States people work less each week than in Hungary (at least in the formal employment to which the data refer). In parallel with these tendencies, the proportion of vacant positions has increased substantially. Until 2018, it had achieved a level three times higher than in 2009 (Eurostat 2019k) which reflects a growing shortage
-2.5 -2.0 -1.5 -1.0 -0.5 0.0 0.5 1.0 1.5
hour
of labour force and, in the same time, increases employers’ expectations towards the jobseekers and current employees.
Hungarians belong to those who have excessive workloads even in comparison to other CEE11 countries. Among the remaining ten CEE11 economies, only four (Bulgaria, Poland, the Czech Republic and Slovakia) are placed higher than Hungary in this aspect. The new article of the Hungarian Labour Code, (the above mentioned “Slave Law”), should be assessed in the light of the above. The Code came into effect on the 1st January 2019 and generated great social outrage. According to this new legislation, Hungarian employees – above their legal and regular annual working hours – might be requested to work up to 400 hours of overtime in a year, instead of the previous upper limit of 250 extra hours annually (Karasz & Kingsley 2018).
The normal working time in full time jobs is eight hours per day, which makes 40 hours of weekly workload, but the “schedule-based work time” allows a maximum 48 hours worked per week. Even this 48-hour is an average, which can be calculated on the bases of a longer (maximum 12-month) period, called working time framework. This legislation is corresponding to the EU’s law according to which the workload of 48 hours per week (including overtime) is the legitimate maximum. But all this means that a Hungarian employee might be asked to complete even more working hours in a week, if his/her working time is less than 48 hours in the next weeks. The legal concept of the working time framework (48 hour per week as an average on longer term) enables employers to compensate for overtime much later or even not paying any compensation at all (e.g. if the enterprise ceases to exist). With the introduction of new regulation regarding overtime allowance and compensation in 2019, Hungarian lawmakers extended the deadline to employers for compensating extra hours up to 3 years. It must be noted that the previous annual maximum of 250 extra working hours might had been surpassed even before 2019 in case of many professions, and it indeed, been done (e.g. in the healthcare system), yet, the deadline of compensation after any overtime was maximum 12 months back then.
The weekly working time is determined by the capital intensity of the applied technology and the strength of the representation of employees’ interests. In case of (semi-)periphery economies – like the CEE11 – usually both factors are weak: production technologies are more labour intensive and so productivity is lower than in the centre countries and trade unions are less potent as well. These features are also valid for Hungary.
Low wages are silent promoters of long working hours since they increase employees’
willingness to overwork in order to gain some additional income (“For workers with very low wages, overtime may be a structural necessity to make ends meet”, Anxo – Karlsson 2019:1).
At the same time, such situation in the labour market encourages the mass emigration of younger and/or more educated and talented employees, that causes a great loss for the national economy and its potential future development. On the other hand, these tendencies have a backlash on the Hungarian labour market by e.g. bidding up wages as a response to the shrinking labour supply, especially in professions requiring high qualifications or in case of young and mobile people – as reports show (Dustmann, Frattini & Rosso 2015, Elsner 2013).
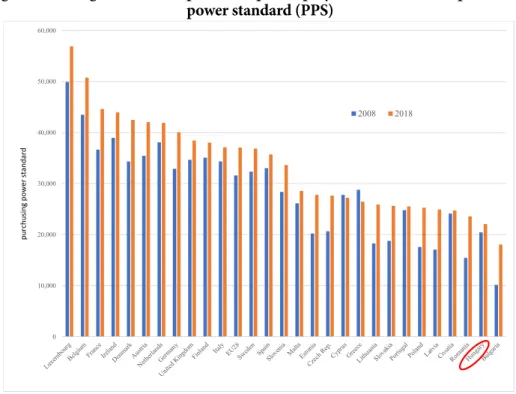
Wages have been growing in Hungary in recent years as well, but are still far from a sufficient degree: the purchasing power parity (PPS) based compensation per employee in 2018 was the 2nd lowest in Hungary within the EU28, only Bulgaria had lower values (Figure 3). What is more, wages are increasing much more dynamically in Bulgaria starting from a lower level than Hungary and if this trend is not going to change in the near future Hungarian employees are soon expected to become the lowest-paid employees in the Union (Artner, Sőreg & Sőreg 2019).
Figure 3. Average annual compensation per employee, 2008 and 2018, purchasing power standard (PPS)
Sources: Eurostat (2019c)
Lower wages are usually beneficial for profits but do not inspire productivity- enhancing investments. If unit labour costs might be kept low without expensive labour- saving technological modernization, why would capital-owners make investments? In Hungary, the growth rate of labour productivity has slowed down significantly over recent years. Between 2000 and 2008 labour productivity grew by 37.3 percent and with this rate the country has achieved the 6th best position among the 28-member European Union. The first full crisis year, 2009, caused a sudden decrease that was followed by an upward trend. During the eight years between 2010 and 2018, the total improvement was only about a quarter what was achieved in the period of 2000-2008 or 9.3 percent, meaning a medium performance in the EU28 (Eurostat 2019c).
The Hungarian productivity has been significantly lagging even behind other Central and Eastern European countries. Since 2010 the Hungarian improvement of
0 10,000 20,000 30,000 40,000 50,000 60,000
2008 2018
purchusingpower standard
productivity was the slowest within the CEE11 group (Figure 4). In 2018, the GDP per hour worked reached 33.38 USD (PPS) in Hungary, not only far below the German data (59.23 PPS) and the average of the EU28 (48.56 PPS), but also being the fourth lowest within the CEE11, after Latvia (32.04 PPS), Romania (29.55 PPS) and Bulgaria (22.9 PPS) (OECD 2019).
Figure 4. Change in labour productivity per hour worked in the CEE11, 2010-2018, (2010=100)
Source: Eurostat (2019c)
Long working hours and low productivity usually indicate high work intensity, although this is difficult to measure. According to surveys conducted by Hungarian trade unions, employees are suffering from the pressure from the employers for intensive, continuous work, frequent weekend shifts and short and rare breaks within and between working days even in the modern and automatized foreign factories (Vasas 2019).
Social conditions
The social status of the population is generally described by both the absolute and relative levels of household income and consumption (compared to a given societal average or reference group) and the level of social integration of households. These are estimated by several indicators of which the most relevant are the following:
• relative poverty (or “at risk of poverty rate”, cut-off point 60% of median equivalised income after social transfers);
80 90 100 110 120 130 140 150
2010 2011 2012 2013 2014 2015 2016 2017 2018
2010=100
Romania Latvia Poland Lithuania Bulgaria Slovakia Estonia Croatia Slovenia Czech Rep.
Hungary
• severe material deprivation (households which are struggling with at least four characteristics out of the below-mentioned nine due to financial reasons: 1) lagging with payments of loans and utility bills, 2) not being able to afford heating their home appropriately, 3) being unable to cover unexpected expenses, 4) not being able to consume meat, fish or other type of food equal in nutritional value every second day, 5) being unable to spend at least a week-long vacation apart from their permanent place of residence, 6) not having any vehicle, 7) washing machine, 8) colour television or 9) cell phone); material deprivation means being unable to afford three of these items.
• very low work intensity (the proportion of those living in households where the members aged 18-59 years managed to carry out paid work in less than one-fifth of their annual working potential in the previous year).
Based on these indicators it can be generally stated that the social conditions in Hungary have generally improved in the recent 4-5 years. However, this tendency has not been extraordinary in the EU28 as well as in the narrower, CEE11 region. For this, Hungary could only preserve its position relative to its regional neighbours.
The more detailed view based on data provided by Eurostat and the Hungarian Central Statistical Office (HCSO) concerning the above-specified indicators is showing the following picture. Firstly, between 2007 and 2010 the relative income poverty had been stable both in the absolute number of households concerned and their ratio to all households (12.3-12.4 percent). It increased to 15% in 2013-14 and started to moderate only after 2015, however was still higher in 2018 than between 2007-2010. The absolute number of Hungarian people living from less than 60 percent of the median income was 1,227 thousand in 2018 and their proportion reached 12.8 percent. This rate is lower than the EU28 average and it also belongs to the lower ratios in the CEE11 region. However, it was true previously as well: following 2005, only the Czech Republic, Slovakia and, except for some years (2010 and 2018), also Slovenia have been recording better values in this aspect than Hungary (Eurostat 2019n).
The rate of severe financial deprivation decreased in the pre-crisis years and increased suddenly following the crisis, while another shrinking phase can be observed after 2013. In 2018 it stood at 10.1 percent (974 thousand people) which meant a relevant improvement compared to the EU28 average. As, however, similar tendencies are occurring in other countries of the CEE11 group, the Hungarian position have not improved, i.e. remained in the middle ground in this aspect too (Eurostat 2019o).
Finally, the number of people living in households with very low work intensity started to increase following 2009 as a direct effect of the crisis and has been decreasing since 2013. In 2018, there were 398 thousand Hungarians within this group which is 5.7 of the population under 60 years of age and 4.1 percent of the total population. These values might be considered somewhat positive compared to the EU28 average. The Hungarian position has also improved within the CEE11, especially compared to the years between 2011 and 2014 when the elevated rate of around 13 percent was among the highest ones in the group. In 2018, the position of Hungary became near-average, as there had been five-five countries with a ratio above and below the Hungarian one, which is quite similar to the situation of 2005 (Eurostat 2019j).
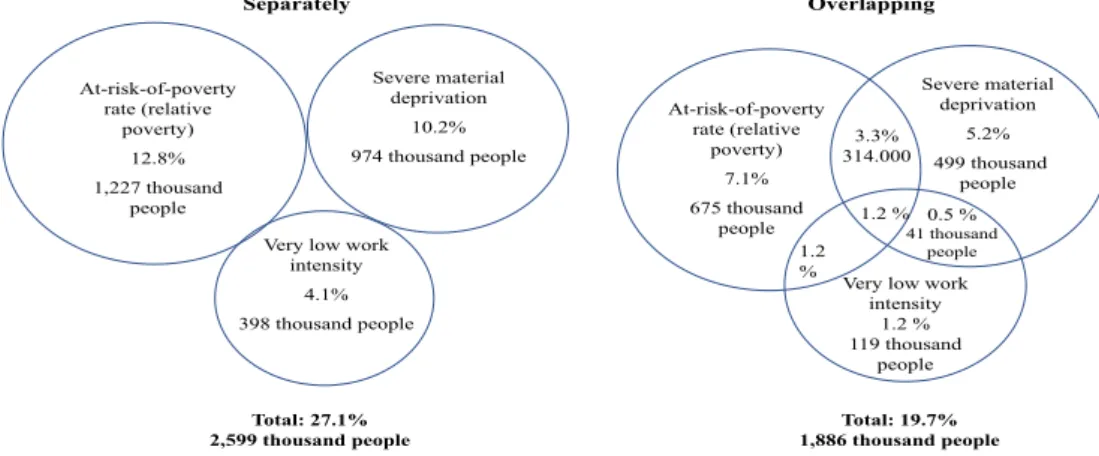
The so-called “At Risk of Poverty or Social Exclusion” (AROPE) indicator integrates the above discussed three variables. It is not only a simple sum or aggregate.
If it were, in 2018 there would be 2.6 million people in Hungary or 27.1 percent of the total population who would have been threatened by poverty or some form of social deprivation or exclusion (in this case, the ratio of those living in households with very low work intensity is measured compared to the proportion of total population). Still, by eliminating the possible duplications in the data, we are getting a considerably smaller number, only 1,886 thousand people that is 19.7 percent of the total population, as indicated by Figure 5, based on data of the HCSO. At this point, the attention should be drawn to a both interesting and disturbing problem. These data are gathered via household surveys. In Hungary, the sample includes about 0.25 percent of the households. Those who participate in the survey are keeping a register about their incomes and expenditures and at the end of the year are providing an interview about their consumption habits.
Data are published by the Statistical Office regarding the reference year (the year in which the date were collected). In contrast, Eurostat is publishing data concerning the year when the data have been gathered (which happens after the year in which the survey is done).
So, the previously presented data reflect the facts of a one-year-earlier status. That is why the title of the Figure 5 is “2017 (“reference year”) instead of “2018”.
Figure 5. Number and ratio of people at risk of poverty or social exclusion (AROPE) in Hungary in separate subgroups and combined, 2017 (reference year) percent and
number
Source: HCSO Tables, Stadat, 2.2.2.1. Indicators of poverty or social exclusion by reference year (2010–)
As emphasized in Figure 5, even taking the overlapping into consideration every fifth person is at risk of poverty or social exclusion in Hungary which is still the 9th largest proportion within the EU28. (In 2010, the ranking of Hungary was even worse with holding the 6th highest ratio). On the other hand, this ratio is significantly lower now than in any year after 2005. As being an aggregate variable, AROPE has described a trend line that is like other social indicators which we analysed earlier. Before 2008, the Hungarian AROPE was in decrease followed by a sudden growth until 2013, while it is trending down again since then. This resulted in a “catching up” (decreasing to) to the
At-risk-of-poverty rate (relative
poverty) 12.8%
1,227 thousand people
Severe material deprivation
10.2%
974 thousand people
Very low work intensity
4.1%
398 thousand people
At-risk-of-poverty rate (relative
poverty) 7.1%
675 thousand people
Severe material deprivation
5.2%
499 thousand people
Very low work intensity
1.2 % 119 thousand
people 314.0003.3%
0.5 % 41 thousand
people 1.2 %
1.2 %
Total: 27.1%
2,599 thousand people Total: 19.7%
1,886 thousand people
Separately Overlapping
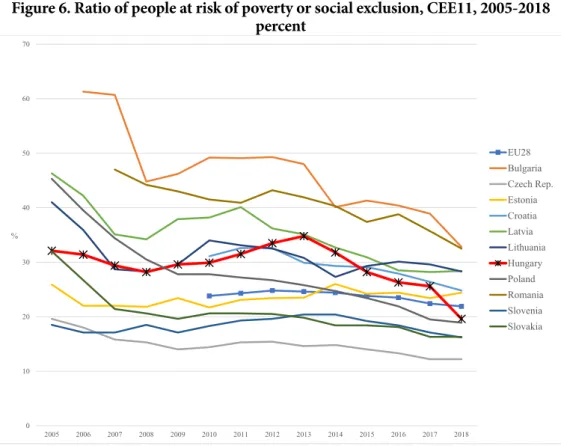
EU-average, while meaning no improvement relative to the CEE region. The Hungarian AROPE ratio was the fifth highest within the CEE11 group both in 2005 and in 2018.
There is one country, Poland that has taken over Hungary and there is also one, Estonia which has been outrun by Hungary in decreasing the risk of poverty and social exclusion.
Consequently, at present the proportion of people belonging to this category is lower than in Hungary only in the Czech Republic, Slovakia, Slovenia and Poland (Figure 6).
Figure 6. Ratio of people at risk of poverty or social exclusion, CEE11, 2005-2018 percent
Source: Eurostat (2019d)
Based on the above-discussed indicators, the dimensions of poverty seem to shrink in Hungary even if not to a greater extent than in other countries of the CEE11 group. Yet, what has not improved but definitely worsened is the distribution of income.
The Gini-index, the most well-known indicator of income inequality, has been producing a mainly increasing tendency in the older and more developed member states of the Union. Within the CEE11 group it has rather fallen, at least after the 2008 crisis, due to the economic rebound (however, on a long-term, income inequalities are growing also within this region). There are only three exceptions from this recent trend of improving income equality: Bulgaria, Romania and Hungary. The Hungarian Gini coefficient of income was around 24-26 percent at the beginning of the 2000s and then increased rapidly up to 33.3 percent in 2006. That was followed by a sharp decline until 2010 achieving 24.1 percent.
Since then, however, it has been continuously growing and reached 28.7 percent in 2018.
Following the year of 2010, the worsening of income inequalities in Hungary expressed
0 10 20 30 40 50 60 70
2005 2006 2007 2008 2009 2010 2011 2012 2013 2014 2015 2016 2017 2018
%
EU28 Bulgaria Czech Rep.
Estonia Croatia Latvia Lithuania Hungary Poland Romania Slovenia Slovakia
by the Gini-index have been the 2nd most drastic in the EU28. Only Bulgaria has shown a larger increase regarding income inequalities (Eurostat 2019l).
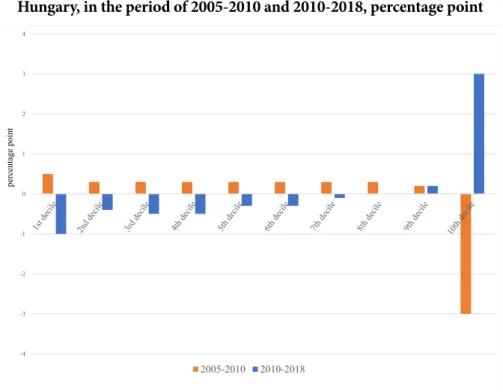
Another frequently used indicator of income inequality is the share of income deciles from the national income. Hungary is a weak performer in this regard as well:
while between 2005 and 2010 the overall share of the lower nine deciles increased and the uppermost deciles fell, after 2010 this trend has been reversed. Since then, only the upper two deciles’ share has grown, and particularly that of the top decile, i.e. the wealthiest 10 percent of the population (Figure 7).
Figure 7. Change in the share of income deciles from the national income in Hungary, in the period of 2005-2010 and 2010-2018, percentage point
Source: Author’s calculations on the bases of Eurostat (2019e)
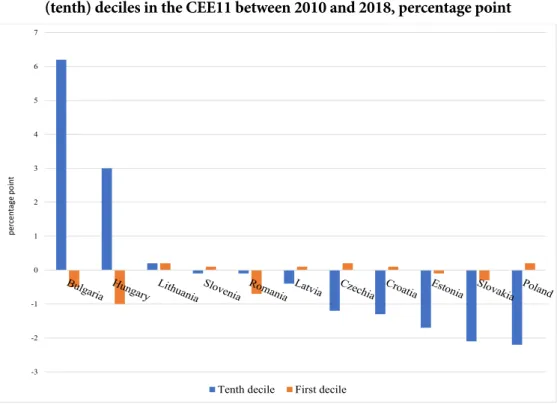
Within the CEE11 country group, only Bulgaria followed this path. In that country, between 2010 and 2018, the share of the tenth income decile from the national income increased by 6.2 percentage points, even at a higher rate than in Hungary. Besides, the overall share of the top income decile has grown also in Lithuania between 2010 and 2018, but this increase was very modest, only 0.2 percentage points. The most significant decrease in the share of the highest earners has been occurred in Poland (2.2 percentage points). The relative position of the poorest, namely the lowest income decile worsened in case of five and improved in six CEE-countries. The most dramatic loss of position of the first decile occurred in Hungary: the share of the poorest 10 percent of population was with a whole percentage point lower in 2018 than in 2010 (Figure 8).
-4 -3 -2 -1 0 1 2 3 4
2005-2010 2010-2018
percentage point
Figure 8. Change in the share of national income of the lowest (first) and highest (tenth) deciles in the CEE11 between 2010 and 2018, percentage point
-3 -2 -1 0 1 2 3 4 5 6 7
Tenth decile First decile
percentage point
Source: The Author’s own calculation based on Eurostat (2019e)
The deterioration of the social position of the most vulnerable Hungarians derives from the weakening of social policy. Since 2010, among the EU Member States only Ireland has decreased its social protection expenditures to a greater extent than Hungary. From 2010 to 2018 the weight of government expenditures on social protection deceased from 17.4 to 13.3 percent, on health from 5.0 to 4.7 percent and on education from 5.5 to 5.1 percent (combined from 27.9 to 23.1 percent) of GDP. In 2018, the EU28- average was considerably higher in case of the social protection and health (18.6 and 7.1 percent respectively), while lower in case of the education (4.7%). In Hungary, all subgroups in the social protection budget were affected by the cuts with sickness and disability allowances at the top (Eurostat 2019m).
The latest report of the IMF underpins these trends showing that people’s burden has increased while that of the employers decreased under the Hungarian “workfare”
governance. Measured as a percentage of GDP, between 2014 and 2018, current transfers to households including social security expenditures decreased, while personal income taxes and households’ actual social contributions increased. In the same period the share of employers’ actual social contributions and corporate taxes declined (IMF 2019:20).
Many elements of the socio-economic policy changes hit hard the most vulnerable, lower income strata of the Hungarian society, like the abolition of tax exemptions of the smallest incomes in the course of the introduction of the flat tax rate, the revision and restriction of the disability pensions, the shortening of the time of unemployment
benefits or the abolition or decrease of a number of social benefits and allowances, while the family allowance (payed monthly for every child under 18 years of age) has not been increased for 13 years, although food prices went up by 80 percent in that period.
This caused that the share of working poor (those who are at work and have an income, after social transfers, less than 60 % of the national median income) reached 8,4 percent in 2018. Although it is lower than the EU-average (9.5%) in the same year, but with 3.1 percentage points higher than was in 2010. This increase is the second highest in the EU28 after the United Kingdom (Eurostat 2020c). For this and other actions of the government (like lowering the age limit to compulsory education, creation of school police in schools teaching underprivileged children or the criminalization of homelessness etc.), Lakner & Tausz (2016:345) describe the social assistance system of the FIDESZ-KDNP- government as a “war against poor”.
At this point, the support for families has to be also mentioned. The Hungarian family benefit system is rather old and generous by international standards. It comprises financial and in-kind assistance to families with children. In the last decade, the system was restructured to serve the purpose of increasing the fertility rate. The state offers grants and cheap credits to families for home and automobile purchases. These, however, can be fully exploited only by the more affluent families. The same is true for the family tax allowance that was introduced in 2011 and extended in 2014. This scheme has left hundreds of billions HUF at the disposal of families. Between 2011 and 2019 it was equal with about 0.6 percent of the Hungarian GDP (Kormany 2019). Spending this money has boosted the demand for consumer goods and housing and hereby contributed to the economic growth. However, the concomitant real estate bubble drove housing and rental prices up, which affected the population and particularly the lower income strata adversely.
At the same time, the upper strata and particularly the elite enjoy extra advantages, which are increasing day by day (Buckley & Byrne 2017, Dunai 2018, Bátorfy 2019, Sarnyai 2019, Von der Brelie 2020). The reduction of the employers’ social contributions (not that of the employees!), the introduction and later decrease of the flat income tax rate (which is more beneficial for the better-paid) or the rise of remuneration of top government officials also belong to the row.
Against this background, it came as no surprise that Hungary has fallen seven places back in the Human Development Index since 2010. In 2018, it was the 43th, being able to precede only Croatia, Bulgaria and Romania within the EU (HDI Reports).
Hungary has slipped back also in the prosperity index from the 37th place to the 46th one between 2009 and 2018, although it is mainly for political reasons (Legatum Institute 2019).
Conclusions
After 2010, in a period of general economic prosperity in the more peripheral Member States of the EU, which has been fuelled also by the contributions of the European structural funds, some dimensions of the Hungarian labour market, both qualitatively and quantitatively have improved and thus the country was able to preserve its near- average position within the CEE11 group. Due to the increasing employment rate the wages also grew, particularly in the most recent years, but their trend is still diverging
from the EU28 average and even compared to the CEE11 regional mean. Similarly, although labour productivity and social conditions have been improving in the last years, this has enabled Hungary only to preserve, but not improve its relative positions. Finally, income inequalities have been spectacularly increasing since 2010 and from this aspect, Hungary is unfortunately holding one of the top three positions in both the EU28 and the CEE11. These results lead to the conclusion that the illiberal “workfare” policy cannot prove its superiority over other courses in general, while proved to be detrimental to the social cohesion.
Despite that and the increasing criticism and outrage within the society against the autocracy of the government, the popular support of the “illiberal, work-based democracy” is still strong in Hungary. This is explained by social and political reasons.
On the one hand, the family benefit system is popular among the middle class, irrespective of the fact that it helps families unequally. The merit of “hard working” is also widely recognised among those who have relatively well-paid job and so it can be successfully used against the most vulnerable (un- or underemployed, marginalized ethnic minorities, refugees etc.) The public work program is popular among people who cannot find job otherwise, despite the very low – in 2020 half of the national minimum – wage what the scheme offers to them. The public work program serves as a “minimum of social protection and a sense of belonging to those who live on the ‘periphery’s periphery’.
Although this is not much, it is more than what […] the liberal predecessors [of the FIDESZ-KDNP] have done for these people” (Scheiring & Szombati 2019). This, however, means a stabilization of their standard of living on a very low level and without the promise of the possibility for lifting out of the peripheral, precarious and state-dependent position.
On the other hand, on the political palette no alternative formation is seen that would be able to better manage the country. The deconstruction of the welfare state has begun with the previous liberal governance and the political opposition is scattered now.
Phillips et al (2006) describe that the neoliberal retrenchment of the welfare state in Hungary was rooted in the 1968 market reforms and unfolded after the systemic change, particularly after 1995. They also present how all these have been strongly connected to the change of the philosophy of economic governance, which have become increasingly
“finance-driven” during the decades. The authors underline that the efficient social policy and welfare management require an economic governance “that is not merely coherent, authoritative and competent (elements that are a sine qua non for everything else), but one where policy-making is (a) not automatically dominated by budgetary concerns and hence finance ministries, (b) where there is only one basis of authority around which responsibilities for strategic economic planning and coordination are organised and (c) where the balancing of economic and social priorities is not constrained to the options available in the neoliberal lexicon.” Although the economic governance behind the present workfare policy in Hungary seems to satisfy these requirements, Phillips et al (2006) have surely not meant that. So, if we want a social welfare that serves social inclusion and equality, a reconfiguration of the economic as well as political governance is needed.
The novel coronavirus pandemic, which has been affecting the whole world
since the writing of this article, will have a significant socio-economic impact in many EU Member States, and will hopefully inspire positive changes benefiting the relationship between citizens and the welfare state.
References:
• Anxo, Dominique – Karlsson, Mattias (2019). Overtime work: A review of literature and initial empirical analysis. Conditions of Work and Employment Series No. 104, International Labour Organization, Geneva.
• Artner, Annamária – Sőreg, Ádám Pál – Sőreg, Krisztina (2019). Bérfelzárkózás Magyarországon: hipotézis vagy jól működő stratégia? [Wage Convergence in Hungary: Hypothesis or a Successful Strategy?] Munkaügyi Szemle, 62(5), pp. 2-16.
• Artner, Annamaria – Sőreg, Krisztina (2018). Worrying Labour Market Tendencies in the European Union. Romanian Journal of European Affairs 18(1) pp. 71-92.
• Bátorfy Attila (2019). Data visualization: see how the wealth and ranking of the richest 100 Hungarians changed over time. 23.05.2019. Átlátszó (English), https://english.
atlatszo.hu/2019/05/23/data-visualization-see-how-the-wealth-and-ranking-of-the- richest-100-hungarians-changed-over-time/.
• BBC (2018). Hungary president signs controversial ‘slave law’. 20 December 2018.
BBC News https://www.bbc.com/news/world-europe-46637216.
• Buckley, Neil – Byrne, Andrew (2017). Viktor Orban’s oligarchs: a new elite emerges in Hungary. Financial Times, December 21 2017, https://www.ft.com/content/
ecf6fb4e-d900-11e7-a039-c64b1c09b482.
• Dunai, Marton (2018). How Viktor Orban will tap Europe's taxpayers and bankroll his friends and family. March 15, 2018, Reuters, https://www.reuters.com/investigates/
special-report/hungary-orban-balaton/.
• Dustmann, Christian – Frattini, Tommaso – Rosso, Anna (2015): The Effect of Emigration from Poland on Polish Wages. The Scandinavian Journal of Economics.
117(2) pp. 522-564.
• EC (s.a.). European Structural and Investment Funds. Country Data for: Hungary.
European Commission. https://cohesiondata.ec.europa.eu/countries/HU.
• Elsner, Benjamin (2013). Emigration and wages: The EU enlargement experiment.
Journal of International Economics. 91(1) pp. 154-163.
• Eurostat (2019a). Employment rates by sex, age and citizenship, available at: https://
appsso.eurostat.ec.europa.eu/nui/show.do?dataset=lfsq_ergan&lang=en [accessed:
01.12.2019.]
• Eurostat (2019b). Average number of usual weekly hours of work in main job – hours. available at: https://appsso.eurostat.ec.europa.eu/nui/show.do?dataset=lfsa_
ewhun2&lang=en [accessed: 02.12.2019.]
• Eurostat (2019c). Labour productivity and unit labour costs, available at: https://
appsso.eurostat.ec.europa.eu/nui/show.do?dataset=nama_10_lp_ulc&lang=en [accessed: 02.12.2019.]
• Eurostat (2019d): People at risk of poverty or social exclusion by age and sex, available
at: https://appsso.eurostat.ec.europa.eu/nui/show.do?dataset=ilc_peps01&lang=en [accessed: 02.12.2019.]
• Eurostat (2019e). Distribution of income by quantiles - EU-SILC and ECHP surveys, available at: https://appsso.eurostat.ec.europa.eu/nui/submitViewTableAction.do [accessed: 02.12.2019.]
• Eurostat (2019f). Employed persons having more than one job by sex, available at: http://appsso.eurostat.ec.europa.eu/nui/show.do?dataset=tqoe3a5&lang=en [accessed: 02.12.2019.]
• Eurostat (2019g). Long working hours in main job by sex, age, professional status and occupation, available at: http://appsso.eurostat.ec.europa.eu/nui/show.
do?dataset=lfsa_qoe_3a2&lang=en [accessed: 01.12.2019]
• Eurostat (2019h). Employment at atypical working time as a percentage of the total employment, by age and European socio-economic group, available at: http://appsso.
eurostat.ec.europa.eu/nui/show.do?dataset=lfsa_esegatyp&lang=en [accessed: 02.12.
2019.]
• Eurostat (2019i). Work on weekends by sex, age, professional status and occupation, available at: http://appsso.eurostat.ec.europa.eu/nui/show.do?dataset=lfsa_
qoe_3b3&lang=en [accessed: 02.12.2019.]
• Eurostat (2019j). People living in households with very low work intensity by age and sex (population aged 0 to 59 years) available at: http://appsso.eurostat.ec.europa.eu/
nui/show.do?lang=en&dataset=ilc_lvhl11 [accessed: 02.12.2019.]
• Eurostat (2019k). Job vacancy rate by NACE Rev. 2 activity, annual data, available at:
https://appsso.eurostat.ec.europa.eu/nui/show.do?dataset=jvs_a_rate_r2&lang=en [accessed: 02.12. 2019.]
• Eurostat (2019l). Gini coefficient of equivalised disposable income, available at: http://
appsso.eurostat.ec.europa.eu/nui/show.do?lang=en&dataset=ilc_di12 [accessed:
02.12. 2019.]
• Eurostat (2019m). General government expenditure by function (COFOG), available at: http://appsso.eurostat.ec.europa.eu/nui/show.do?dataset=gov_10a_
exp&lang=eng [accessed: 02.12.2019.]
• Eurostat (2019n). At-risk-of-poverty rate by poverty threshold, age and sex - EU- SILC and ECHP surveys, available at: http://appsso.eurostat.ec.europa.eu/nui/show.
do?dataset=ilc_li02 [accessed: 02.12. 2019.]
• Eurostat (2019o). Severe material deprivation rate by age and sex, available at: http://
appsso.eurostat.ec.europa.eu/nui/show.do?lang=en&dataset=ilc_mddd11 [accessed:
02.12. 2019.]
• Eurostat (2020a). GDP and main components (output, expenditure and income) https://appsso.eurostat.ec.europa.eu/nui/show.do?dataset=nama_10_gdp&lang=en [accessed: 01.02.2020.]
• Eurostat (2020b). Main GDP aggregates per capita, available at: https://appsso.
eurostat.ec.europa.eu/nui/show.do?dataset=nama_10_pc&lang=en [accessed:
01.02.2020.]
• Eurostat (2020c). In-work at-risk-of-poverty rate by age and sex, available at: https://
appsso.eurostat.ec.europa.eu/nui/show.do?dataset=ilc_iw01&lang=en [accessed:
01.02.2020.]
• HCSO Tables (STADAT – Themes) – Time series of annual data and Infra-annual data. Hungarian Central Statistical Office https://www.ksh.hu/engstadat [accessed:
02.12.2019.]
• HDI Reports 1990-2019. United Nations Development Programme. Human Development Reports 1990-2019. http://hdr.undp.org/en/global-reports.
• IMF (2019). Hungary: 2019 Article IV Consultation-Press Release; Staff Report; and Statement by the Executive Director for Hungary. IMF Country Report No. 19/357.
International Monetary Fund. European Dept. December 5. https://www.imf.org/en/
Publications/CR/Issues/2019/12/04/Hungary-2019-Article-IV-Consultation-Press- Release-Staff-Report-and-Statement-by-the-48848.
• Karasz, Palko – Kingsley, Patrick (2018). What Is Hungary’s ‘Slave Law,’ and Why Has It Provoked Opposition? The New York Times, Dec. 22, https://www.nytimes.
com/2018/12/22/world/europe/hungary-slave-law.html Downloaded: 17.11.2019.
• Keszthelyi, Christian (2015). PM: Hungary is a ‘workfare society’. Budapest Business Journal, June 22, 2015. https://bbj.hu/politics/pm-hungary-is-a-workfare- society_99622.
• Kormany (2019): Kilenc év alatt 2250 milliárd forint családi adókedvezmény. [2,250 billion forint family tax allowance in nine years] 2019. február 6. https://www.
kormany.hu/hu/nemzetgazdasagi-miniszterium/parlamenti-allamtitkarsag/hirek/
kilenc-ev-alatt-2250-milliard-forint-csaladi-adokedvezmeny.
• Lakner Z., – Tausz K. (2016) From a Welfare to a Workfare State: Hungary. In:
Schubert K., de Villota P., Kuhlmann J. (eds) Challenges to European Welfare Systems.
Springer.
• Legatum Institute (2019). The Legatum Prosperity IndexTM. 2019. A tool for transformation. Thirteenth Edition. https://www.prosperity.com/download_file/
view_inline/3690.
• OECD (2019). OECD Productivity Statistics. GDP per hour worked. Interactive online database. https://data.oecd.org/lprdty/gdp-per-hour-worked.htm.
• Orbán, Viktor (2014). Prime Minister Viktor Orbán’s Speech at the 25th Bálványos Summer Free University and Student Camp. 26 July 2014, Tusnádfürdő (Băile Tuşnad), Romania. https://www.kormany.hu/en/the-prime-minister/the-prime- minister-s-speeches/prime-minister-viktor-orban-s-speech-at-the-25th-balvanyos- summer-free-university-and-student-camp.
• Orbán, Viktor (2015). Speech on GLOBSEC 2015: Session 2: Dynamic Visegrad:
Energy, Growth, Competitiveness. Youtube Video PART1, at 1:03:03. https://www.
youtube.com/watch?v=aVBARcSli3Q&feature=youtu.be&t=1h37s.
• Phillips, Richard – Henderson, Jeffrey – Andor, Laszlo – Hulme, David (2006):
Usurping Social Policy: Neoliberalism and Economic Governance in Hungary.
Journal of Social Policy 35(4): 585-606.
• Sarnyai, Gábor (2019). While the Hungarian Elite Flourishes, the Middle Class Steadily Diminishes. 2019.01.14. Hungary Today, https://hungarytoday.hu/while- the-hungarian-elite-flourishes-the-middle-class-steadily-diminishes/.
• Scharle, Ágota – Szikra, Dorottya (2015). Recent Changes Moving Hungary away
from the European Social Model. In: Daniel Vaughan-Whitehead (Ed.) The European Social Model in Crisis. Is Europe Loosing its Soul? Edward Elgar Publisher, Cheltenham.
Chapter 6, pp. 289-339.
• Scheiring, Gábor – Szombati, Kristóf (2019). The structural trap of labour politics in Hungary. August 4, 2019. Rupture Magazine, https://rupturemagazine.
org/2019/08/04/the-structural-trap-of-labour-politics-in-hungary-gabor-scheiring- kristof-szombati/.
• Szikra, Dorottya (2018). Welfare for the Wealthy – The Social Policy of the Orbán- regime, 2010-2017. March 2018, Friedrich Ebert Stiftung, Analysis https://library.fes.
de/pdf-files/bueros/budapest/14209.pdf.
• The Budapest Beacon (2016). German companies get lion’s share of Hungarian state subsidies since 2004. September 17, 2016. https://budapestbeacon.com/german- companies-get-lions-share-of-hungarian-state-subsidies-since-2004/.
• Vasas (2019). Fókuszban: Kecskemét. Munkakörülmények a kecskeméti autóiparban.
[Kecskemet in Focus. Working conditions in the automotive industry of Kecskemet.] Vasas Szakszervezeti Szövetség. [Hungarian Metalworkers’ Federation] https://www.fes- budapest.org/fileadmin/user_upload/dokumente/pdf-dateien/Kecskemet20190618.
pdf.
• Von der Brelie, Hans (2020). Land grab: Hungary's political elite accused of milking the system. Euronews. 23/03/2020 https://www.euronews.com/2020/01/17/land- grab-hungary-s-political-elite-accused-of-milking-the-system.